
True Deviation Indicator
$39.99/ month
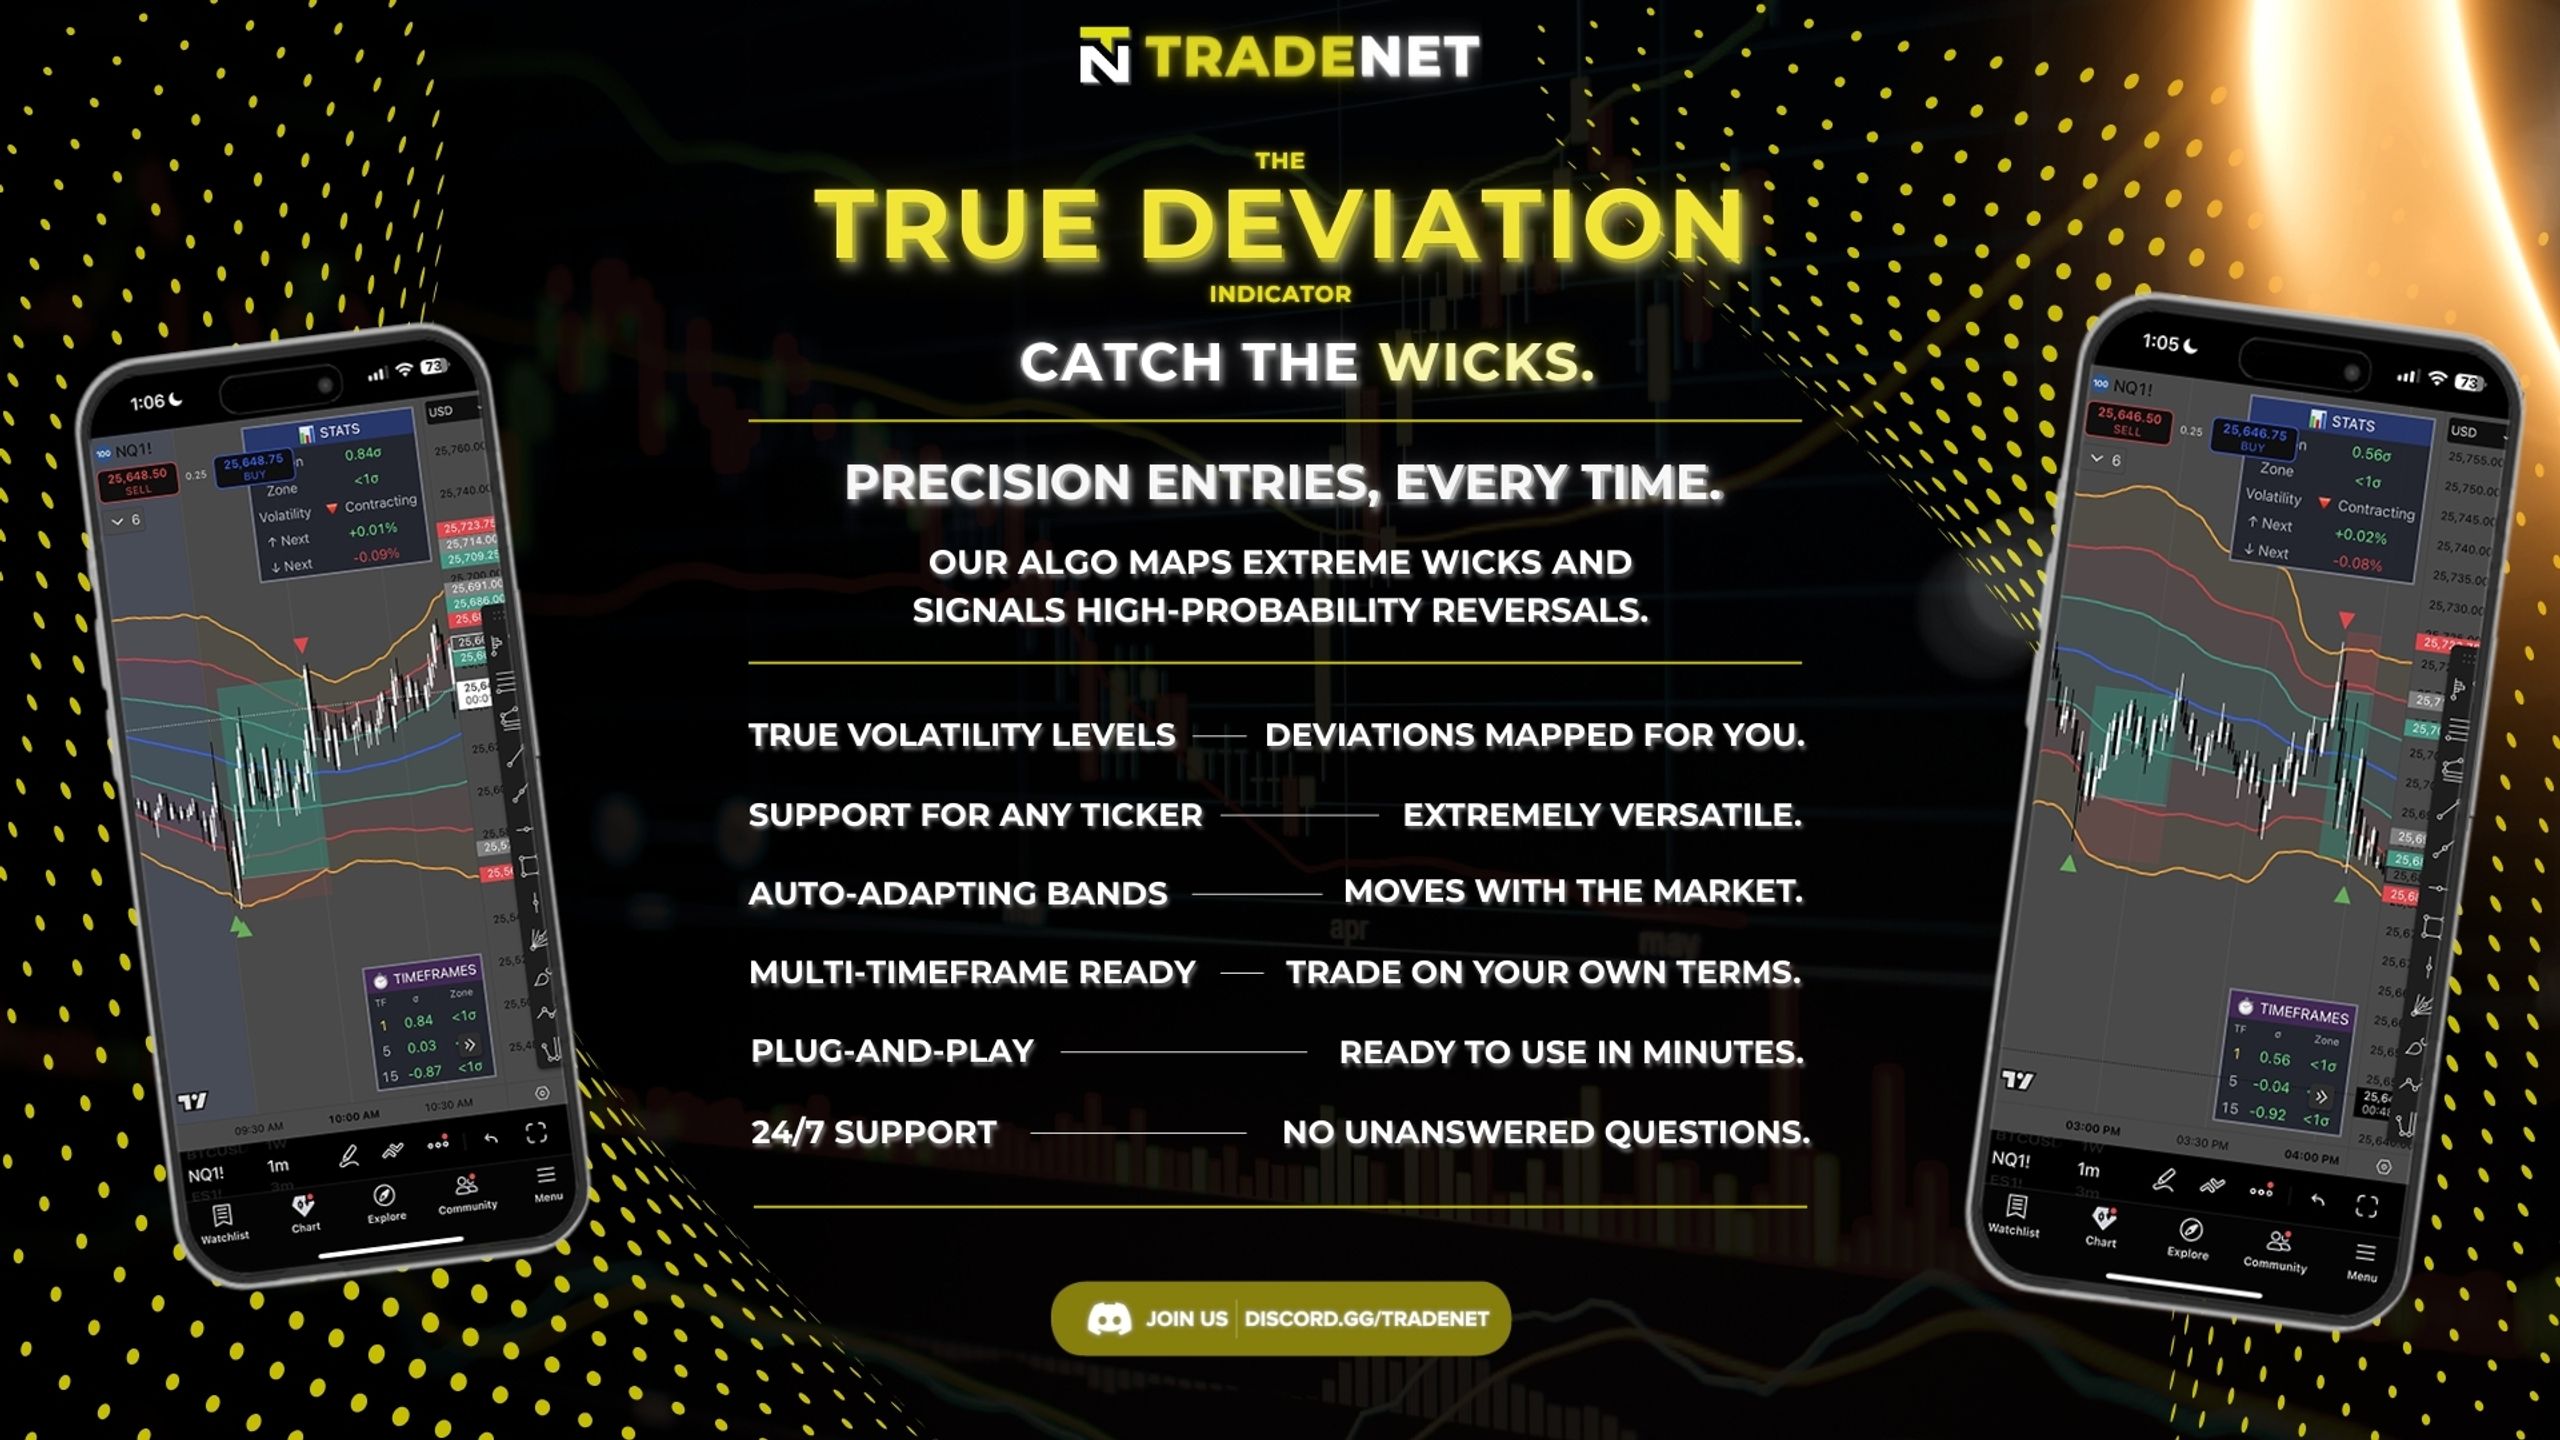
A statistical edge for timing precise entries and exits.
Stop guessing where the move is “oversold” or “overbought.”
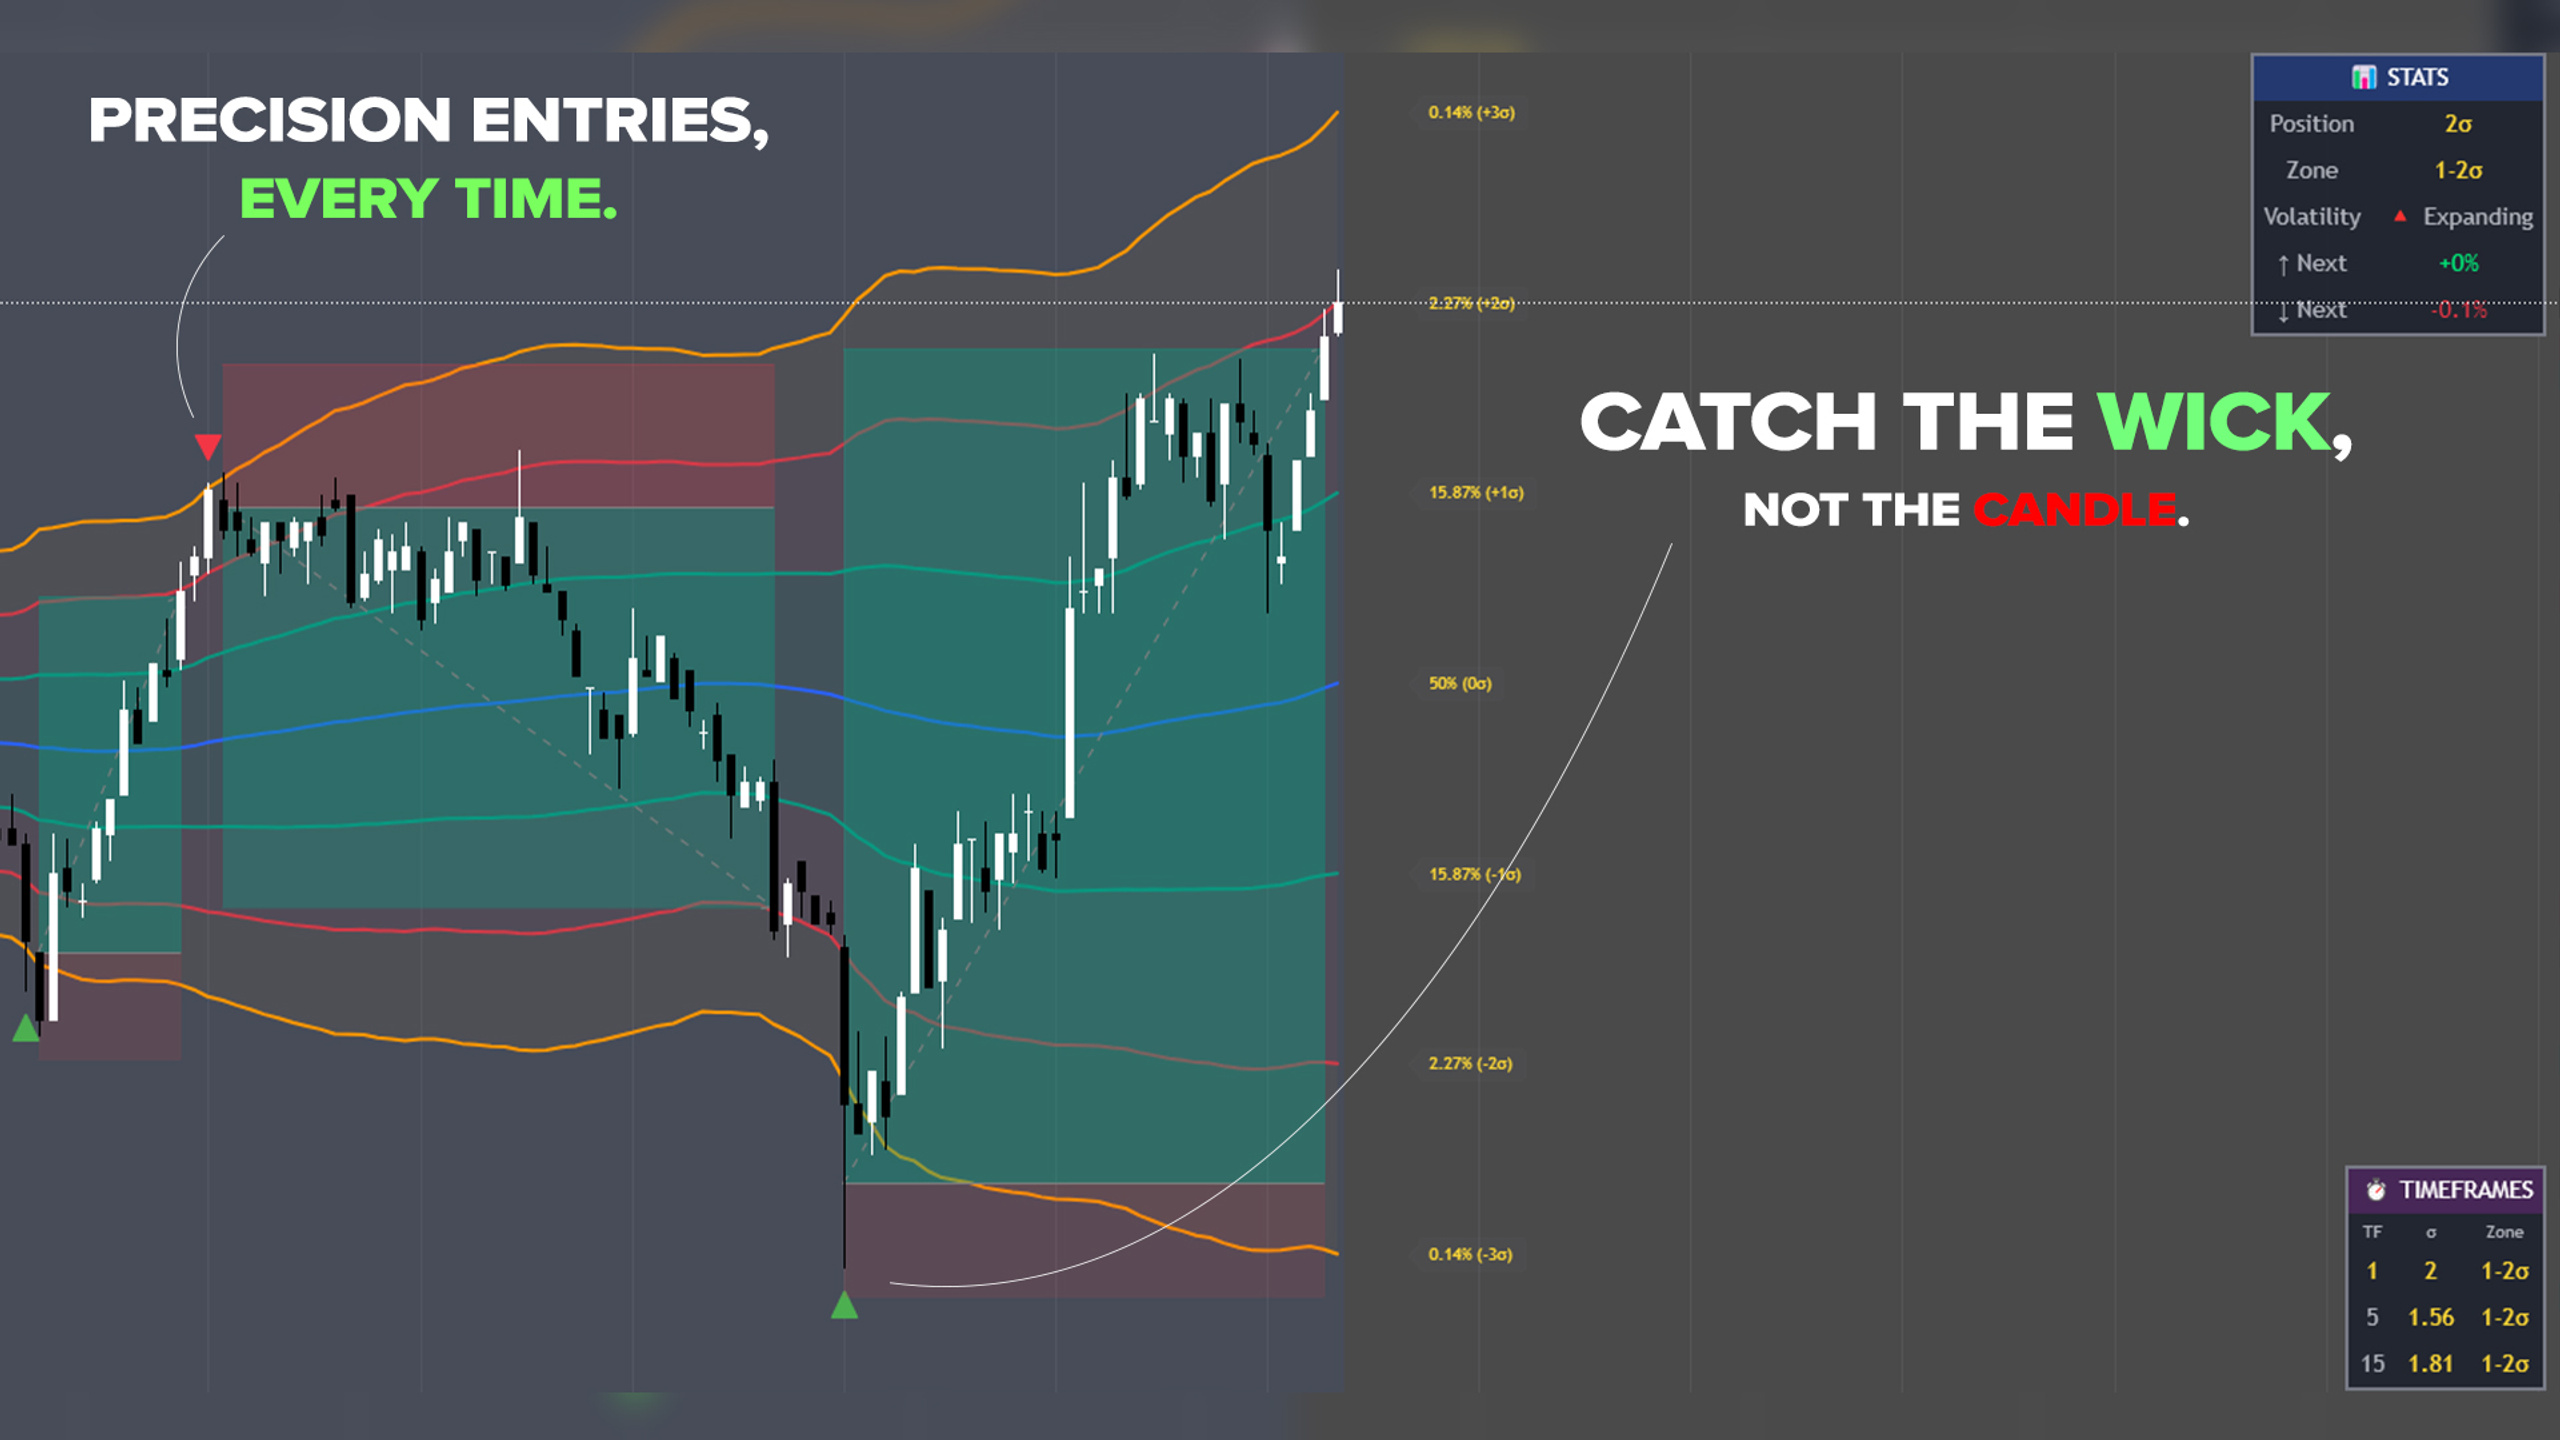
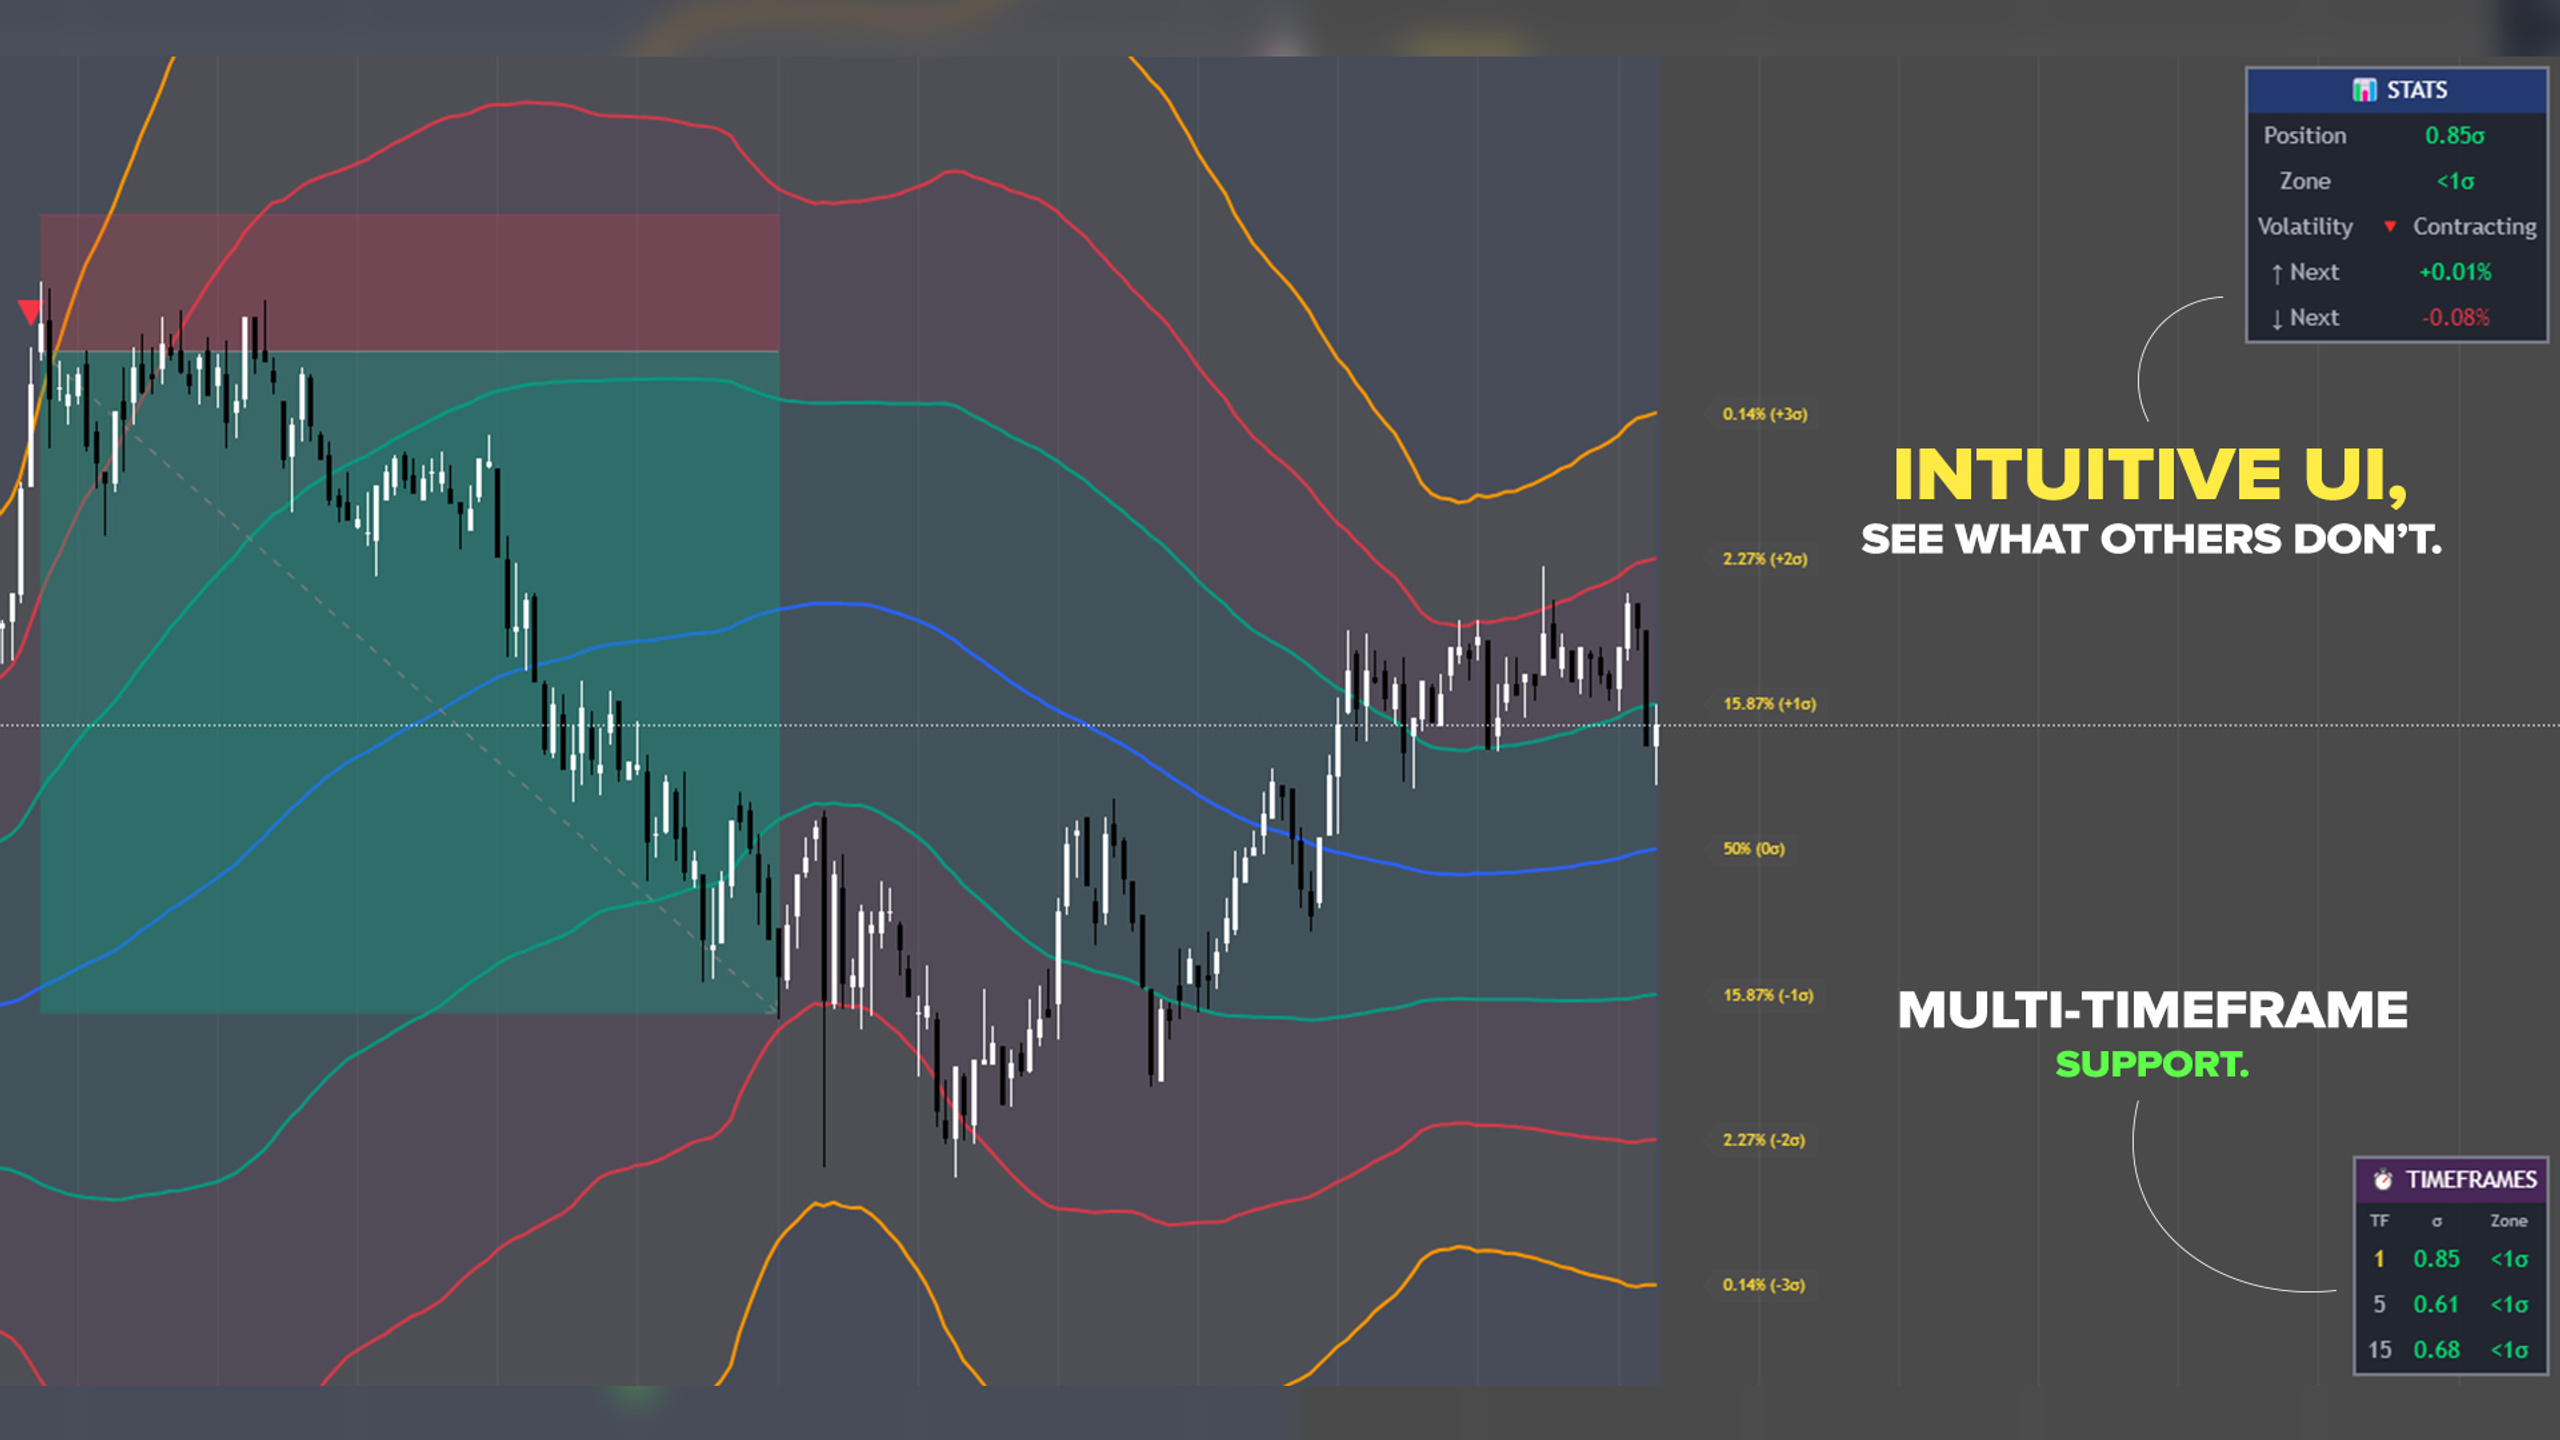
The True Deviation Indicator (TDI) uses live standard-deviation math to map true extremes on the chart - the spots where price is statistically stretched, liquidity is grabbed, and reversals are most likely to snap back - designed to be used in confluence with existing strategy or system.
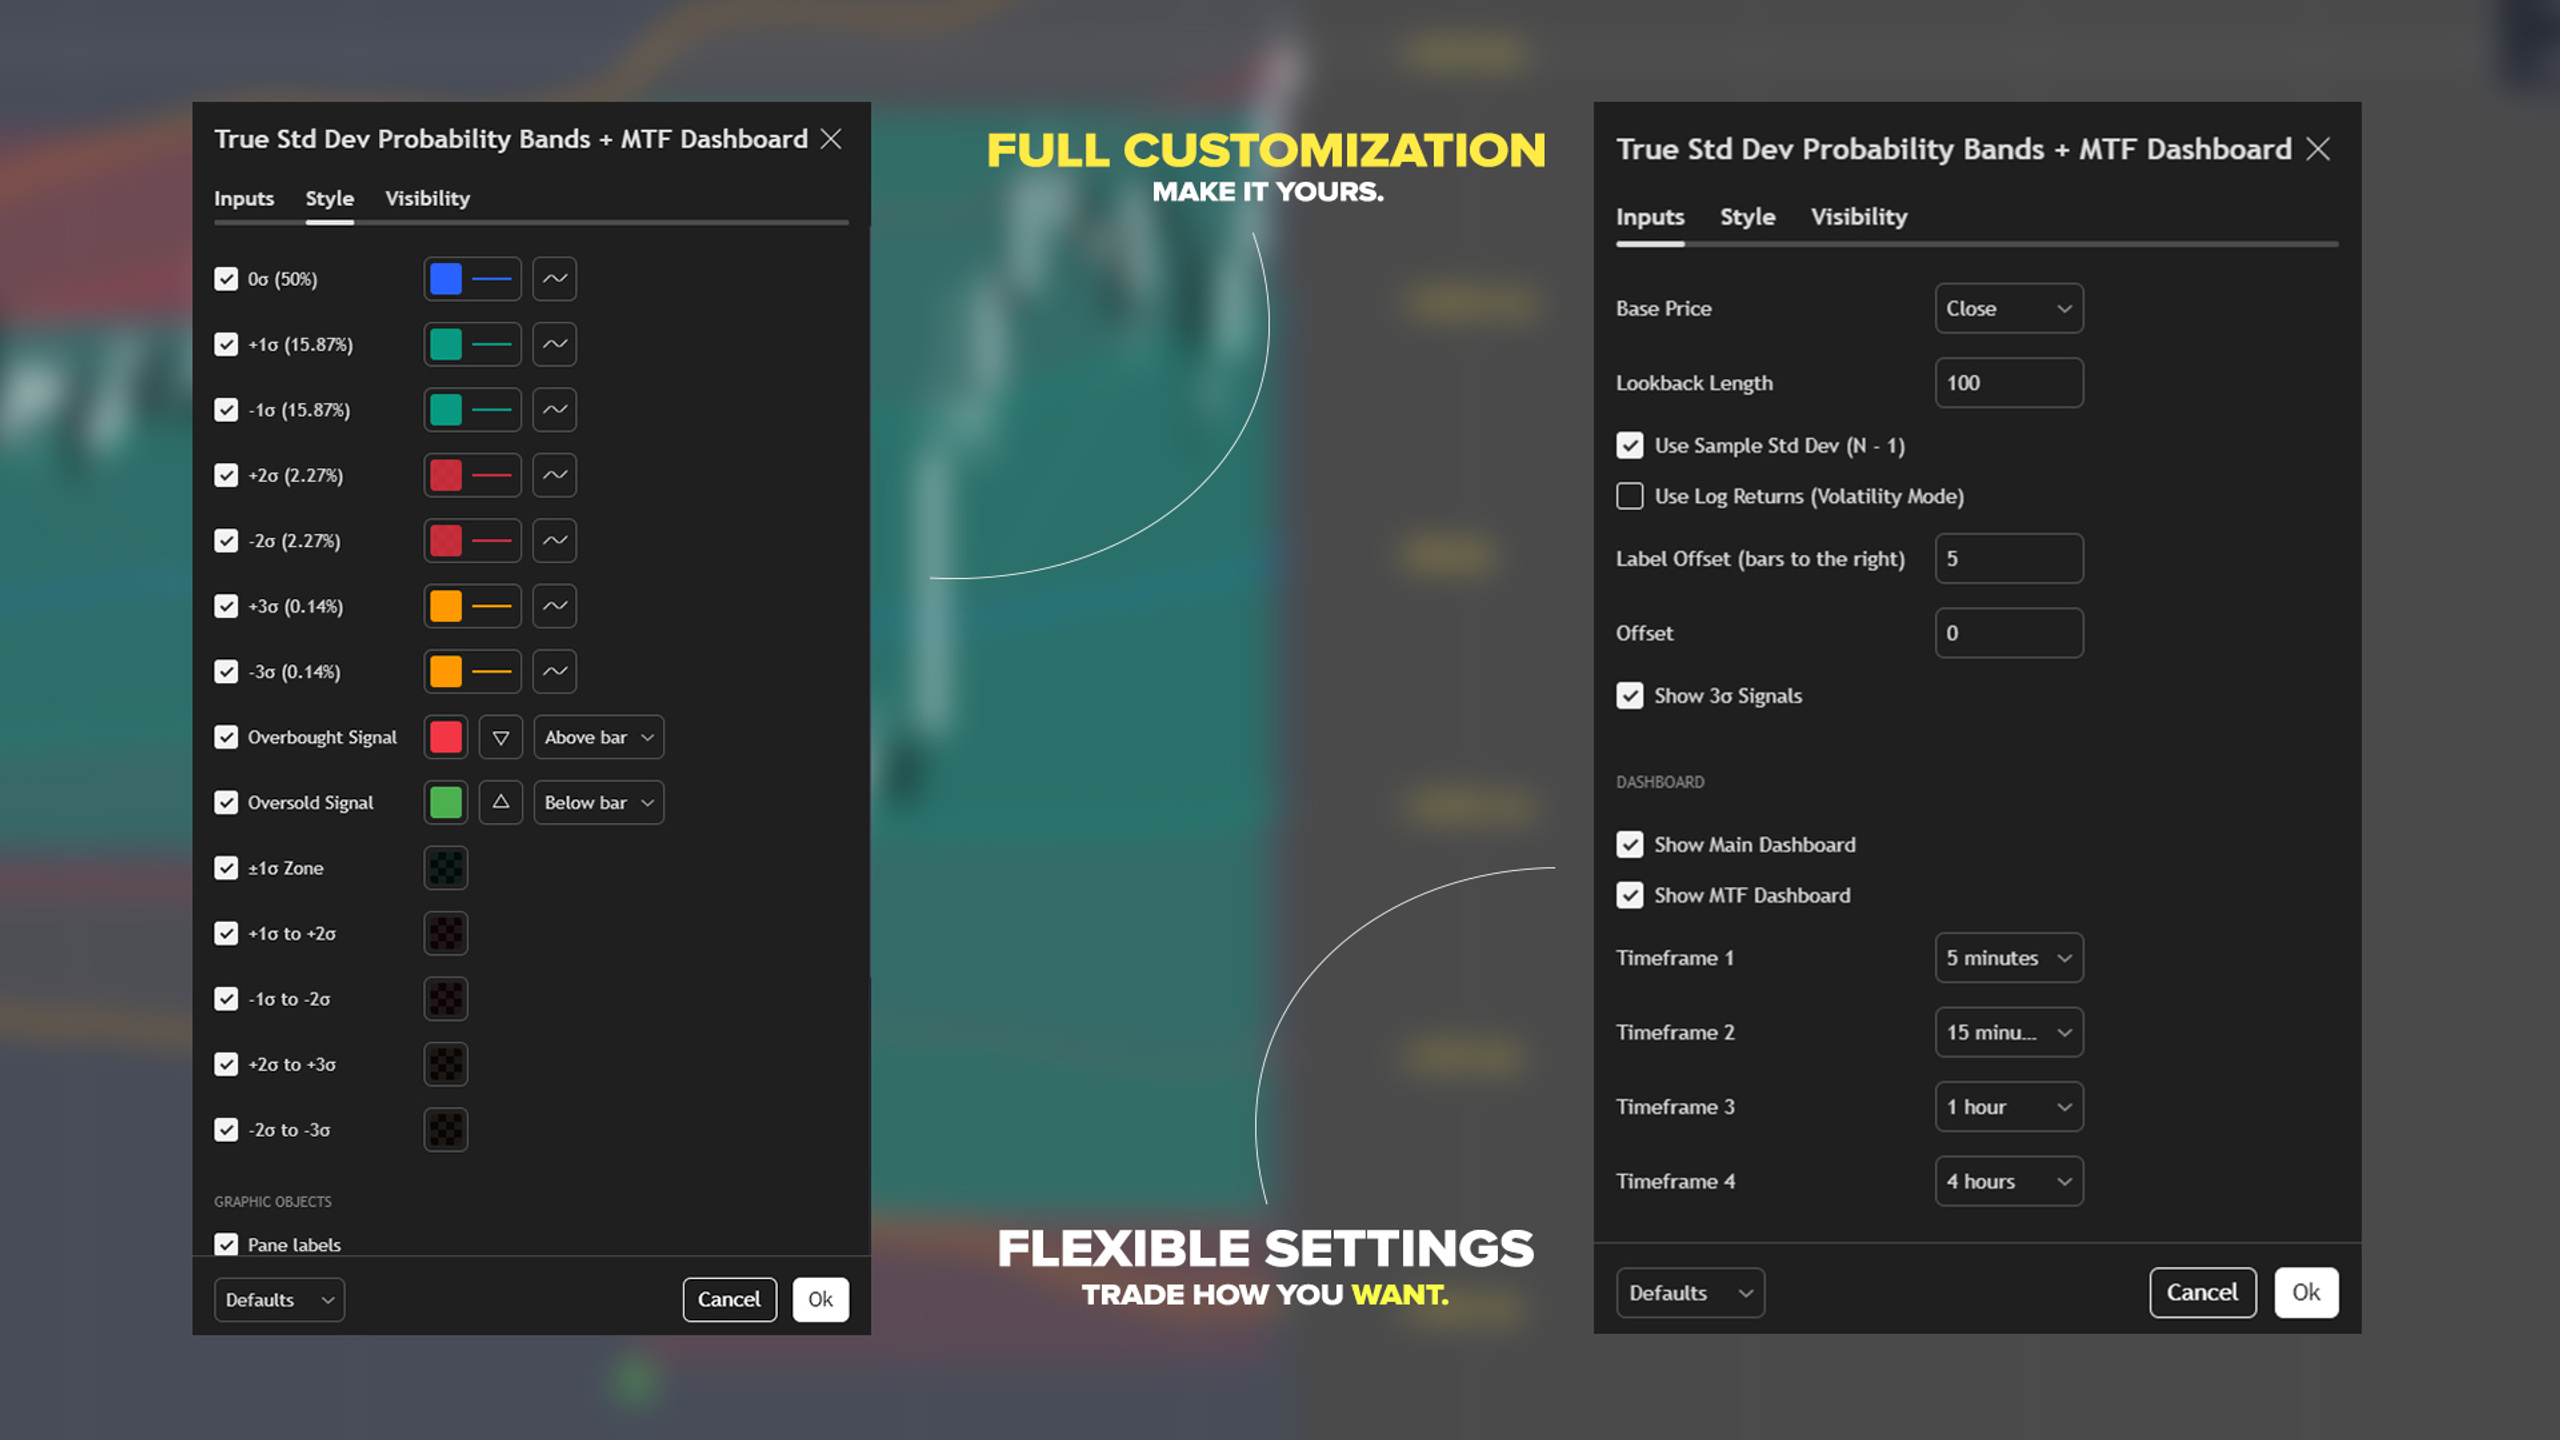
Ready to use within minutes of setup - add to your chart and just trade.
DISCLAIMER: Not every signal will be correct / completely accurate - the signal displays when price touches the outer bands of all standard deviation bands. For most accurate execution / entries, combine with confluence, such as key levels, session timing, support / resistance.
Customer reviews
5.02 ratings
Top reviews
- 2 years agoI like how they do daily streams and give some fire calls. Due to their intel, I have already learned so much and made 3 incredible plays and I just joined. I highly recommend this to anyone who is just starting out or even knows what they are doing. It is very beneficial to both. Don't sleep on thi...Written 6 days after purchase
- 1 year agoWritten 8 months after purchase