
Spread Tracker: NYA/IXIC
$24.99
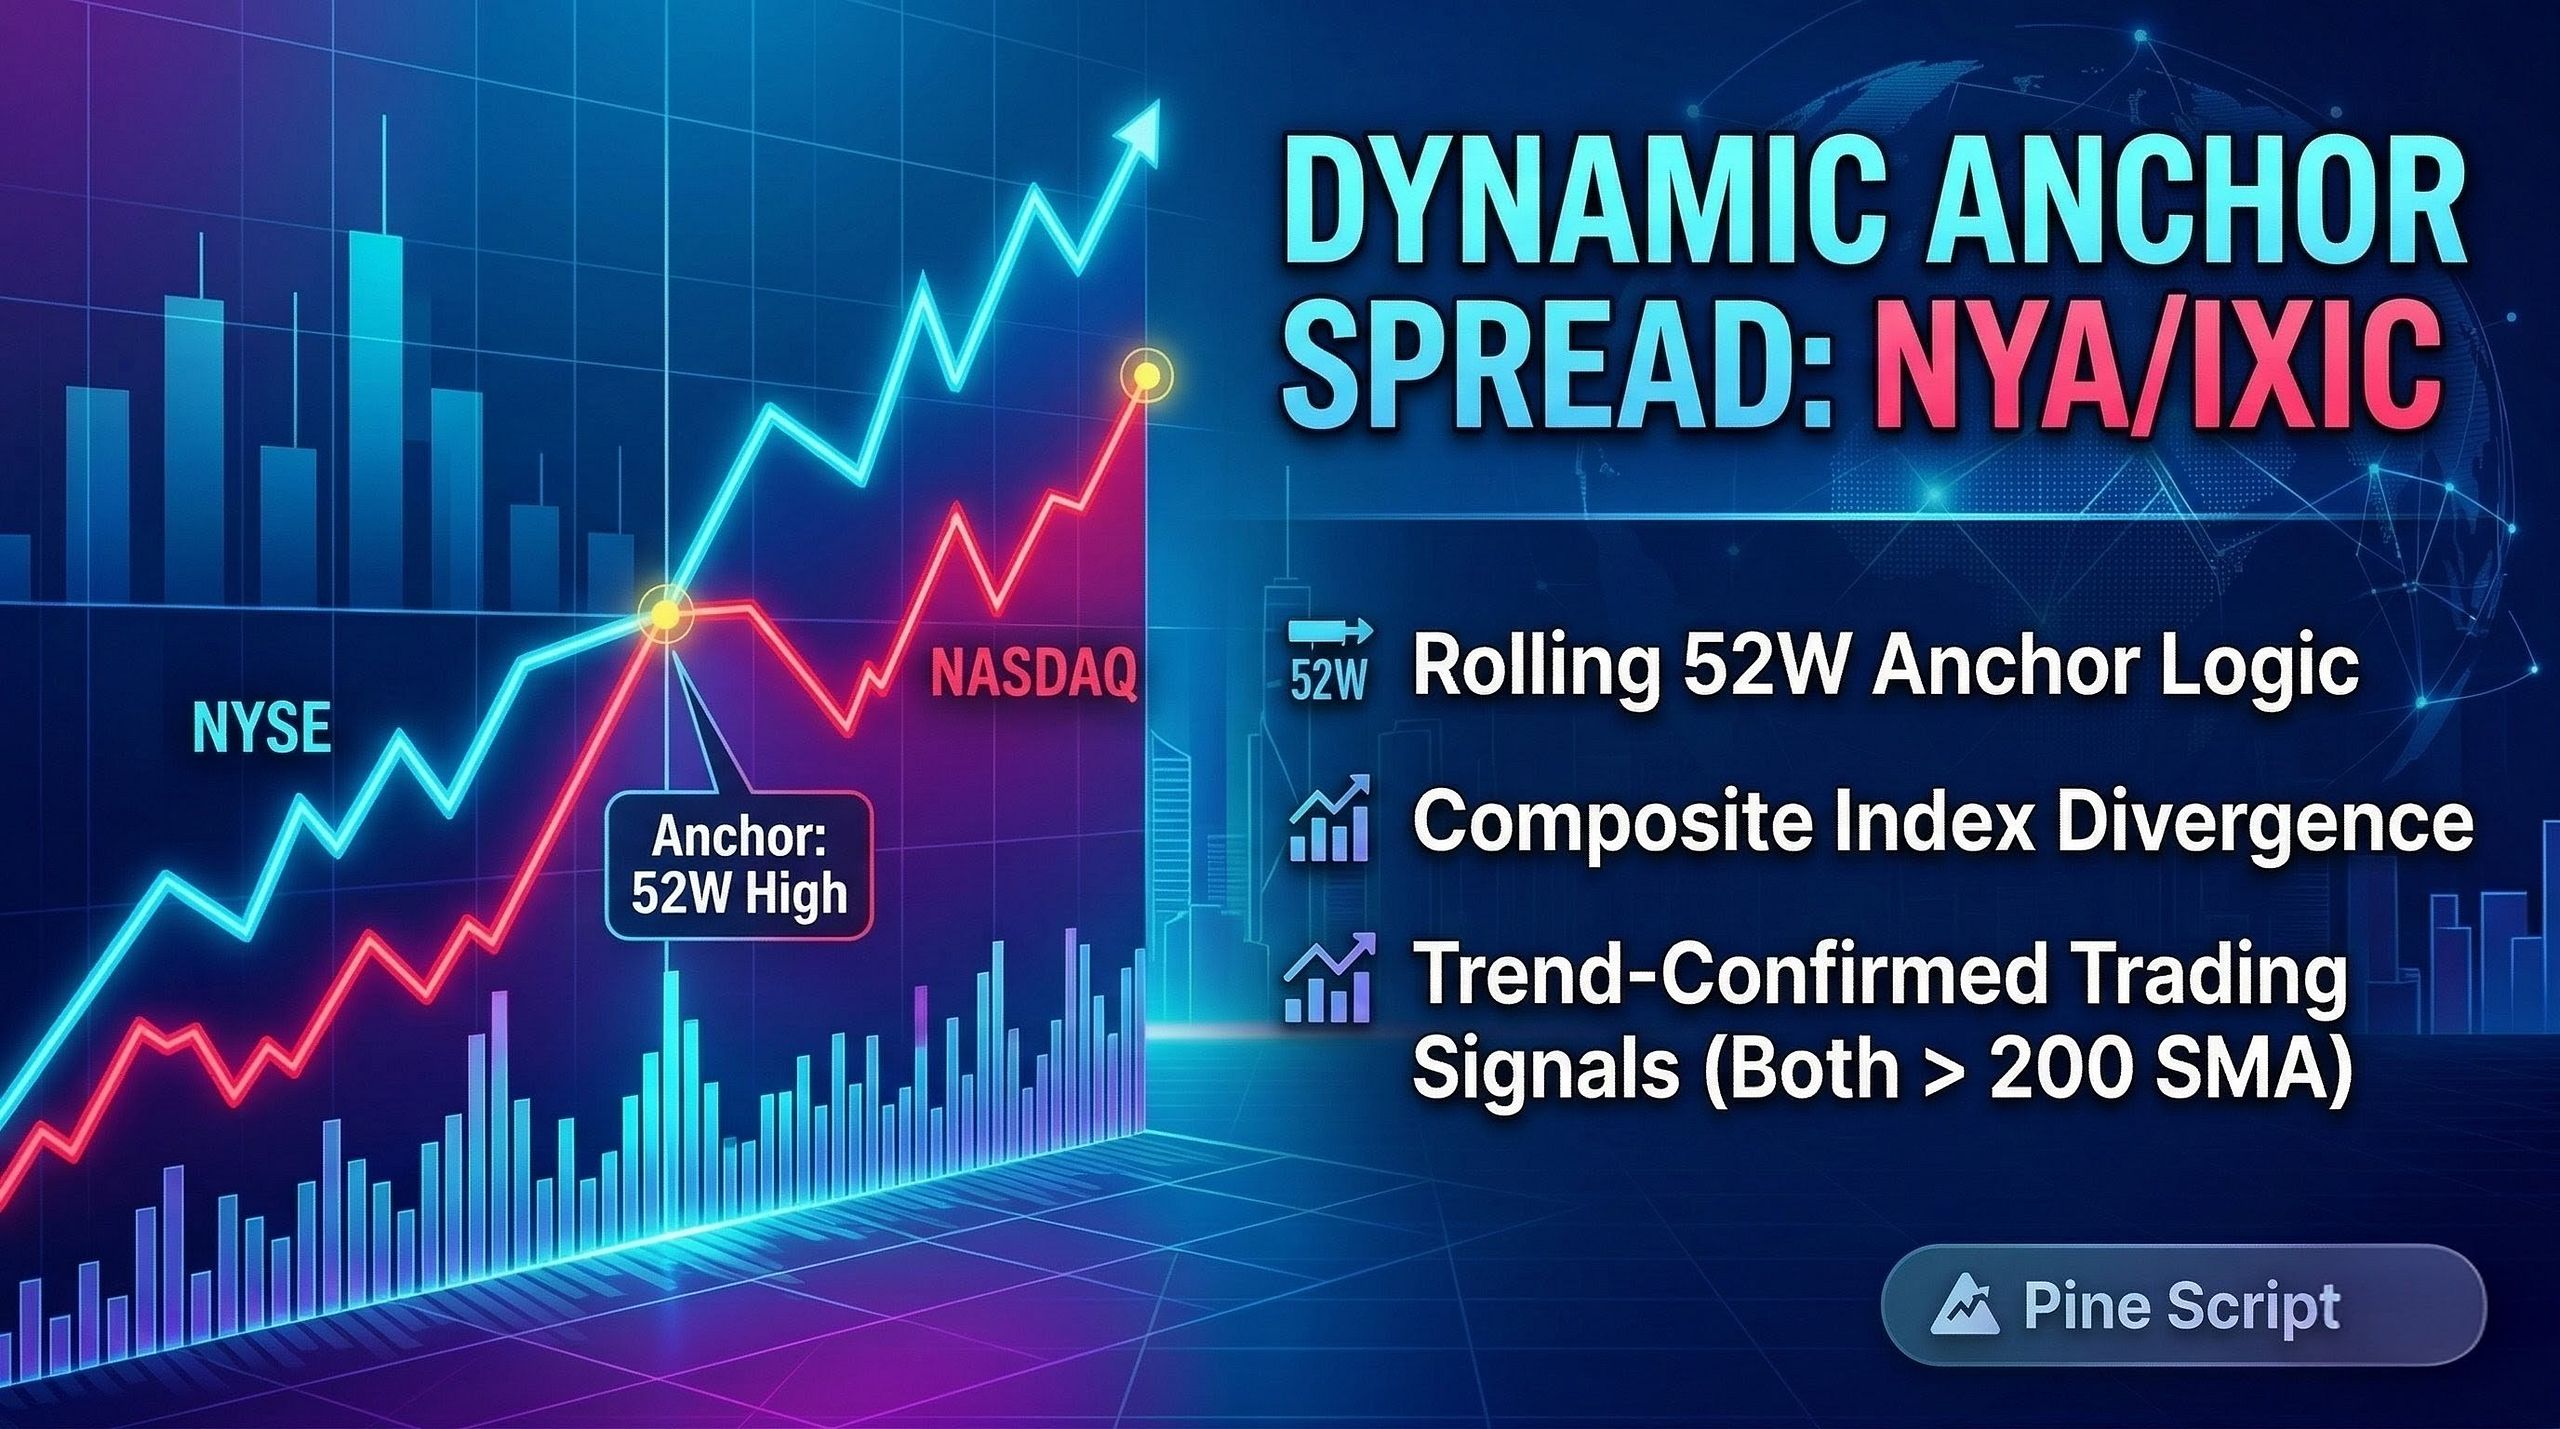
Master Market Structure: The Dynamic Anchor Spread Indicator for TradingView
Introducing Dynamic Anchor Spread, a TradingView tool developed in Pinescript v6. This is not another “repainting signal arrow.” It is a robust macro-regime tool designed for serious traders who seek to understand the structural relative performance driving major indices.
What Makes It Unique? The Rolling 52-Week Anchor Logic
Instead of using an arbitrary date (like an arbitrary year start) to measure performance, this script introduces a truly dynamic and objective “D-Day” logic.
- The Leader Sets the Mark: Every time the NASDAQ Composite (
IXIC, the default leader ticker) makes a new rolling 52-week high, the script dynamically sets a new “Anchor” point for performance calculation. This anchor point is objectively confirmed only at the daily close, preventing premature intra-day resets. - Relative Performance Since the Peak: The indicator then tracks the percentage performance of both the NYSE Composite (
NYA) and the NASDAQ Composite since that exact, objective anchor point. - The Total Spread Calculation: The script visualizes the total divergence in performance between the two indices. A high positive spread can indicate one market is being irrationally bid relative to the other following the NASDAQ peak, setting up rotational or mean-reversion opportunities.
Institutional-Grade Reliability & Advanced Filtering
Customer reviews
5.02 ratings
Top reviews
- 4 months agoEverything I need on my daily time frames all in one. It's perfect.Written 16 days after purchase
- 6 months agoThe perfect way to track the NYSE / NASDAQ comp spread. Great jobWritten 5 days after purchase