CandelaCharts Indicators

Empowering traders with cutting-edge indicators, toolkits, models, and statistics.
Location hidden
Created byProfile pictureCandelaCharts
Profile picture
CandelaChartsProfile picture@candelacharts·Jul 20

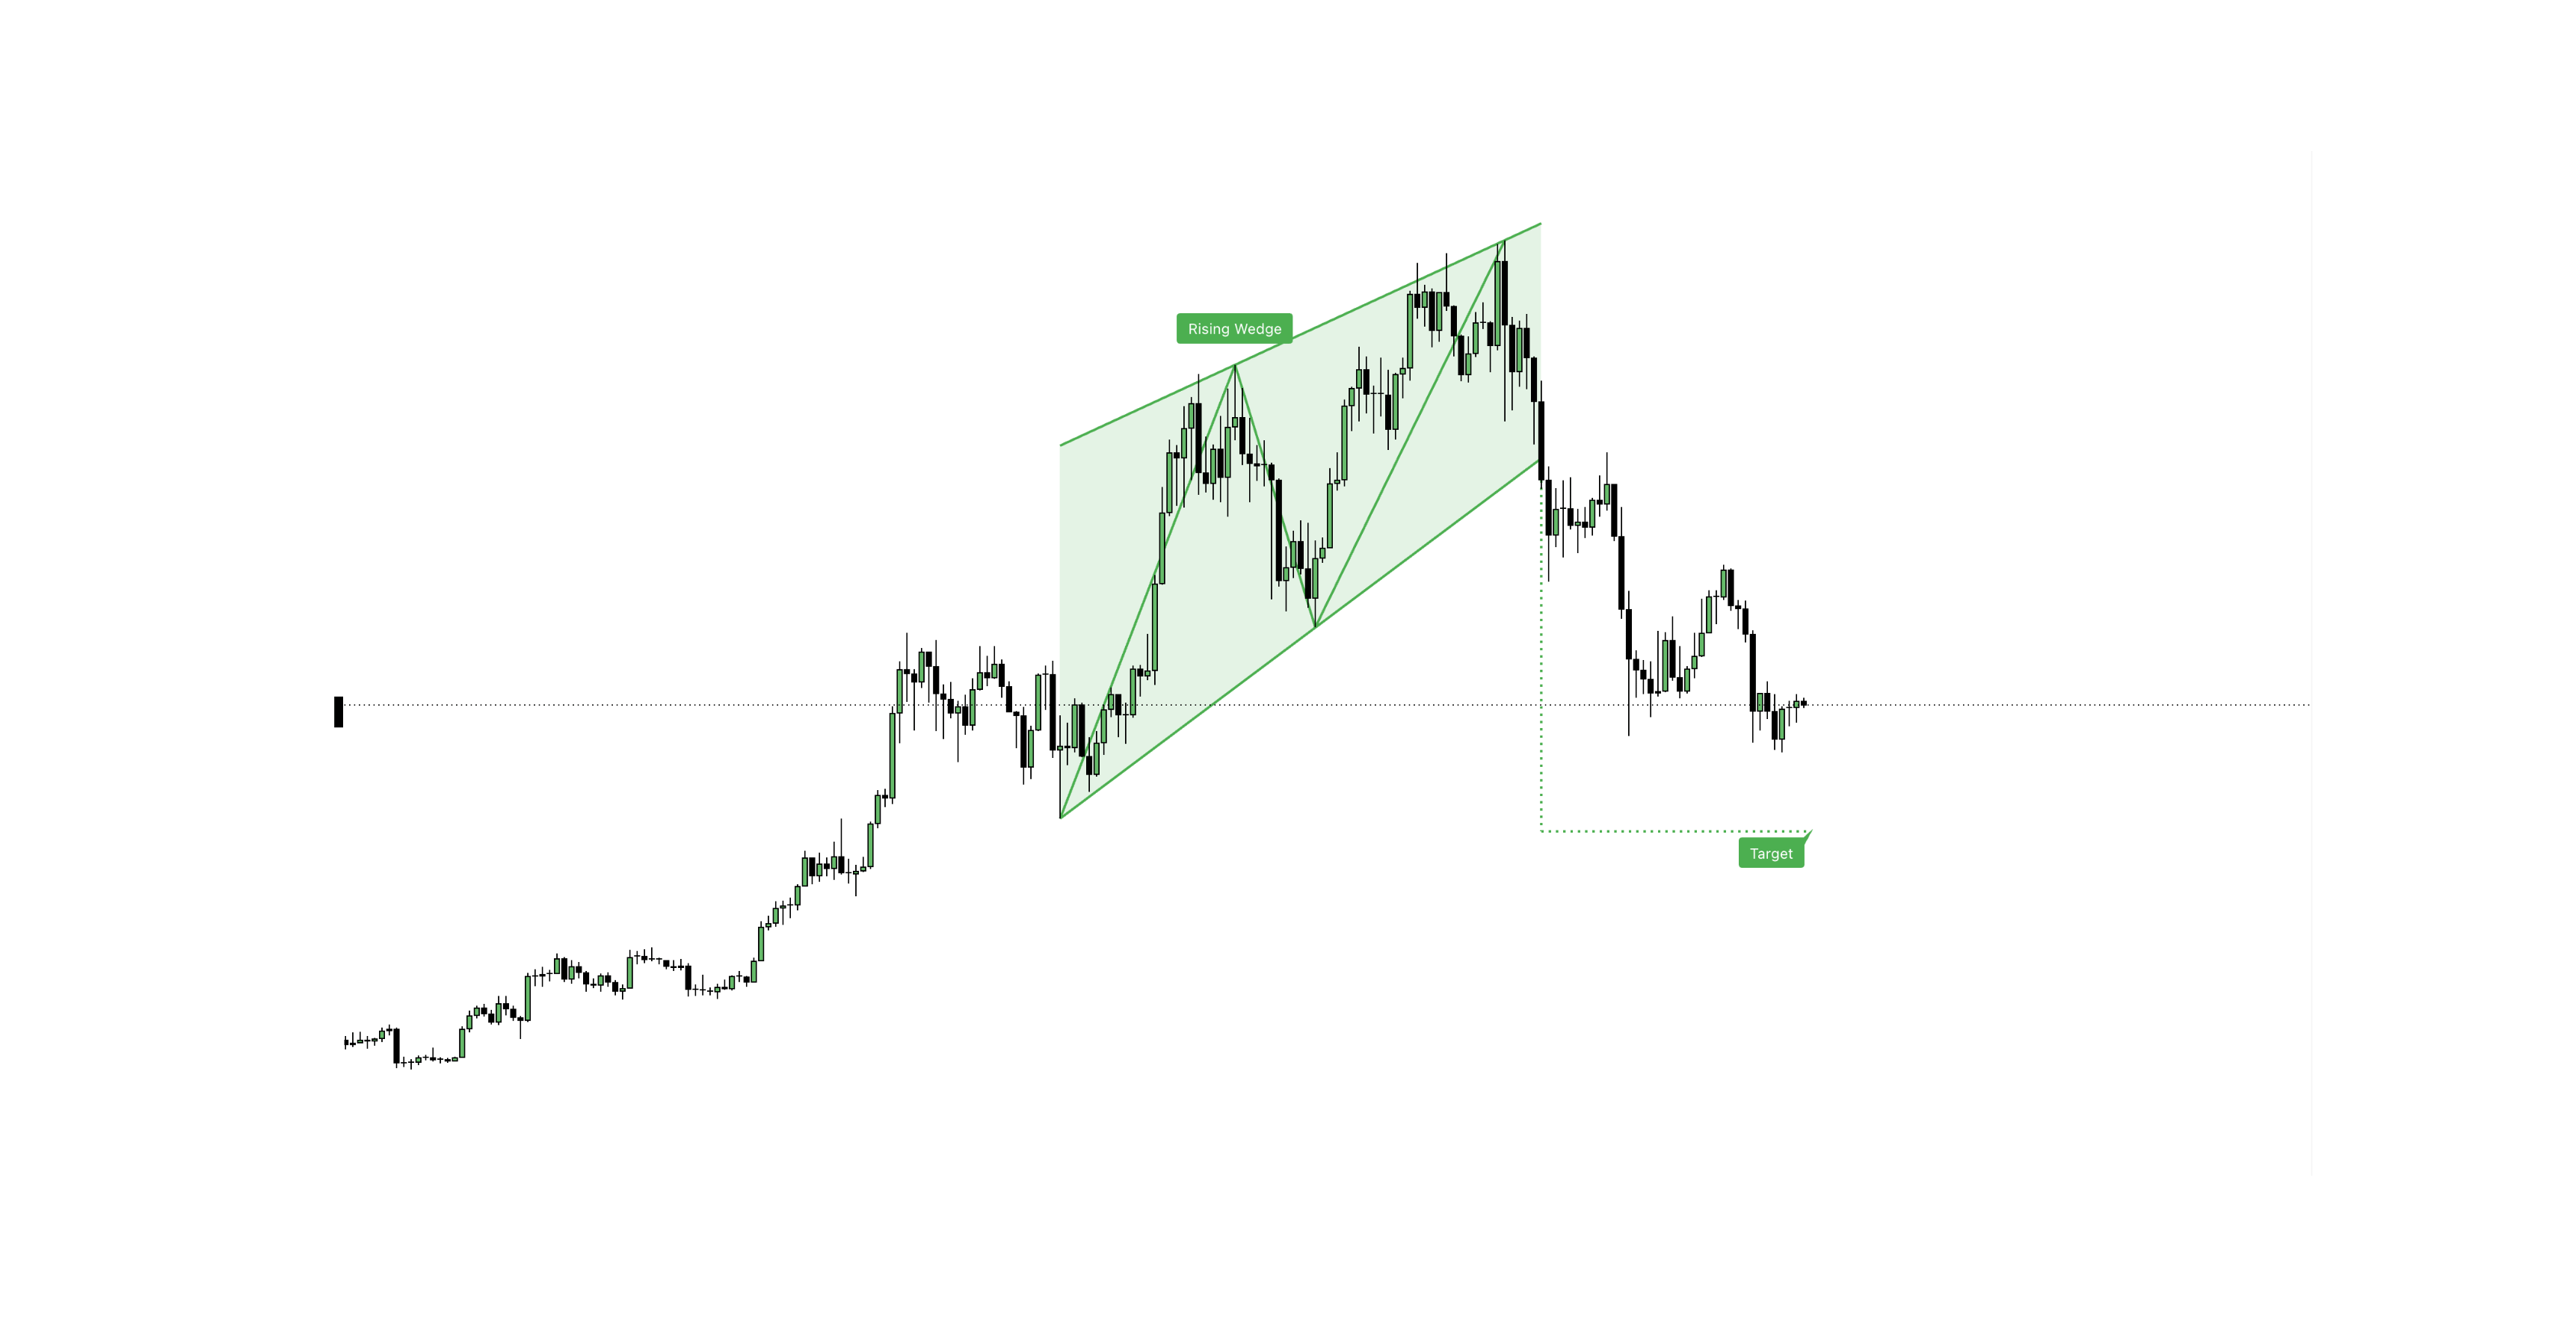
Chart patterns aren't random shapes — they're the footprint of supply and demand fighting for control. New breakdown covers classical, harmonic, Wyckoff & SMC/ICT patterns, plus the 6-step framework that turns pattern-spotting into a repeatable edge.

file_yxgsBZSJ74Skf
Profile picture
CandelaChartsProfile picture@candelacharts·Jun 27

We're growing!

CandelaCharts is expanding the team:
• Content Creator (blog) – 4 articles/mo
• Shorts Creator – 4 shorts/mo
• Long-Form Video Creator – 1-2 videos/mo

Get free Pro tools + team role & badge! Join the community for more details:

Profile picture
CandelaChartsProfile picture@candelacharts·Jun 23

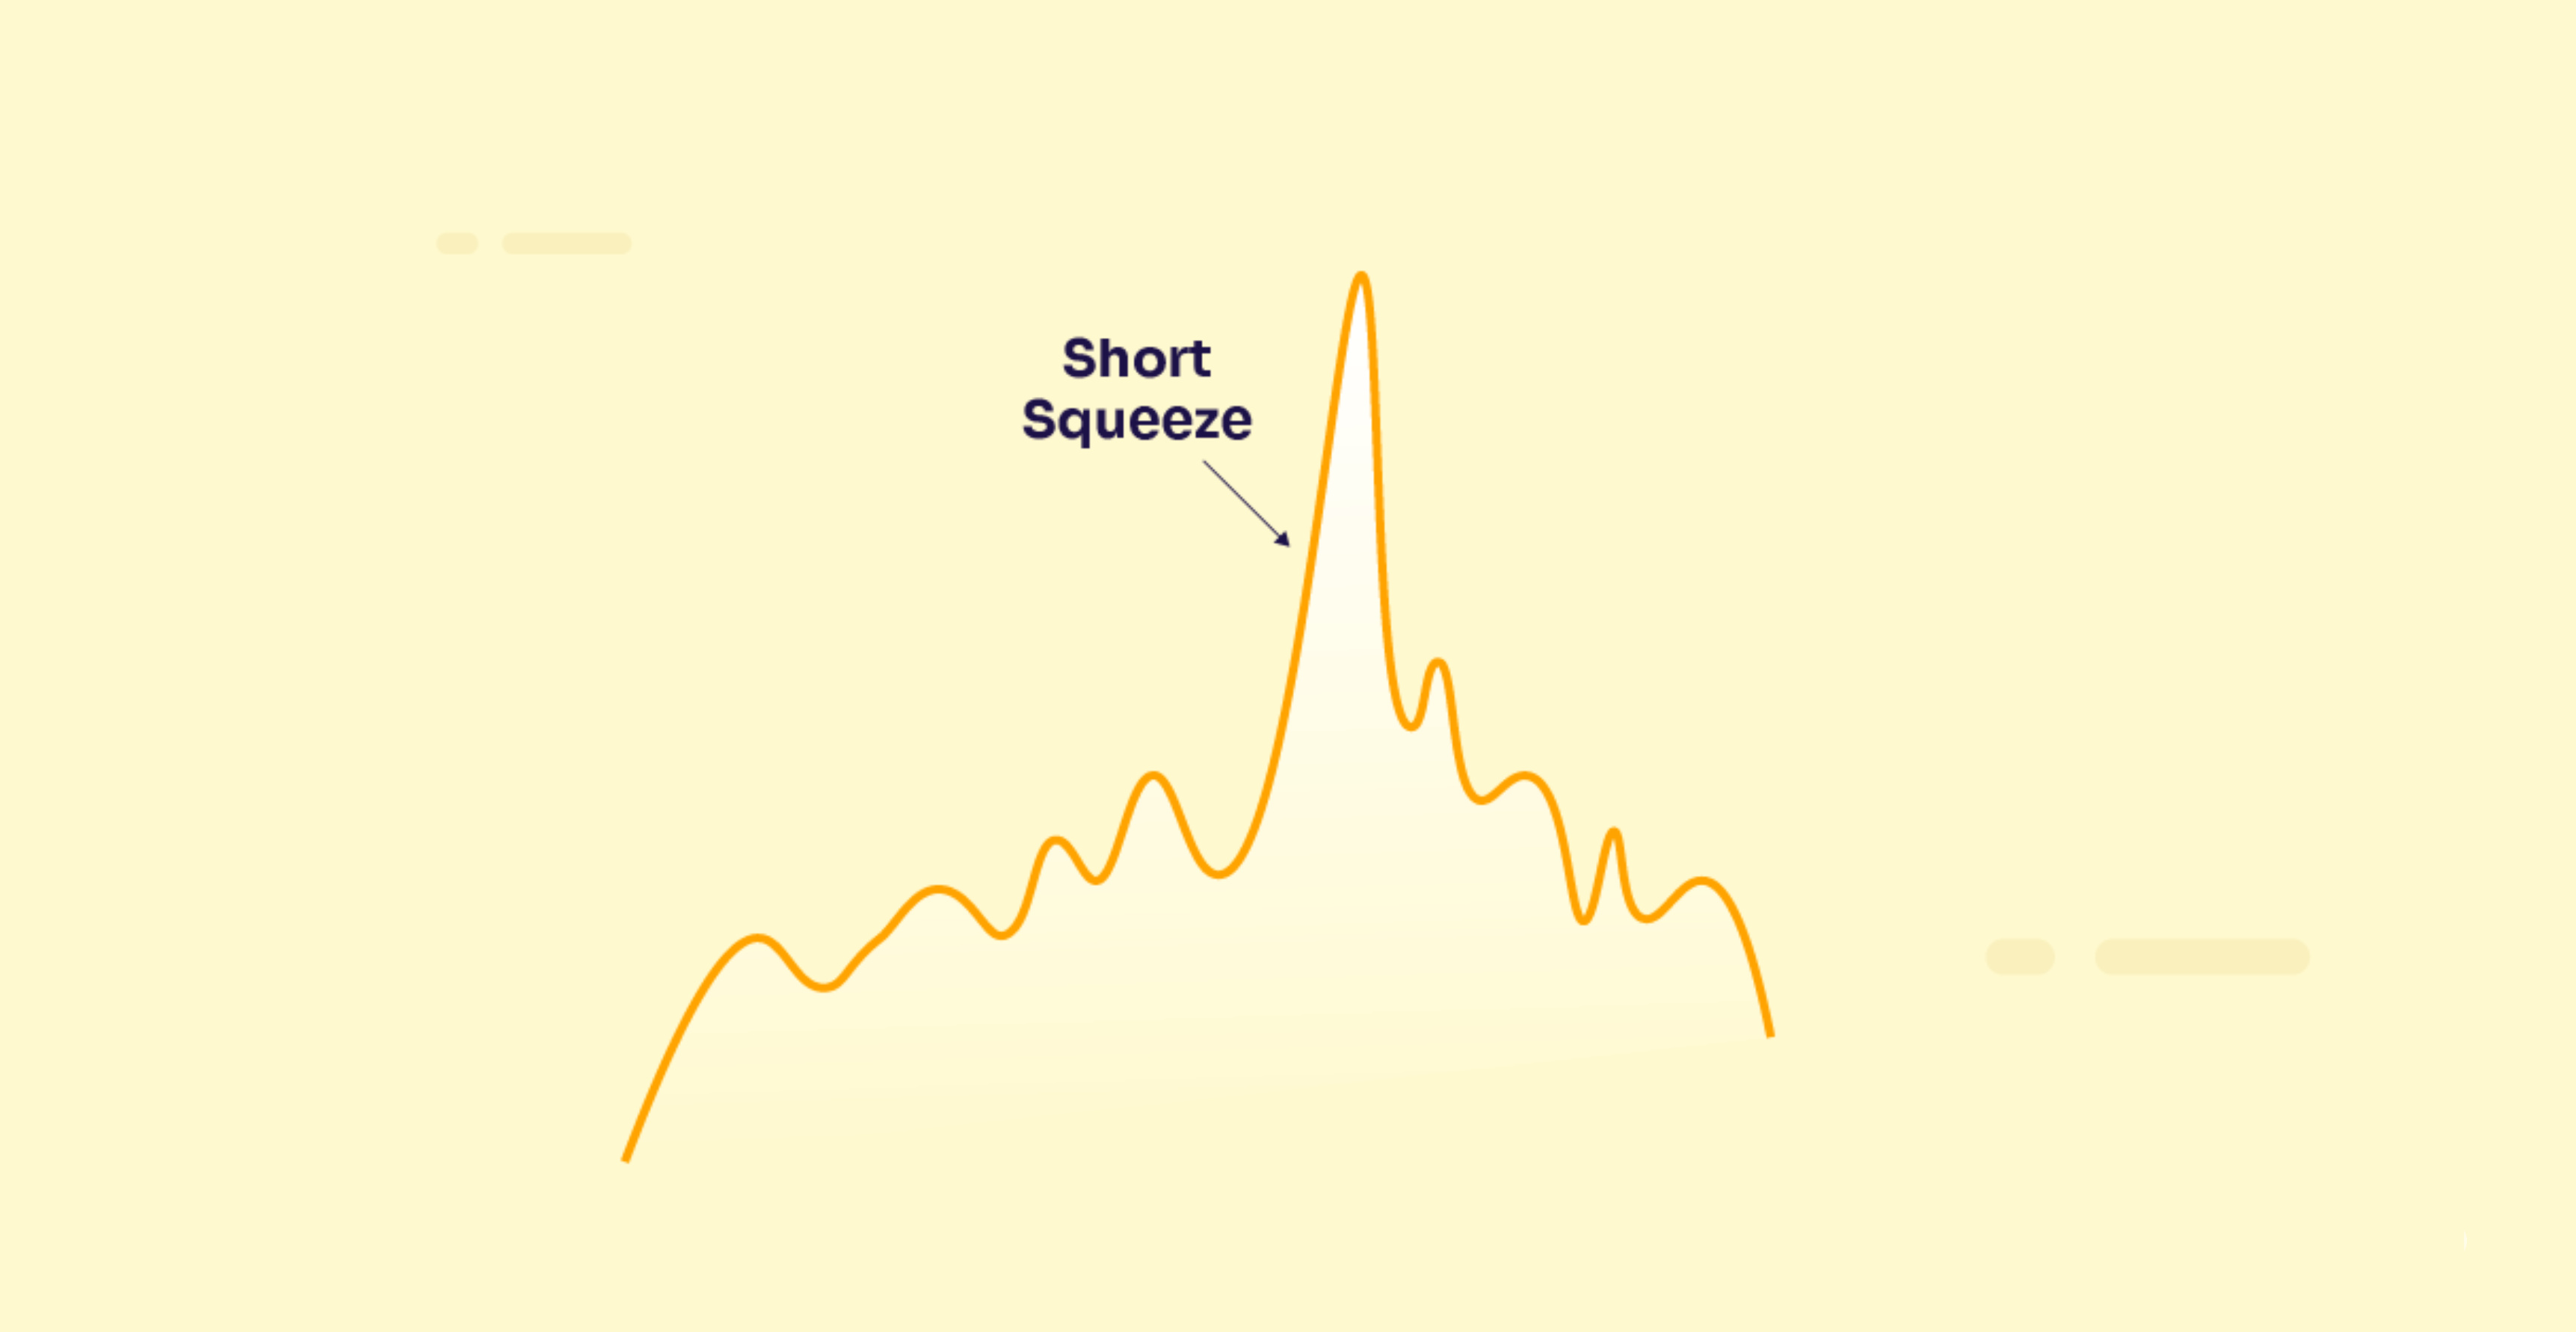
The Anatomy of a Short Squeeze: Separating Myth from Mechanical Reality

Read full article here:

file_EOelJNIoQyrux
Profile picture
CandelaChartsProfile picture@candelacharts·Jun 23

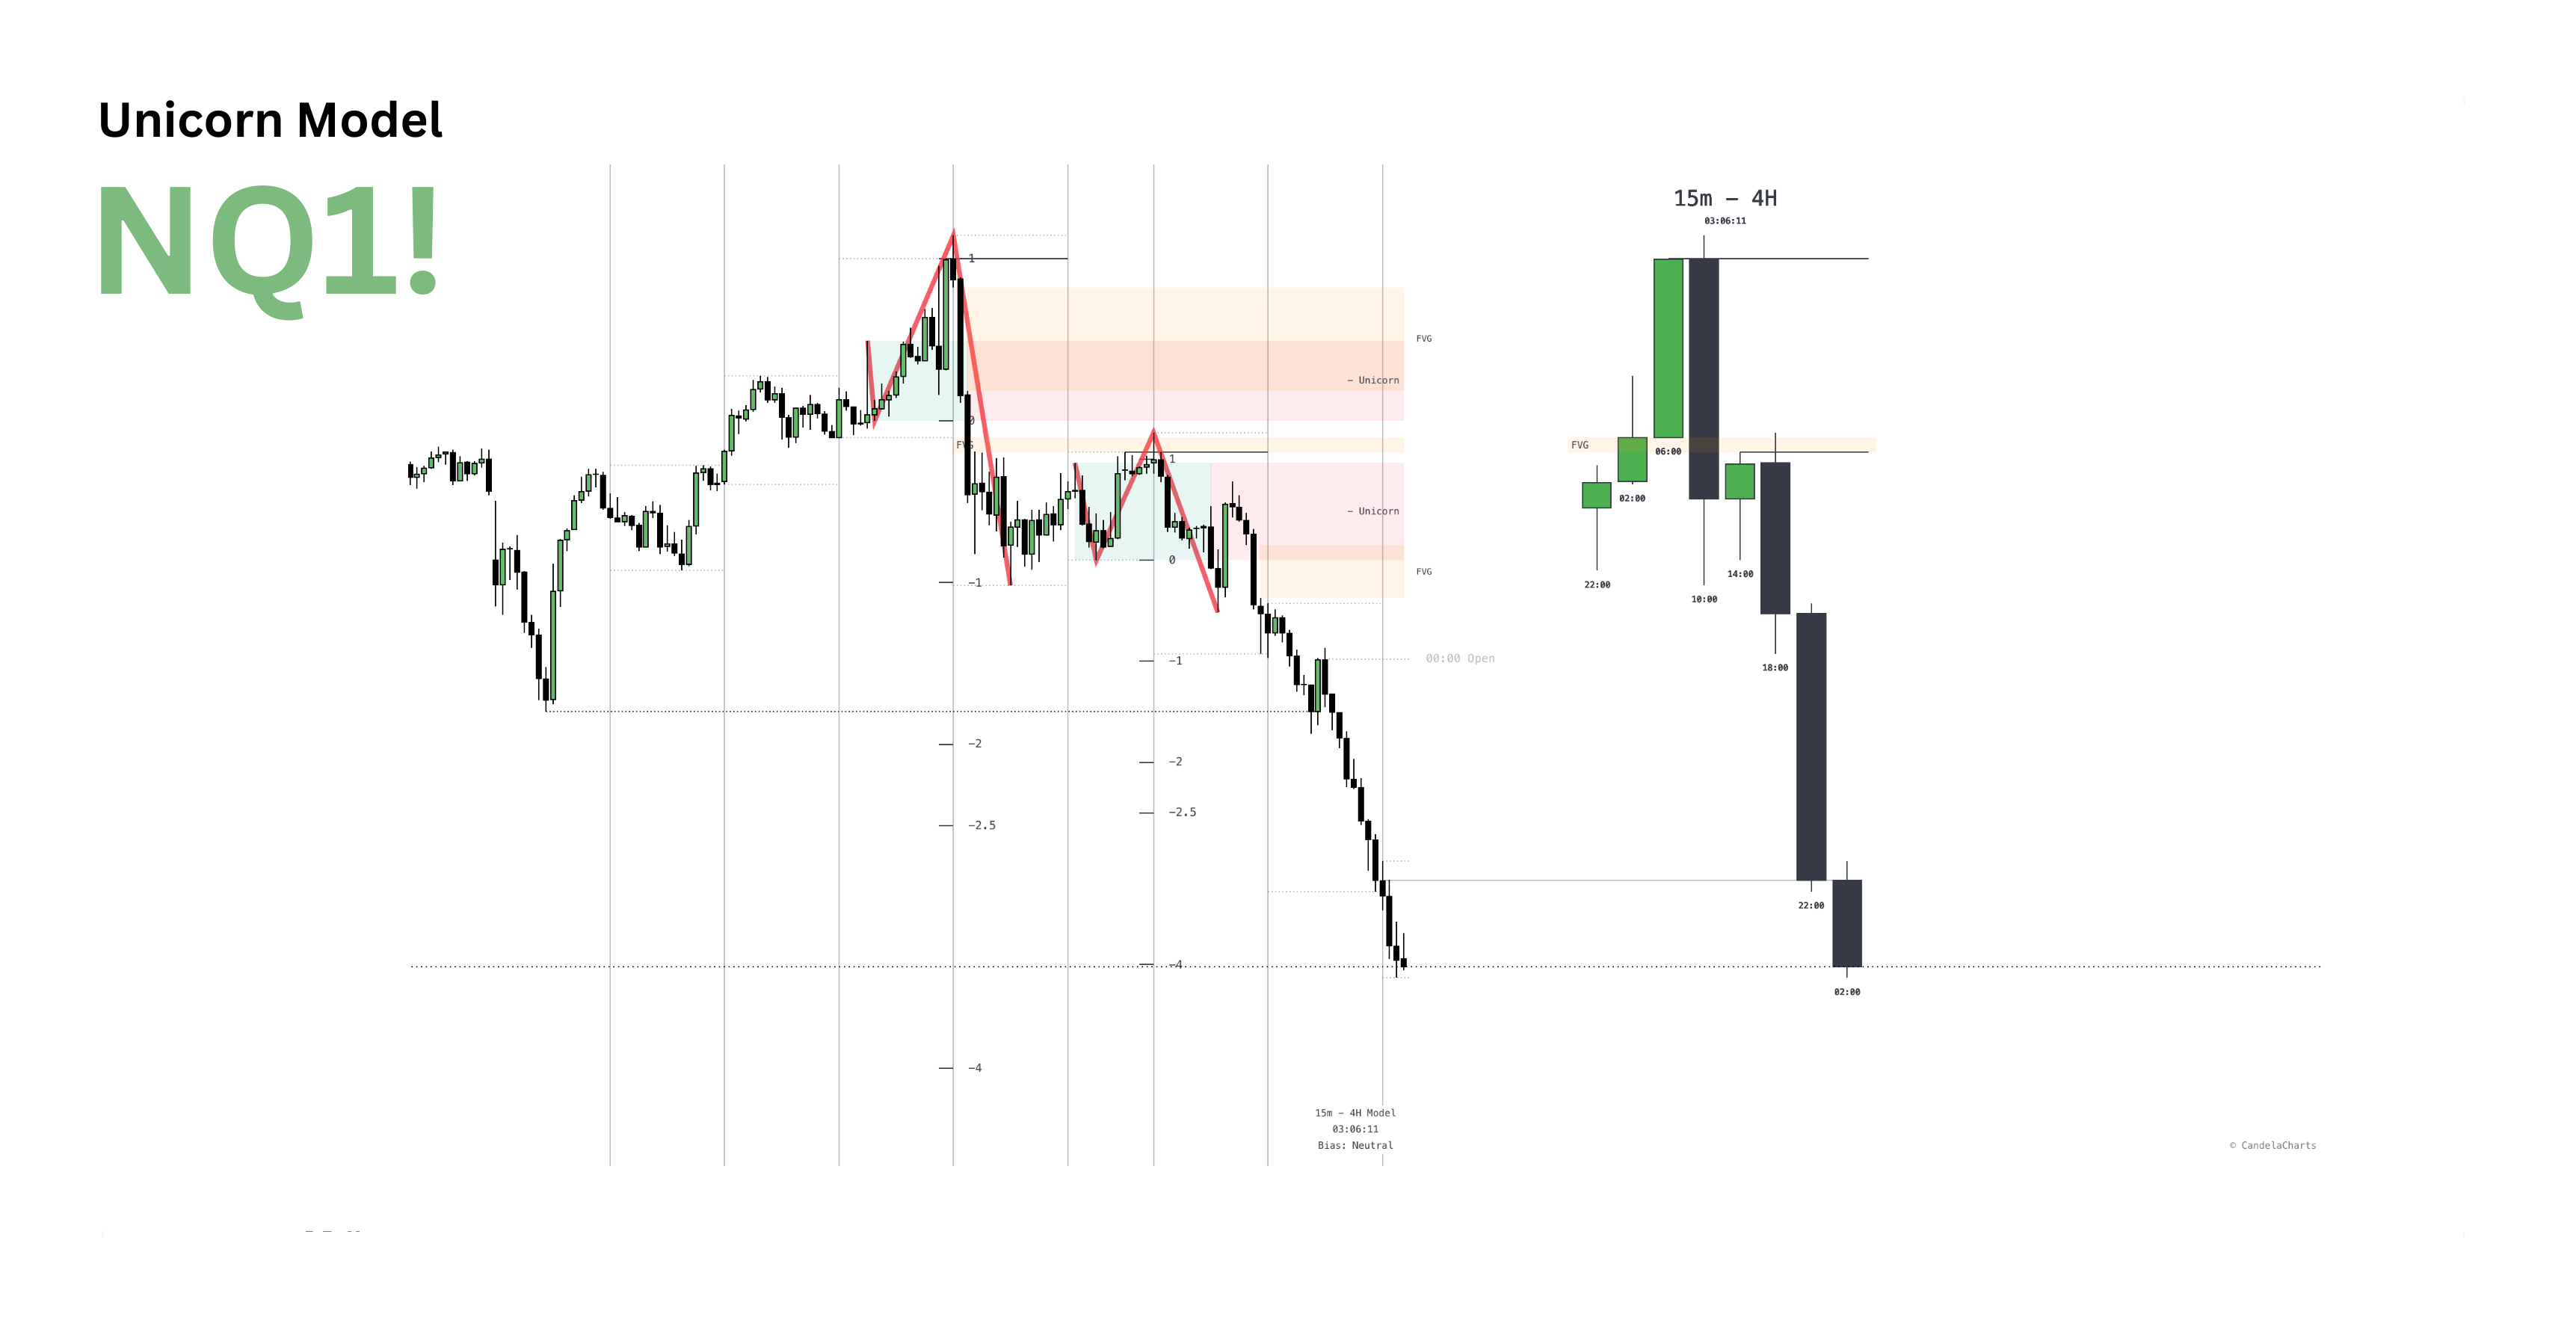
CandelaCharts's Unicorn Model is one of the best-coded algorithms for this type of strategy. Does it fail? Yes, at times—but performance largely depends on market conditions. So far, its statistical profitability has remained above 65% for intraday trading.

file_jK7TbPTZgG4mk
Profile picture
CandelaChartsProfile picture@candelacharts·Jun 22

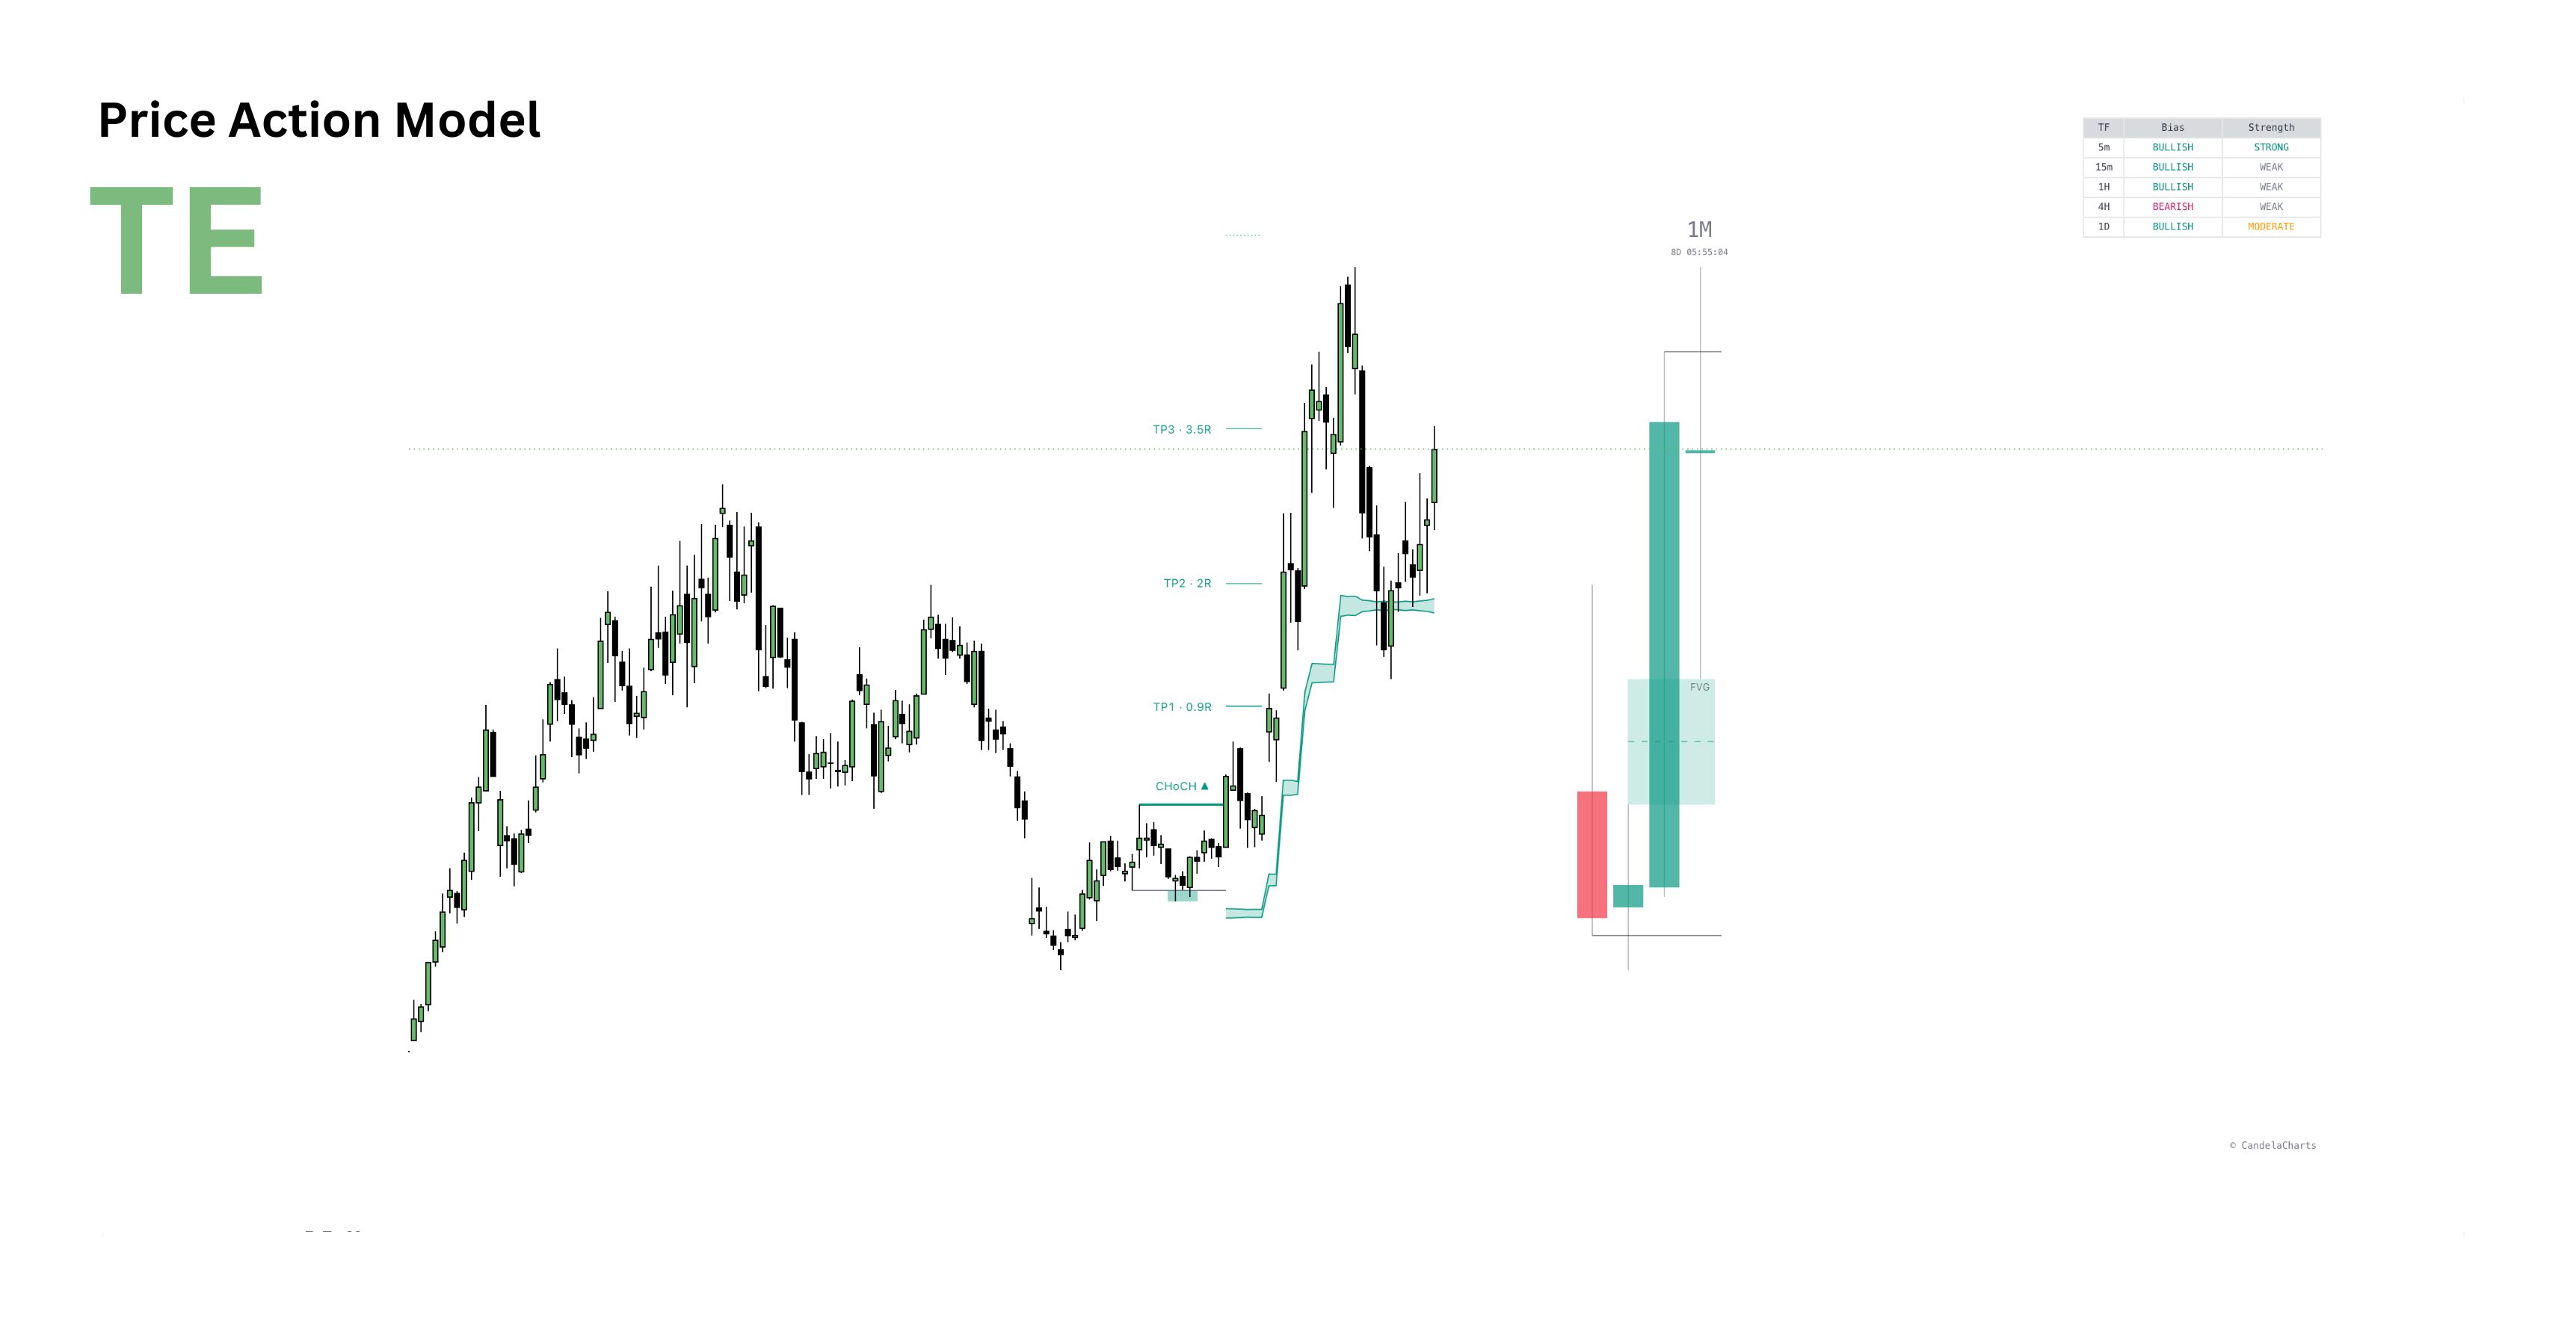
#TE, Price Action Model

With an entry at $4, I’ve already secured profits by selling 20% of my position.

Still holding strong, because I believe we’ll see prices move above the previous all-time high within the next 3–4 months.

file_S5eamk1qzKiWl