Woof Streets, LLC

4.8 (83 Reviews)
Unleash your gains with Woof Streets — a fast-growing Discord options trading community where traders come together to master live SPY setup...
Location hidden
Created byProfile pictureDawg
696 joined
Profile picture
Trader JoeProfile picture@trader-joe·14h

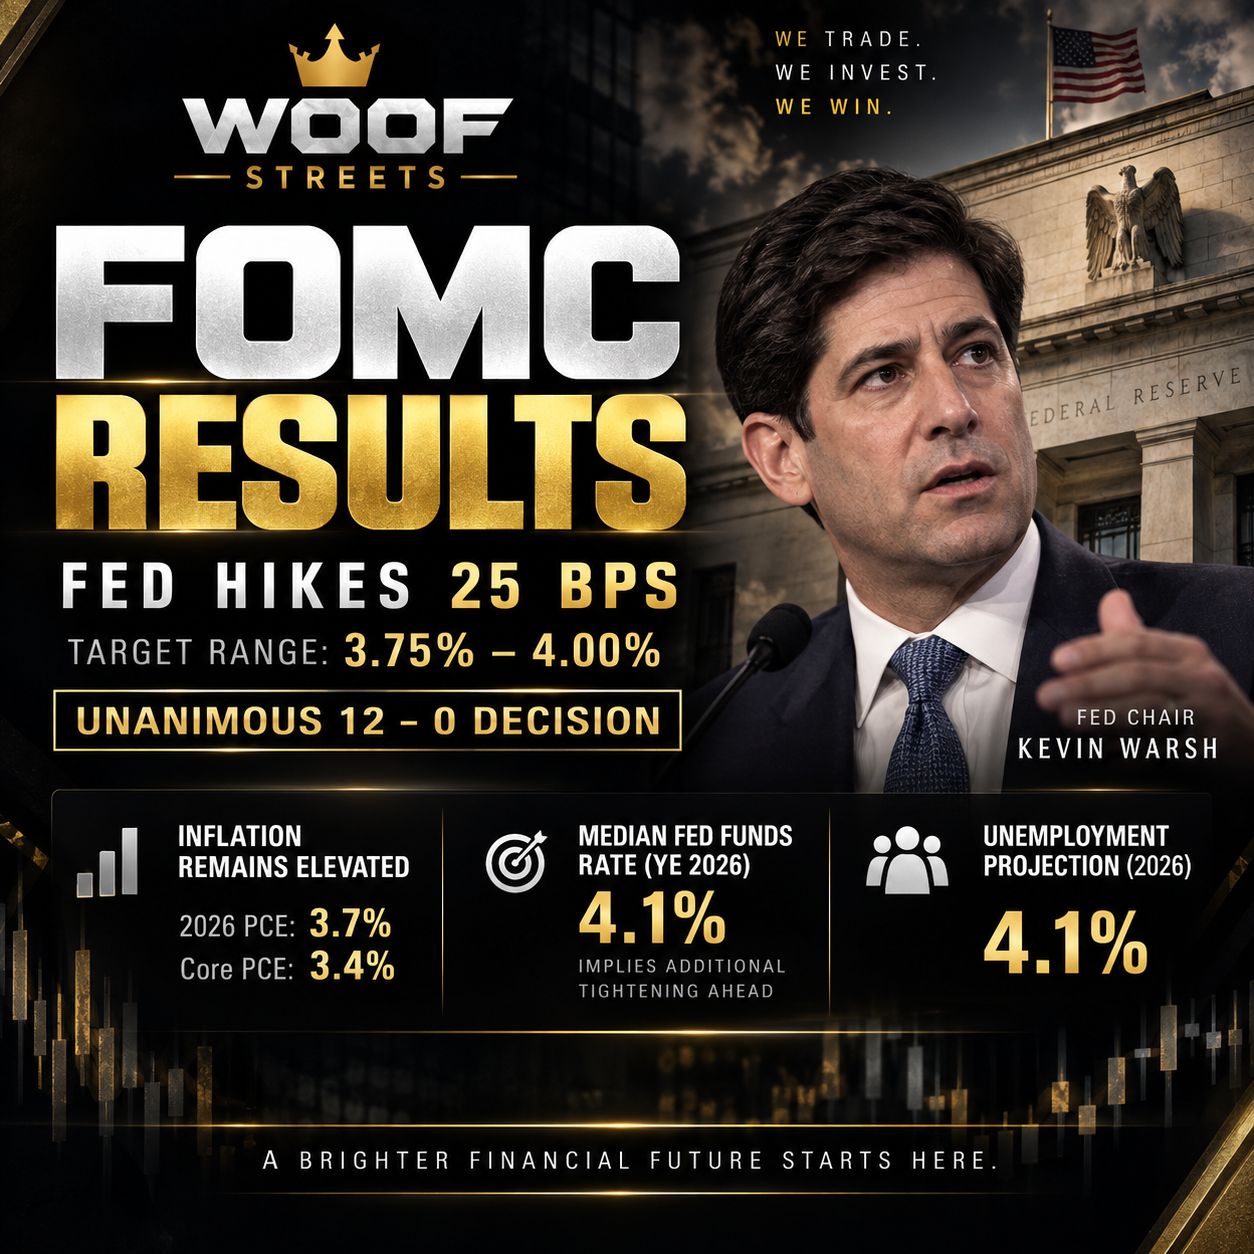
FOMC RESULTS: THE FED IS HIKING AGAIN


The September FOMC is officially in the books, and this was a pretty clear message from the Federal Reserve:


Inflation is still too high, the economy is still holding up, and the Fed is willing to keep rates higher to get inflation under control.


The Fed voted unanimously, 12–0, to raise rates by 25 basis points, bringing the federal funds target range to 3.75%–4.00%. This is the first Fed rate hike since 2023. ([Federal Reserve][1])


WHY DID THE FED RAISE RATES?


Simple: inflation.


Fed Chair Kevin Warsh said inflation remains too high and that the summer data hasn't shown enough improvement in the underlying trend. The Fed still wants inflation back near its 2% target. ([Reuters][2])


The Fed's updated projections show:


2026 PCE inflation: 3.7%

2026 Core PCE: 3.4%


Both were revised slightly higher from the June projections. ([Federal Reserve][3])


So despite all the talk about eventually lowering rates, the Fed is currently moving in the opposite direction.


ANOTHER HIKE COULD BE COMING


This is probably the biggest takeaway from today's meeting.


The median Fed projection for the federal funds rate at the end of 2026 jumped from 3.8% in June to 4.1% now. Twelve policymakers projected a year-end midpoint of 4.125%. ([Federal Reserve][3])


In plain English:


The Fed's projections are consistent with another 25-basis-point hike this year.


That's not a guarantee. The Fed will still react to incoming inflation, employment and economic data.


But today's message was definitely not dovish.


THE ECONOMY IS MAKING THE FED'S JOB HARDER


Here's the interesting part.


The Fed isn't raising rates because the economy is falling apart.


It's almost the opposite.


The Fed says economic activity continues to expand at a solid pace, domestic spending remains resilient, productivity growth is strong and capital investment is robust. ([Federal Reserve][1])


The unemployment projection for 2026 was actually lowered from 4.3% to 4.1%. ([Federal Reserve][3])


Warsh also pointed to massive capital spending, including investment from large technology companies and AI/data-center infrastructure, as one factor increasing demand for capital and helping push longer-term borrowing costs higher. ([Reuters][4])


That's important.


Strong economy + sticky inflation = the Fed has room to stay aggressive.


WHAT DOES THIS MEAN FOR STOCKS?


Higher rates generally create a tougher environment for equities.


Companies pay more to borrow. Consumers pay more to finance things. Bonds and Treasuries become more competitive with stocks. And higher yields can put pressure on expensive growth companies whose valuations depend heavily on future earnings.


That's why the market cared about more than today's 25-basis-point hike.


The bigger question is:


How long will rates stay this high, and how many more hikes are coming?


Stocks pulled back following the announcement as investors digested the possibility of additional tightening. ([Reuters][5])


That doesn't mean stocks automatically crash because the Fed raised rates.


The other side of this equation is that the economy remains surprisingly strong.


WHAT SHOULD WE WATCH NOW?


Forget trying to predict every word that comes out of the Fed.


Watch the data.


Inflation: If inflation starts falling convincingly, pressure on the Fed eases.


Jobs: A significant deterioration in employment could change the Fed's calculation.


Treasury yields: Rising yields can continue creating pressure on high-multiple growth stocks.


Economic growth: As long as the economy remains resilient, the Fed has more room to fight inflation.


Every CPI, PCE and employment report just became even more important.


BOTTOM LINE


This was a hawkish FOMC.


The Fed raised rates to 3.75%–4.00%, inflation remains well above its 2% goal, and policymakers' median projections moved toward another hike this year. ([Federal Reserve][1])


But don't confuse tighter monetary policy with a collapsing economy.


Right now we're dealing with a strange combination:


**Strong economy.

Sticky inflation.

Higher rates.

More volatility.**


For traders, that means opportunities, but also more reason to respect risk.


For long-term investors, one Fed meeting shouldn't suddenly change the thesis on a quality company.


Don't just trade the headline. Understand why the Fed is doing it.


[1]: "Federal Reserve Board - Federal Reserve issues FOMC statement"

[2]: "Warsh says Fed focus to stay on inflation, underlying trends have not meaningfully improved"

[3]: "The Fed - September 16, 2026: FOMC Projections materials, accessible version"

[4]: "Fed's Warsh lays out forces driving up bond yields"

[5]: "VIEW Stocks pull back after Fed raises rates, points to another hike this year"
file_CqS3sJK8QArha
Profile picture
Trader JoeProfile picture@trader-joe·Sep 8

Only few spots left for this month.

file_7HlLbyrKMcVdc
Profile picture
Trader JoeProfile picture@trader-joe·Sep 3

$FLNC: From the Moon Back to Earth

$FLNC has been on one hell of a ride.

Fluence Energy went from roughly $3 to above $30, becoming one of the hottest names in the energy storage trade. Now it has fallen all the way back toward $10.

So what changed?

The short answer is that the long-term story remains interesting, but execution failed to keep up with the hype.


Why FLNC Mooned

Fluence sits directly in the middle of several major investment themes.

The company builds large-scale battery energy storage systems. These aren't little batteries. We are talking about massive systems designed to store electricity for utilities, renewable projects, power grids and increasingly data centers.

That became a very attractive story for investors.

AI made it even hotter.

The AI boom isn't just about Nvidia chips. Those chips need data centers, and those data centers need enormous amounts of electricity. Power generation, grid infrastructure and energy storage have increasingly become part of the AI infrastructure trade.

Fluence started landing significant data-center and hyperscaler-related business, while its overall backlog grew to record levels.


Suddenly the narrative became:

AI + power demand + grid modernization + battery storage.

That's a powerful combination.

The market ran with it.


Then Reality Showed Up

The problem wasn't necessarily a lack of demand.

The problem was execution and profitability.

Fluence ran into manufacturing and project delays. Hundreds of millions of dollars of expected project deliveries were pushed into the following fiscal year.

Margins also took a serious hit.

Then management cut its full-year revenue outlook and dramatically reduced its adjusted EBITDA expectations.

That's when the market's attitude changed.

At $30+, investors were pricing FLNC like a company about to execute beautifully on a massive growth opportunity.

Instead, they got delays, weak margins and reduced guidance.

The stock got punished accordingly.

This is an important investing lesson:


A great industry doesn't automatically equal a great stock.

A company still has to execute.


Why I'm Still Watching It

Here's what makes FLNC interesting around these levels.

The demand story didn't simply disappear because the stock crashed.

Fluence still has a multibillion-dollar backlog. Energy storage continues to expand globally. Electrical grids need modernization. Renewable energy needs storage. And AI data centers are creating another enormous source of electricity demand.

So I don't think the question is whether energy storage has a future.

It clearly does.

The question is whether Fluence can turn that opportunity into profitable growth.

That's a very different question.


The Biggest Future Catalyst: AI Power

This is probably the part of the story I find most interesting.

AI infrastructure is rapidly becoming a power infrastructure story.

Everyone talks about GPUs.

But those GPUs need electricity.

Lots of it.

That means the AI buildout eventually touches utilities, natural gas, nuclear power, electrical equipment, cooling systems, transmission infrastructure and battery storage.

If Fluence continues winning meaningful hyperscaler and data-center projects, the market could eventually begin viewing FLNC as more than simply a renewable-energy storage company.

That could be a major catalyst.

But I don't want the buzzwords.

I want contracts and revenue.

The Most Important Catalyst Is Actually Boring

Fluence needs to execute.

That's it.

Fix the manufacturing problems.

Deliver the delayed projects.

Convert backlog into revenue.

Improve gross margins.

Move toward sustainable profitability.

If management accomplishes those things, sentiment toward FLNC could change very quickly because the growth opportunity is already there.

If they can't, then a giant backlog doesn't mean nearly as much.


The Chart

Technically, this is why I'm paying attention now.

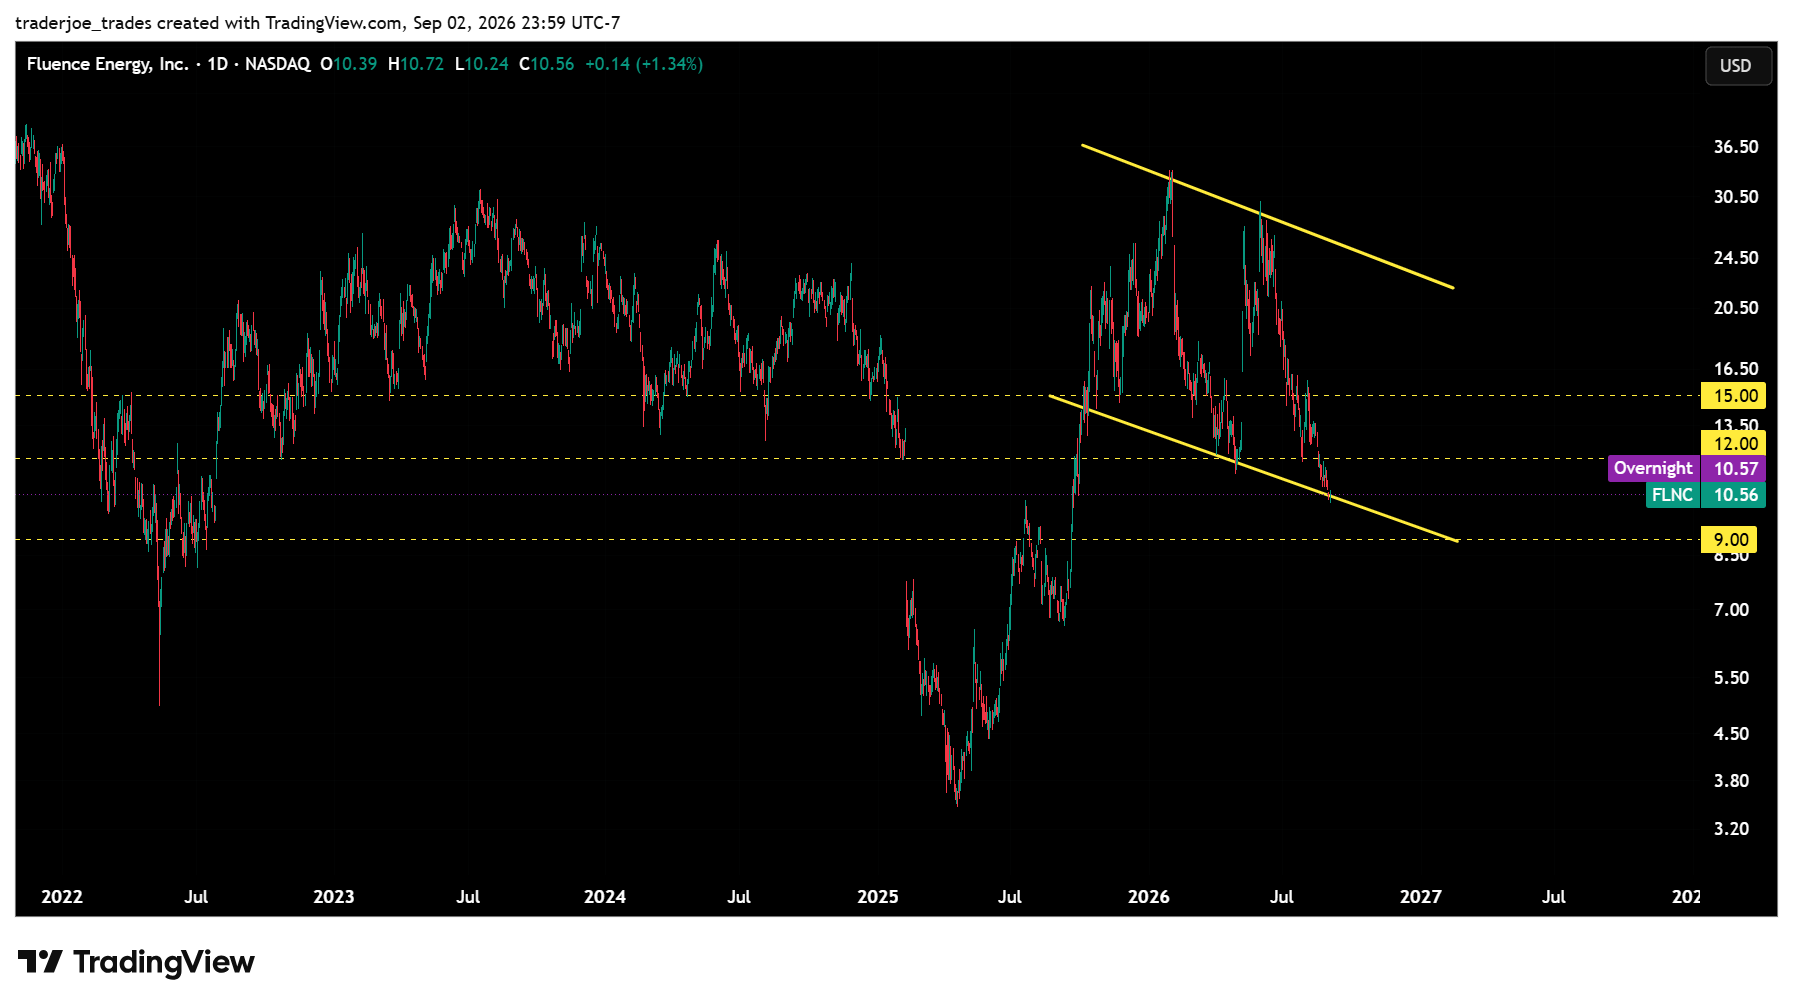
FLNC is around $10.50 and testing the lower portion of the long-term descending structure on my chart.


I'm watching roughly:

$9 → $12 → $15

If this lower structure holds, $12 becomes my first meaningful area to watch.

Above that, $15 becomes much more important.

A strong reclaim of $15 would start making the chart considerably more interesting.

But if the current structure fails, I wouldn't be shocked to see the $9 area tested.


And remember:

A stock being down 70% doesn't mean it can't fall another 30%.

That's why I'm not blindly calling this a bottom.


Bottom Line

FLNC went to the moon because investors saw enormous potential in energy storage, AI power demand, data centers and grid modernization.

It came back to Earth because the company struggled to execute on that opportunity.

Now the hype has largely disappeared.

And strangely enough, that's when I become more interested.

At $30+, everyone loved the story.

Around $10, expectations are considerably lower.

For me, FLNC is now a high-risk turnaround/growth watch, not a blind buy.

If management fixes execution while data-center and energy-storage demand continue growing, there could eventually be a very interesting recovery story here.

If execution remains poor, the downtrend can absolutely continue.

The opportunity is real. Now Fluence has to prove it can actually capitalize on it.

file_ueksxaHbVtzUD
Profile picture
Trader JoeProfile picture@trader-joe·Sep 2

$GPRO: Markiplier Becomes GoPro’s Largest Shareholder, But Don’t Chase the Hype


GoPro suddenly became one of the hottest small-cap names on the market.


The catalyst initially catching traders' attention was a familiar name from outside Wall Street: Mark Fischbach, better known as YouTube creator Markiplier.


Markiplier disclosed ownership of 13.5 million GoPro Class A shares, representing approximately 8.5% of the class. That made him GoPro's largest shareholder. The SEC filing says he has sole voting and disposition power over those shares and that they were not acquired for the purpose of influencing control of the company.


For anyone familiar with Markiplier, this isn't some random celebrity attaching his name to an action-camera company.


He's one of the world's biggest content creators and has increasingly moved into filmmaking. He has also publicly discussed GoPro's camera technology and his belief that the company is undervalued.


That combination was enough to get retail traders excited.


But there is now an even bigger development surrounding $GPRO.


GoPro Also Announced a Major Transaction


On September 1, GoPro announced an agreement to merge with Starman Optical, an optical-photonics company.


Under the proposed transaction, GoPro shareholders are set to receive approximately $285 million in cash, or about $1.14 per share, while existing GoPro shareholders are expected to retain roughly 10% ownership of the combined company. Approximately $92 million of GoPro debt is also expected to be repaid as part of the transaction.


The combined company plans to remain publicly traded.


The strategic angle is also interesting.


Starman operates in optical technology that can be used in areas such as AI infrastructure and data centers. The combination potentially gives GoPro exposure beyond its traditional consumer action-camera business, including commercial, defense and other technology markets.


So there are really two narratives colliding at once:


Markiplier becomes GoPro's largest shareholder.


Then:


GoPro announces a transformative merger.


That's rocket fuel for a small-cap momentum stock.


But that's also exactly when traders need to be careful.


Great News Does Not Always Mean Great Entry


This is probably the most important part of this entire blog.


When a small-cap stock suddenly explodes, your first instinct shouldn't be:


"How do I get in?"


It should be:


"Did I already miss the easy part?"


There is a huge difference.


The trader who bought before the crowd arrived has a completely different risk profile from the trader buying after the stock has exploded.


The first trader has cushion.


The second trader is buying excitement.


And excitement is expensive.


The Danger of Chasing Small Caps


Small-cap momentum can be absolutely vicious in both directions.


A stock can go:


+20%


+40%


+70%


and suddenly everyone thinks it's going another 100%.


Then buyers disappear.


Profit taking begins.


Momentum algorithms flip.


Late buyers panic.


And that beautiful green candle can turn into a massive upper wick incredibly quickly.


That's why I constantly tell traders:


Don't confuse a great catalyst with a great entry.


$GPRO having legitimate news doesn't mean every price is a good price.


You can be completely correct about the story and still lose money because you entered at the wrong time.


Be Especially Careful With Options


Options add another layer of risk.


You're not simply predicting whether $GPRO eventually trades higher.


You're dealing with:


Direction


Timing


Implied volatility


Expiration


Liquidity


A stock exploding on news can cause option premiums to become extremely expensive.


You can buy calls near peak excitement, have the stock pull back or consolidate, and watch the option get destroyed even though the stock remains well above where it started.


That's why chasing short-dated calls after a massive move can become dangerous very quickly.


If You Play It, Consider Going Small


There is nothing wrong with participating in momentum.


But understand what you're participating in.


This is not the type of situation where I want someone thinking:


"This is going to the moon, so I'm going heavy."


I'd rather see someone take a tiny speculative position they can comfortably lose than turn a momentum trade into a portfolio event.


If your normal position is $2,000, maybe this is the type of setup where you're using $300 or $500.


The exact amount isn't important.


The principle is:


Higher volatility should usually mean smaller size.


Not bigger size.


Unfortunately, retail traders often do the exact opposite.


The crazier the stock becomes, the more money they throw at it.


That's backwards.


Wait for the Chart


The market opens.


Let $GPRO show you what it wants to do.


Maybe it holds.


Maybe it consolidates.


Maybe it creates a clean breakout setup.


Maybe it pulls back and establishes support.


Or maybe the opening bell arrives and everyone who bought earlier decides to take profits.


You don't know.


Neither do I.


That's why waiting is a strategy.


You don't have to catch the first candle.


You don't have to catch the exact bottom.


And you definitely don't have to buy because everyone else on social media suddenly discovered the ticker.


Let the chart develop.


Find your support.


Find your resistance.


Watch volume.


Watch whether breakouts actually hold.


Then decide whether the risk/reward makes sense.


Don't Become Someone Else's Exit Liquidity


This is one of the oldest lessons in trading.


By the time a stock is trending everywhere, screenshots are circulating and everyone is talking about how much money they made, somebody already owns it significantly lower.


That doesn't mean the move is finished.


It means you need to recognize where you are in the move.


The earlier buyer is asking:


"Should I take profit?"


Meanwhile the late buyer is asking:


"Should I buy?"


Think about that.


Those two traders are potentially transacting with each other.


Don't automatically become the person providing liquidity for someone else's exit.


What I Like About the Story


There are legitimate reasons traders are interested in $GPRO.


Markiplier taking a huge position is interesting.


The merger is much more significant fundamentally.


The possibility of expanding GoPro's technology into AI infrastructure, defense and commercial applications gives investors a completely different narrative from the struggling consumer-camera company they previously knew.


That deserves attention.


But attention doesn't equal conviction.


And conviction doesn't eliminate risk.


The proposed merger still has conditions to satisfy, including shareholder and regulatory approval, and the transaction is expected to close later in 2026 if those conditions are met. ([Financial Times][3])


There is still uncertainty.


The Lesson Is Bigger Than $GPRO


I actually care more about the lesson here than the ticker.


Every few weeks the market gives us another stock like this.


Different company.


Different catalyst.


Same psychology.


Stock explodes.


Social media notices.


Retail piles in.


FOMO builds.


People increase size because they don't want to "miss it."


Some make huge money.


Others buy the top.


Then everyone forgets the lesson until the next ticker appears.


You don't have to avoid these stocks completely.


You just need to respect what they are.


Final Thoughts


$GPRO has a genuinely interesting story developing.


A globally recognized creator accumulated 13.5 million shares, representing roughly 8.5% of GoPro's Class A stock, and became its largest shareholder.


Now GoPro has announced a major merger that could reshape the company entirely.


That's enough to create serious momentum.


But momentum works both ways.


If you're already in lower, manage your position.


If you're looking to enter after the explosion, don't let FOMO make the decision for you.


Wait for a setup.


Use small size.


Respect your stop.


Don't chase vertical candles.


And most importantly:


Missing a trade costs you nothing. Chasing the wrong trade can cost you plenty.


There will always be another ticker.


[1]: "Markiplier is now GoPro's biggest shareholder"

[2]: "Struggling GoPro sells majority stake to optical maker Starman for $285 million"

[3]: "Action camera maker GoPro to be acquired after decade-long decline"

[4]: "gpro-20260901"

file_ejx5ZgbvPdbj6
Profile picture
Trader JoeProfile picture@trader-joe·Sep 1

The U.S. 10-Year Treasury Yield: The Number Every Trader Should Understand


You can spend years trading stocks without ever touching a Treasury bond.

You should still understand the bond market.

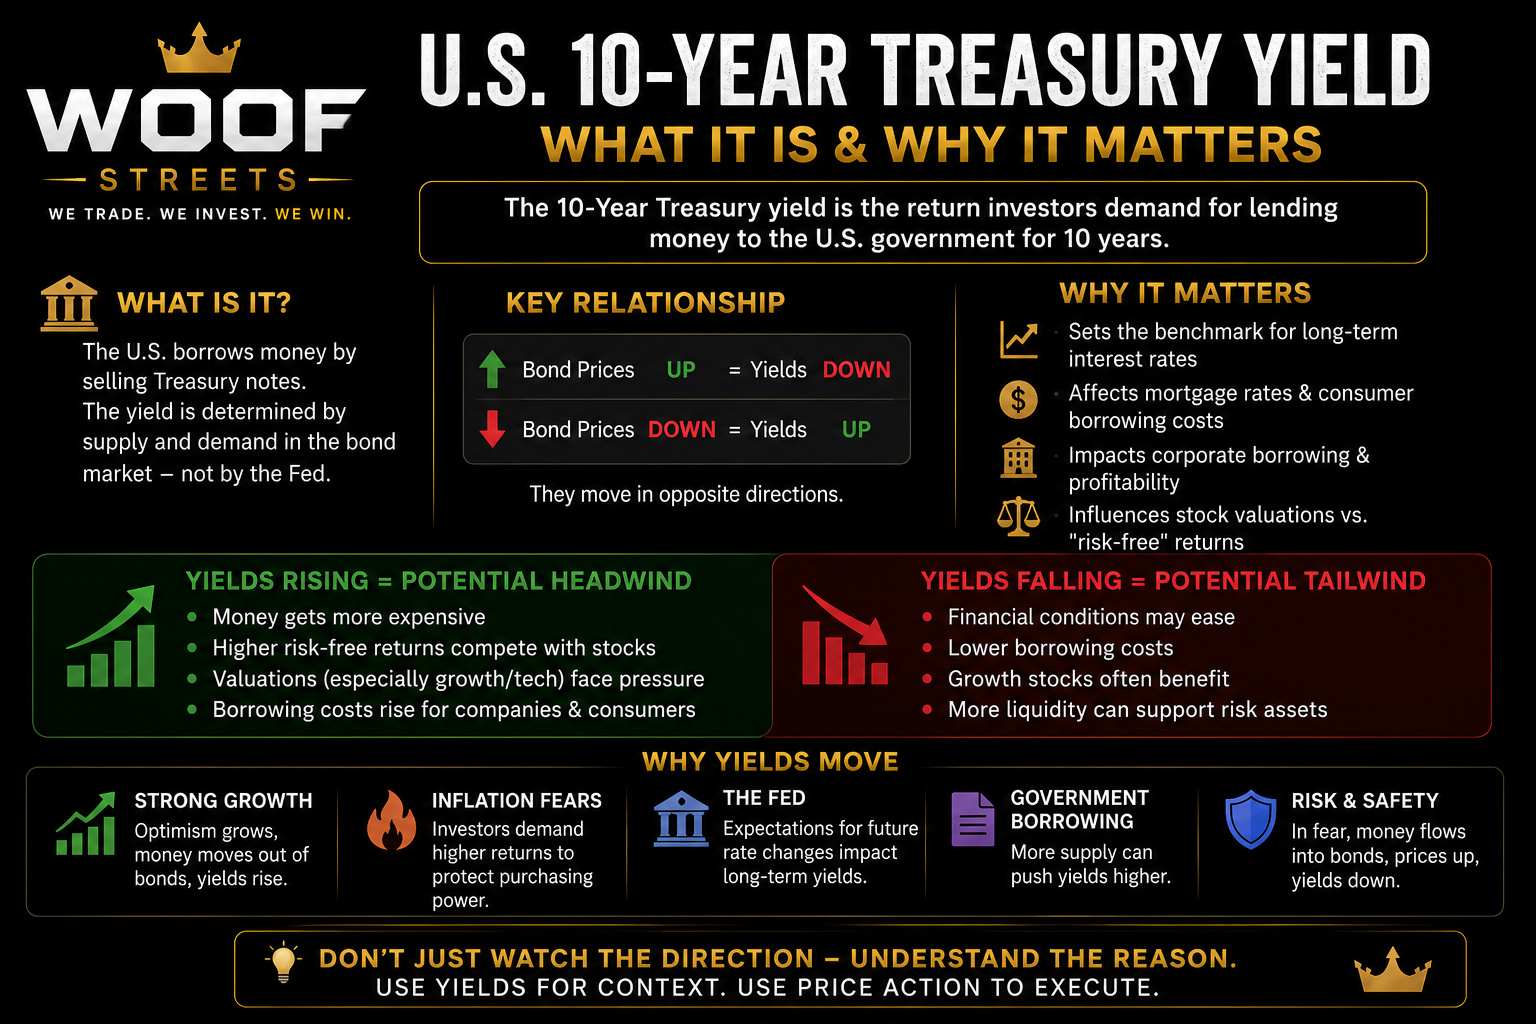
One of the most important numbers I watch outside of the stock market is the U.S. 10-Year Treasury yield, commonly called the 10Y.

You'll hear it constantly on financial television:

"10-year yields are surging."

"Tech is selling off as yields rise."

"Yields dropped after the Fed announcement."

"The 10-year broke above 4%."

For newer traders, this can sound like background noise.

It isn't.

The 10-year Treasury yield influences stock valuations, mortgage rates, corporate borrowing, investor risk appetite, and the relative attractiveness of stocks versus bonds.

Understanding it can help you understand why the market is moving, rather than simply watching candles move up and down.

Let's break it down from the beginning.


What Is a U.S. Treasury?

The United States government spends enormous amounts of money.

When the government needs to borrow money, one way it does this is by issuing Treasury securities.

Think of it very simply.

You lend money to the U.S. government.

The government promises to pay you according to the terms of that security.

There are different maturities.

You might hear about:

3-month Treasury bills

2-year Treasury notes

5-year Treasury notes

10-year Treasury notes

30-year Treasury bonds

Different maturities tell us different things about the economy and investor expectations.

For stock traders, the 10-year Treasury is especially important.


So What Is the 10-Year Treasury Yield?

The yield represents the return the market demands for owning the 10-year Treasury at its current market price.

If you hear:

"The 10-year is at 4.5%"

that does NOT mean the Federal Reserve just set interest rates at 4.5%.

This is an important distinction.

The Federal Reserve directly controls a very short-term policy rate, the federal funds target range.

The 10-year Treasury yield is determined in the bond market.

Millions of investors, institutions, banks, pension funds, foreign governments, hedge funds and other market participants buy and sell Treasuries.

Those transactions determine Treasury prices.

And Treasury prices determine yields.

So the 10Y gives us a window into what the enormous bond market is thinking.


The Most Important Relationship to Remember

If you remember only one thing from this lesson, remember this:

Bond prices UP = yields DOWN

Bond prices DOWN = yields UP

They move inversely.

This confuses almost everyone when they first learn bonds.

Suppose investors suddenly become nervous about the economy.

Money starts pouring into Treasuries.

Demand for Treasury bonds increases.

Bond prices rise.

As those prices rise, their yields fall.

Now imagine investors start dumping bonds.

Bond prices fall.

The effective yield available to new buyers rises.

That's why you'll frequently hear:

"Treasuries sold off today and yields jumped."

A Treasury selloff means Treasury prices are falling.

It does not mean yields are falling.


Why Should Stock Traders Care?

Because stocks don't exist in isolation.

Capital is constantly deciding where it wants to go.

Stocks.

Bonds.

Cash.

Real estate.

Commodities.

Crypto.

Private investments.

Everything competes for capital.

The 10-year Treasury is particularly important because U.S. government debt is generally treated as one of the lowest credit-risk investments available.

That creates an interesting comparison for investors.

Imagine Treasury yields are extremely low.

An investor looking for attractive returns may be more willing to own stocks.

Now imagine Treasury yields rise dramatically.

Suddenly an investor can earn a meaningful return from government debt without taking the same business and equity risk associated with owning stocks.

Stocks now have more competition.

That matters.


Think of the 10Y as the Price of Long-Term Money

This is not a perfect definition, but for traders it's a useful mental model.

The 10Y gives you a sense of the cost and required return associated with longer-term capital.

When long-term yields rise significantly, money becomes more expensive throughout the financial system.

Companies may face higher borrowing costs.

Consumers may face higher mortgage rates.

Investors demand higher returns.

Stock valuations can come under pressure.

When yields fall significantly, some of that pressure can ease.

That's why you should have the 10Y somewhere on your radar.


Why Growth Stocks Hate Rapidly Rising Yields

This is probably the most useful section for many of our traders.

High-growth stocks are often valued based heavily on profits investors expect the company to generate years into the future.

Think about a young technology company.

Maybe today's earnings aren't impressive.

But investors believe:

"In five years this company could be enormously profitable."

Those future earnings have value today.

But finance applies something called a discount rate to determine what future money is worth in today's dollars.

As interest rates and bond yields rise, those future earnings become less valuable in present-value calculations.

This can pressure the valuation investors are willing to pay.

That is why rapidly rising yields can hit:

High P/E technology stocks

Unprofitable growth companies

Speculative AI stocks

Small-cap growth

Long-duration assets

especially hard.

The farther into the future investors are looking for the company's profits, the more sensitive the valuation can become to changes in rates.


A Simple Example

Imagine two opportunities.

Investment A is a government security offering a very low yield.

Investment B is a risky growth stock that might produce huge returns someday.

If the government security pays almost nothing, investors may be willing to accept more risk.

Now imagine government securities suddenly offer a much more attractive return.

Investment B now has to compete with that.

The risky stock hasn't necessarily become a worse company.

The alternative became more attractive.

That concept is called opportunity cost.

Every dollar invested in one asset is a dollar that cannot simultaneously be invested somewhere else.

This is one reason higher Treasury yields can compress stock valuations.


Why Tech Often Reacts More Than Other Sectors

You've probably seen days where:

10Y ripping

QQQ dropping

High-growth stocks getting smoked

while some traditional sectors hold up much better.

There is logic behind that.

Technology companies often trade at higher valuation multiples because investors expect significant future growth.

If the market suddenly demands a higher return on capital, those expensive multiples become harder to justify.

A stock trading at 40, 50 or 60 times earnings has much more valuation embedded in future expectations than a mature company trading at a modest multiple.

This doesn't mean:

10Y up = short every tech stock.

Never reduce the market to something that simple.

It means rapidly rising yields can create an important headwind for expensive growth stocks.


The 10Y and P/E Multiples

This is another important connection.

Suppose investors are willing to pay a very high P/E multiple for a company.

Why?

Usually because they expect strong future earnings growth.

But when the risk-free alternative becomes more attractive, investors can become less willing to pay extreme multiples.

Instead of paying 40 times earnings, perhaps investors decide the stock deserves 30 times earnings.

Here's the important part.

The company's earnings don't necessarily have to collapse for the stock to fall.

The multiple itself can contract.

That's called multiple compression.

This is why you sometimes see a company report decent earnings while the stock continues struggling in a high-rate environment.

The business might be fine.

The market simply isn't willing to pay the same valuation anymore.


Higher Yields Also Affect the Actual Business

So far we've mostly talked about valuation.

But there's another side.

Companies borrow money.

They issue debt.

They finance acquisitions.

They build factories.

They construct data centers.

They purchase equipment.

They expand internationally.

They refinance old debt.

If borrowing costs rise, those activities become more expensive.

Imagine a company planning a massive expansion.

When financing is cheap, the economics might look fantastic.

When financing becomes expensive, management may reconsider.

Projects get delayed.

Hiring slows.

Expansion plans shrink.

Companies become more cautious.

Eventually, higher rates can work their way into the real economy.


Consumers Feel It Too

The 10-year Treasury also has a major relationship with consumer borrowing conditions.

Mortgage rates are heavily influenced by longer-term bond yields.

When longer-term yields rise, mortgage rates often rise as well.

Think about what that means.

A family buying the same house suddenly faces a much larger monthly payment.

Some buyers leave the market.

Some buy cheaper homes.

Homebuilders can feel pressure.

Real estate activity can slow.

Consumers may have less disposable income.

Businesses connected to housing may feel the effects.

The 10Y isn't simply a number on CNBC.

It can eventually affect what ordinary people pay every month.


Why Does the 10-Year Yield Rise?

This is where things get more complicated.

A rising 10Y isn't automatically bearish.

You need to ask:

WHY are yields rising?

This is one of the biggest mistakes traders make.

They see the 10Y rising and immediately assume stocks must fall.

Not necessarily.

There are several reasons yields can rise.


Scenario 1: Strong Economic Growth

Suppose the economy is doing extremely well.

Employment is strong.

Consumers are spending.

Corporate profits are growing.

Investors become optimistic.

Money may rotate away from defensive government bonds and toward riskier assets.

Bond prices fall.

Yields rise.

In this situation, rising yields can accompany a strong stock market because economic growth is supporting earnings.

So:

Yields rising because growth is strong

can be very different from:

Yields rising because inflation is getting out of control.

Context matters.


Scenario 2: Inflation Fears

Inflation is terrible for fixed-income investors.

Why?

Because inflation reduces the purchasing power of future money.

Imagine locking your money into an investment for years while inflation remains very high.

You would demand more compensation.

That means investors may require higher yields to own long-term government debt.

So persistent inflation expectations can push Treasury yields higher.

This type of yield increase can be much more uncomfortable for stocks because it raises the possibility that interest rates will remain restrictive.


Scenario 3: The Fed

The Federal Reserve does not directly set the 10-year Treasury yield.

But Fed policy strongly influences expectations.

If the market thinks the Fed will keep rates higher for longer, longer-term yields can respond.

If inflation suddenly cools and investors expect aggressive rate cuts, yields may fall.

This is why markets react so violently to:

CPI

PCE

Jobs reports

Fed meetings

Powell speeches

These events change expectations about future monetary policy.

And those expectations flow through the bond market.


Scenario 4: Government Borrowing

The United States issues enormous quantities of debt.

More government borrowing means more Treasury supply needs to be absorbed by investors.

If the market requires a higher yield to absorb that supply, yields can rise.

This is increasingly important for investors to understand.

Bond markets care about supply and demand just like every other market.

More supply without enough demand can require lower bond prices and therefore higher yields.


Scenario 5: Fear and the Flight to Safety

Now flip everything around.

Imagine something terrible happens.

Major recession fears.

Financial crisis.

Geopolitical shock.

Investors panic.

Where does enormous institutional money often go?

U.S. Treasuries.

That surge in demand pushes Treasury prices higher.

And because bond prices and yields move inversely:

Treasury prices rise

Treasury yields fall

That's why you can sometimes see the 10Y collapsing during periods of extreme market fear.

But here's another important lesson.

Falling yields are not always bullish.

If yields are collapsing because investors think the economy is about to enter a severe recession, stocks can fall at the same time.

Again:

Don't just watch the direction.

Understand the reason.


The 10-Year Versus the 2-Year

You'll also hear traders talk about the 2-year Treasury yield.

The 2Y and 10Y tell us somewhat different things.

The 2-year tends to be more sensitive to expectations about Federal Reserve policy over the nearer term.

The 10-year reflects a broader combination of expectations involving:

Growth

Inflation

Future interest rates

Government borrowing

Term premium

Investor demand

That's why macro traders constantly compare the two.


What Is the Yield Curve?

Normally, investors expect more compensation for lending money for longer periods.

So longer-term bonds often yield more than shorter-term bonds.

But sometimes the opposite happens.

Short-term yields rise above long-term yields.

This is known as a yield curve inversion.

You've probably heard people say:

"The yield curve inverted. Recession incoming."

Historically, certain yield curve inversions have preceded recessions.

But it is not a magical market timing tool.

An inversion doesn't tell you:

Sell SPY at 10:32 tomorrow morning.

It tells you that the bond market is pricing an unusual economic environment where short-term rates are high relative to longer-term expectations.

It's a macro signal, not an entry signal.


Why Traders Should Watch the Speed of the Move

This is something I think is extremely important.

Sometimes the actual yield level matters less than how quickly yields are moving.

Markets can adjust to almost anything given enough time.

What markets hate is rapid repricing.

If the 10Y slowly moves higher over many months because the economy is healthy, stocks may absorb it.

If the 10Y suddenly explodes higher over several sessions, markets may have to rapidly reprice valuations.

That's when you can see violent moves in growth stocks.

So don't only ask:

"Where is the 10Y?"

Also ask:

"How quickly did it get there?"

Velocity matters.


How I Would Use This as a Trader

I would never trade solely because of the 10Y.

I wouldn't say:

"Yield is up today. Buy puts."

That's too simplistic.

Instead, use it as context.

Suppose QQQ is sitting at major resistance.

Growth stocks are already weak.

The 10Y suddenly starts ripping higher.

Semiconductors begin losing support.

Market breadth deteriorates.

Now several pieces of information are telling you the same story.

That's useful.

On the other hand, imagine yields rise slightly but QQQ continues holding support, NVDA is strong, semiconductors are breaking out and breadth remains healthy.

Price is telling you the market doesn't currently care.

Respect price.

Macro should help explain the environment.

It should not override what is actually happening on the chart.


A Simple Screen Setup

If you trade regularly, consider keeping these somewhere on your watchlist:

SPY

QQQ

10-Year Treasury yield

VIX

Dollar Index

Oil

You don't need to stare at all of them every second.

You're trying to develop situational awareness.

If QQQ suddenly dumps, you can quickly check:

Did yields spike?

Did the dollar rip?

Did VIX explode?

Was there a macro headline?

Is this isolated tech weakness?

You start building a picture.

That's the difference between simply watching price and understanding the environment surrounding price.


The Relationship Is Not Perfect

This needs to be emphasized.

You will absolutely see days when:

10Y rises and QQQ rises.

You will see days when:

10Y falls and QQQ falls.

Markets are driven by thousands of variables simultaneously.

Earnings.

Guidance.

Economic growth.

Inflation.

Positioning.

Options flows.

Liquidity.

Geopolitics.

Fed expectations.

Valuations.

Sentiment.

Technical levels.

Treasury yields are one piece of the puzzle.

A very important piece, but still one piece.

Anyone telling you that stocks mechanically move opposite the 10Y every day is oversimplifying the market.


What About Bitcoin?

Crypto traders should understand yields too.

Bitcoin doesn't operate in some completely separate financial universe anymore.

When yields are high and cash or government securities provide attractive returns, speculative assets have more competition for capital.

When real yields fall, liquidity improves and investors become more comfortable taking risk, crypto can benefit.

Again, it isn't a perfect inverse relationship.

Bitcoin has its own catalysts.

But if you're trading BTC, ETH, miners or crypto-related stocks, you should still understand what's happening in rates.

Macro liquidity matters.


What About Small Caps?

Small companies can also be sensitive to rates.

Why?

Many smaller companies depend more heavily on external financing.

They may have weaker balance sheets.

They may carry floating-rate debt.

They may need additional capital to grow.

They may not generate enough free cash flow internally.

Higher financing costs can therefore hurt smaller companies disproportionately.

This is another reason the rate environment matters beyond mega-cap technology.


What About Banks?

Banks are more complicated.

Higher rates can sometimes help banks because they may earn more on loans.

But extremely rapid moves in rates can also create problems.

Banks hold securities.

They manage deposits.

They manage duration.

They manage funding costs.

A major shift in the yield curve can affect profitability and balance sheets in complicated ways.

So again, don't use:

Yields up = banks up

as some automatic rule.

Understand the environment.


What I Want You to Remember

You do NOT need to become a bond trader.

You don't need to calculate duration by hand.

You don't need to become a macroeconomist.

You need to understand what the market is telling you.

The 10-year Treasury yield is one of those signals.

At the simplest level:

10Y rising quickly

Can mean tighter financial conditions, higher borrowing costs and pressure on expensive growth valuations.

10Y falling

Can reduce valuation pressure and make growth assets relatively more attractive.

But then ask the second question:

Why is it moving?

That question separates surface-level analysis from actual market understanding.


A Practical Example

Imagine tomorrow morning you wake up and see:

10Y sharply higher

QQQ weak premarket

Semiconductors weak

High-growth stocks getting hit

Dollar strengthening

Now you have a story.

The market may be repricing interest-rate expectations.

You don't blindly short.

You go to the chart.

Where is support?

Where is resistance?

What happened overnight?

Is QQQ holding the 200 EMA?

Are buyers stepping in?

Is the opening move being absorbed?

Now macro and technical analysis are working together.

That's where this becomes useful.


Price Action Still Comes First

Anyone who has followed my trading philosophy knows where I stand.

I love understanding the bigger picture.

But at the end of the day:

Price pays.

The 10Y can tell me technology should theoretically struggle.

If QQQ keeps breaking resistance and making higher highs, I'm not going to argue with the chart because of some macro thesis.

Markets can remain disconnected from your expectations longer than your options can remain alive.

Use yields to understand the battlefield.

Use price action to actually fight the battle.


Final Thoughts

The U.S. 10-Year Treasury yield might seem boring compared with NVDA, Bitcoin, SPY 0DTE or some small-cap stock moving 100%.

But underneath all of those trades sits the cost of money.

And the bond market is enormous.

When the cost of money changes, eventually everything feels it.

Stock valuations change.

Corporate borrowing changes.

Mortgage rates change.

Investor risk appetite changes.

Capital allocation changes.

That's why professional investors pay so much attention to Treasury yields.

You don't need to predict where the 10Y is going.

Just start watching it.

When the market has a strange day, check yields.

When QQQ suddenly gets hammered, check yields.

When high-growth stocks explode higher after an inflation report, check yields.

When the Fed speaks, check yields.

Over time, you'll start seeing the connections yourself.

And that's really the goal.

Not memorizing another indicator.

Not creating another buy or sell signal.

But understanding why money is moving.

If you remember nothing else from this lesson, remember these three things:

Bond prices and yields move in opposite directions.

Rapidly rising yields can pressure stocks, especially expensive growth stocks.

Never look at the direction of yields without asking why they're moving.

The chart tells you what is happening.

The bond market can often help you understand why.

file_hpuNuEQVzivkU
Profile picture
Thy VuProfile picture@corgi4mvp·Aug 31

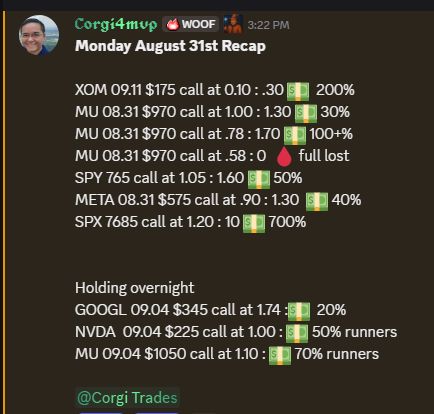
Monday August 31st Recap

$XOM 09.11 $175 call at 0.10 : .30 💵 200%

$MU 08.31 $970 call at 1.00 : 1.30 💵 30%

$MU 08.31 $970 call at .78 : 1.70 💵 100+%

$MU 08.31 $970 call at .58 : 0 🩸 full lost

$SPY 765 call at 1.05 : 1.60 💵 50%

$META 08.31 $575 call at .90 : 1.30 💵 40%

$SPX 7685 call at 1.20 : 10 💵 700%


Holding overnight

$GOOGL 09.04 $345 call at 1.74 :💵 20%

$NVDA 09.04 $225 call at 1.00 : 💵 50% runners

$MU 09.04 $1050 call at 1.10 : 💵 70% runners

file_V6AtF3FGQBXgt
Profile picture
Trader JoeProfile picture@trader-joe·Aug 31

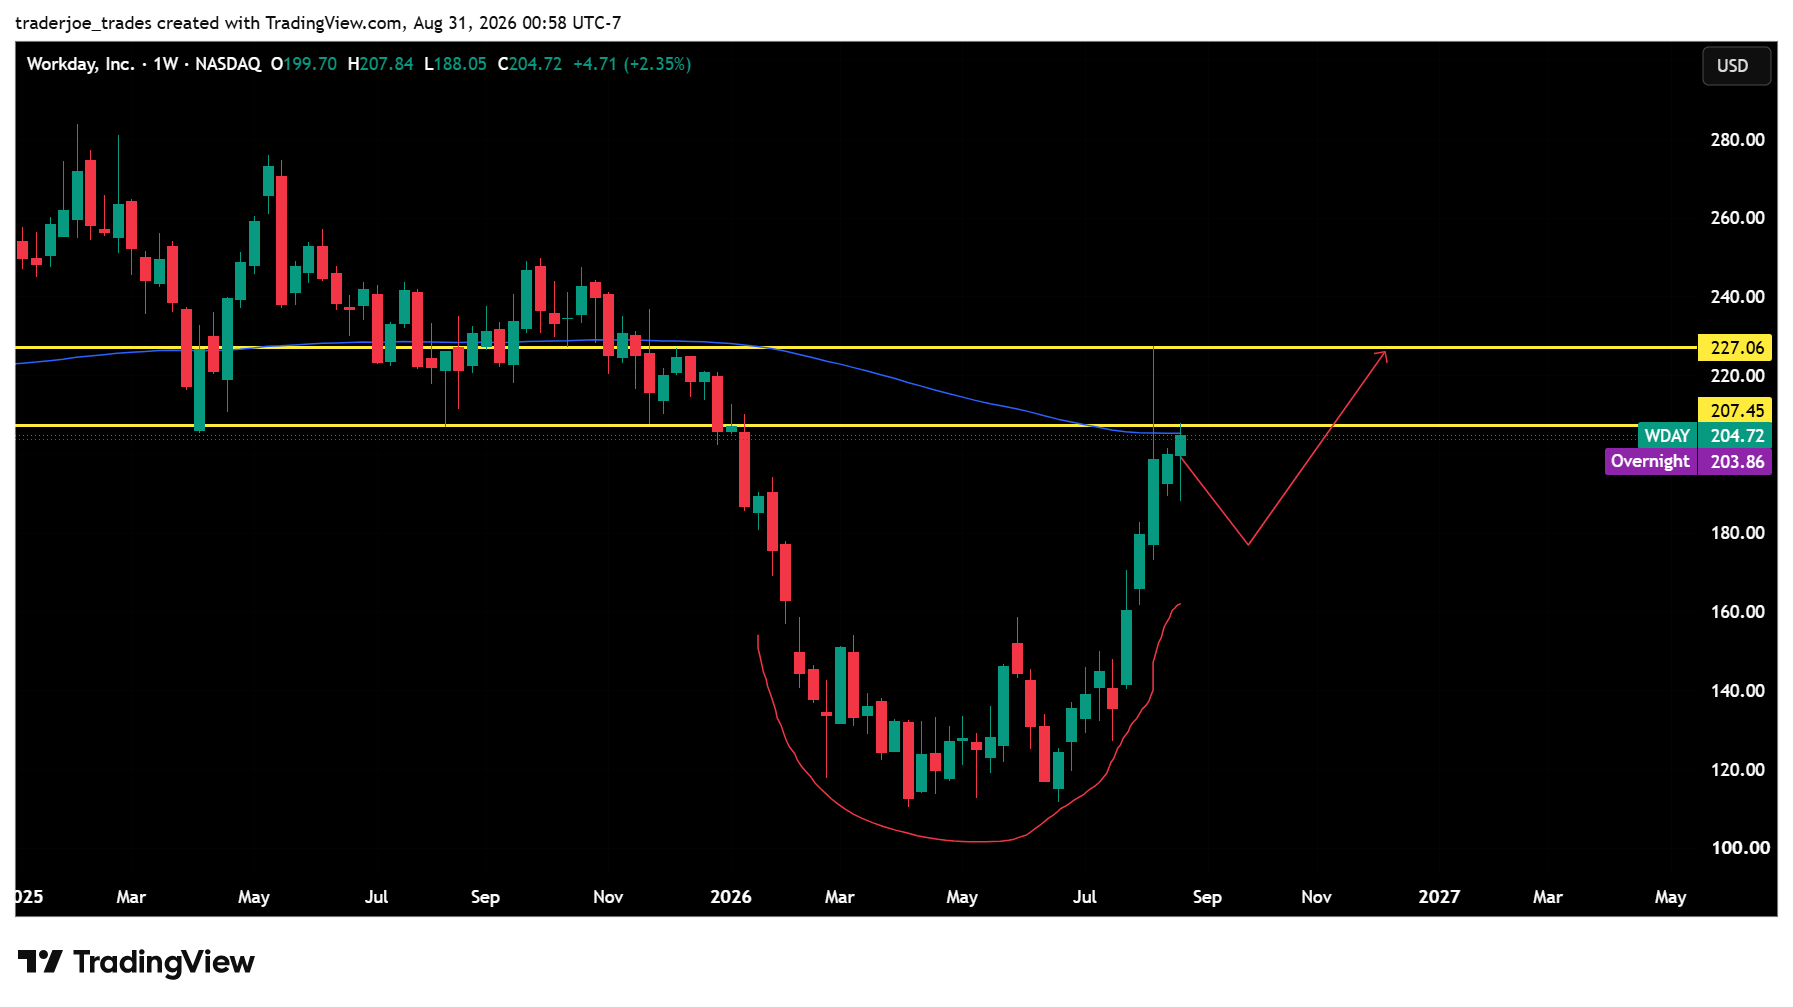
WDAY potential set up. blue 200ema. let's see if really forms c&h. Just a scenario. Let the price confirm it.


No furus. All pros here. Join

file_MN3QhVwYZNMG2
Profile picture
Trader JoeProfile picture@trader-joe·Aug 31

Back from a really late vacation with a refreshed mind. 🧠

Sometimes the best thing you can do as a trader is step away from the charts. No chasing, no P&L, just have some fun.

The market will always be here. Come back patient, disciplined, and with fresh eyes if you haven't taken vacation already(labor day is coming!) You'd be surprised how much clearer the chart looks when your mind isn't cluttered.

file_H61hK2X90A2i4
file_DT25kgpfXq80s
file_KEumZmyMfUPbj
file_GozDKvkDGoojA
+8
Profile picture
Trader JoeProfile picture@trader-joe·Aug 31

🟠 BITCOIN: THE BULL CASE IS STARTING TO BUILD AGAIN


Bitcoin has been through a serious reset.

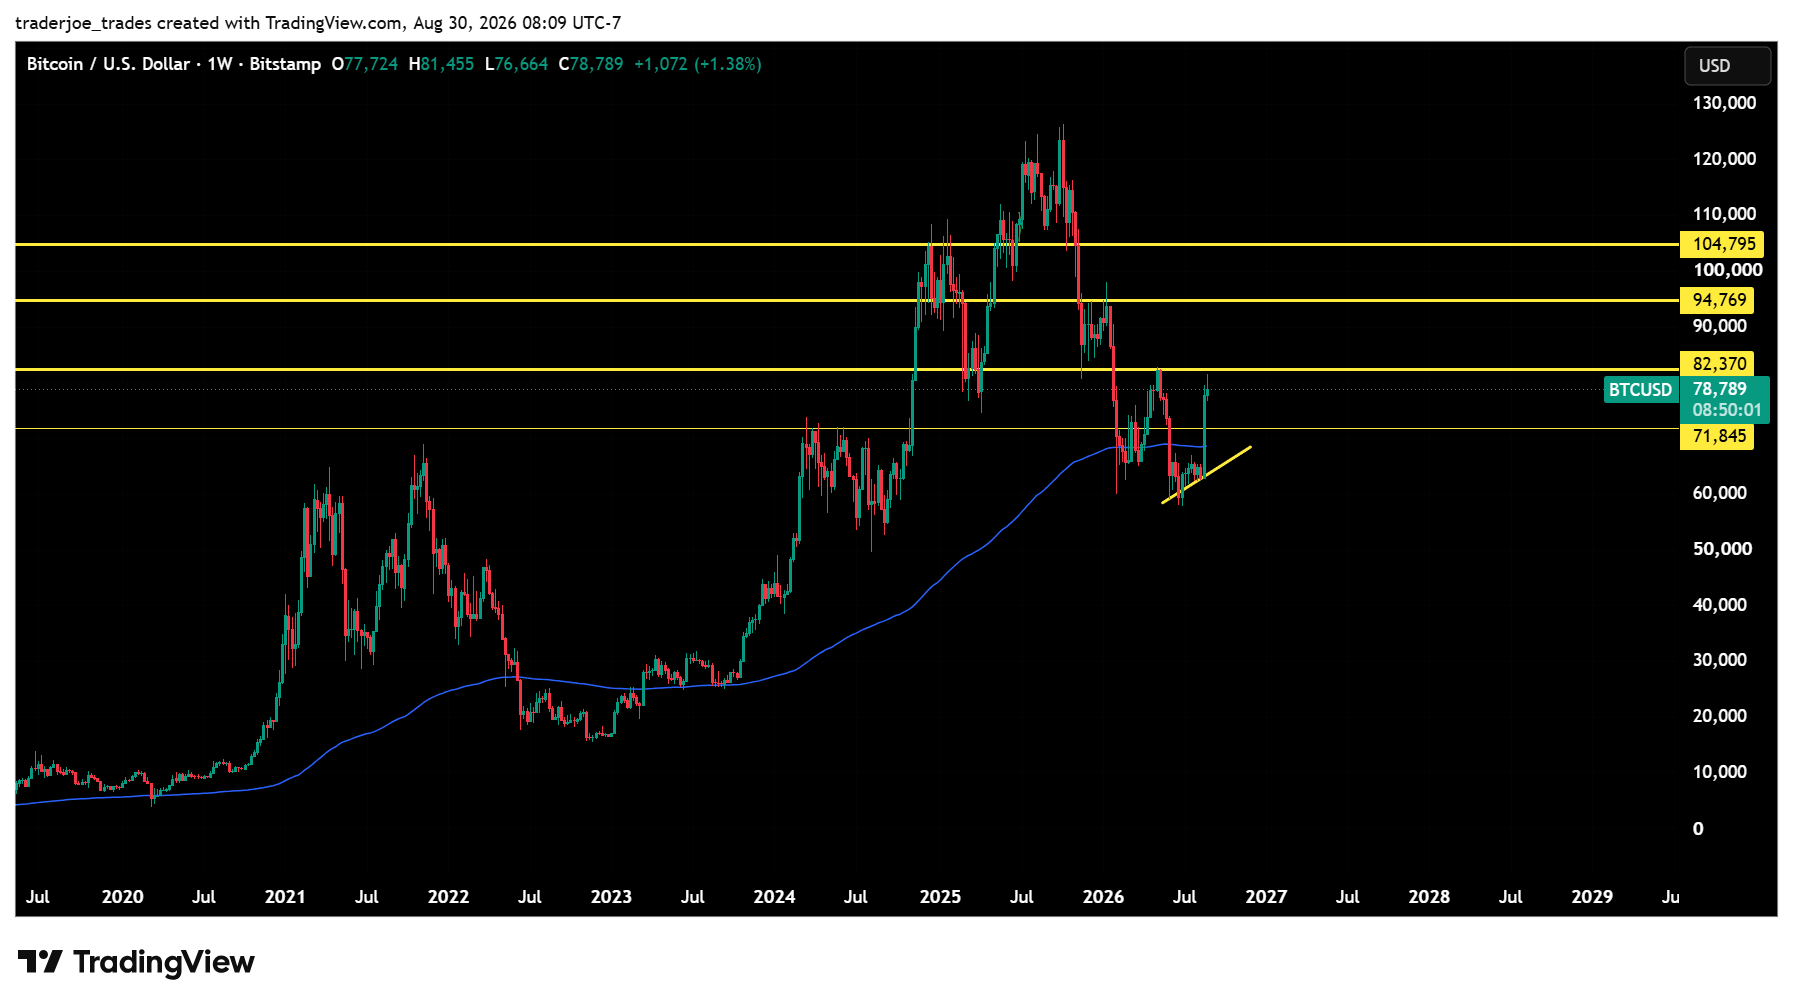
After running to new highs above $120K, BTC went through a brutal correction that eventually brought price all the way back toward the $60K region.

That kind of move changes sentiment fast.

When Bitcoin was at the highs, everyone wanted it. Once it collapsed, suddenly the bull cycle was dead, crypto was finished, and everyone started looking lower.

That's usually when I want to zoom out.

Looking at the weekly chart today, I'm not ready to declare a new Bitcoin bull run.

But I do think the chart is becoming increasingly interesting.

The selling has slowed. A base appears to be developing. Bitcoin defended a major long-term moving average area, started producing higher lows, and has now pushed back toward a major overhead resistance zone.

At the same time, the fundamental backdrop for crypto in the United States could be changing significantly.

Put the two together, and I think there is a legitimate BTC bull narrative worth discussing.


The Weekly Chart Is Repairing Itself

The first thing I want everyone to understand is that the yellow lines on my chart are rough zones.

Don't look at them as exact support or resistance prices.

Especially with Bitcoin.

BTC can move thousands of dollars and still essentially be trading within the same weekly technical area.

I'm much more interested in the structure.

Bitcoin came down hard from the highs and eventually found substantial demand around the $60K region.

More importantly, BTC didn't simply bounce once and immediately collapse again.

It started building.

We can see buyers repeatedly stepping in around the lows, creating what looks like a rising support structure.

That is the first thing bulls needed.

Stop making lower lows.

Then start making higher lows.

That's how damaged charts begin repairing themselves.


The Major Weekly Moving Average Matters

The blue moving average on my chart is another reason I'm paying attention.

During the selloff, BTC came directly into this major long-term trend area.

That could have turned ugly.

Instead, Bitcoin has fought its way back and is now trading comfortably higher.

To me, the moving average itself isn't some magical line.

It's the reaction around it that matters.

Sellers had a chance to push BTC into another major leg lower.

So far, buyers have responded.

When you combine that with the rising trendline underneath price, we're beginning to see some technical confluence supporting the idea that the $60K region may have been an important bottoming area.

Again — may have been.

Confirmation comes from what Bitcoin does next.


Now Comes The Hard Part

Bitcoin has bounced.

That's the easy part.

Now BTC has to prove this is something more than a bear-market rally.

The first major test is roughly the low-$80K region.

There is meaningful historical price action around this general area, so I expect sellers to show up.

That's normal.

What I really want to see isn't Bitcoin blast through everything in one candle.

I'd rather see something more sustainable:

Break resistance → consolidate → retest → hold → continue higher.

That would tell me previous resistance is beginning to turn into support.

And that would make the weekly structure much more convincing.


If The Low-$80Ks Break...

Then things start getting fun.

The next broad area I'm watching would be somewhere around the mid-$90Ks.

Again, I'm intentionally keeping these numbers loose.

This is a weekly Bitcoin chart.

We're mapping areas where price could react, not pretending we know exactly where some algorithm is going to sell BTC six weeks from now.

If Bitcoin can work its way through the low-$80Ks and eventually attack the mid-$90Ks, market psychology could change very quickly.

Because sitting directly above that is probably the most important psychological number in crypto:

$100,000.

Bitcoin getting back above $100K would be significant beyond the technical chart.

It's psychological.

Suddenly the conversation changes from:

"Was that just a dead-cat bounce?"

to:

"Is Bitcoin going back to the highs?"

Markets run on psychology just as much as lines on charts.


The $100K Area Could Be The Real Battleground

If Bitcoin eventually returns to the $100K-$105K region, that's where I think the chart becomes extremely interesting.

BTC spent significant time trading above $100K during the previous advance.

Reclaiming that general area would represent a major repair of the damage created during the correction.

At that point, the distance between Bitcoin and its previous highs starts shrinking considerably.

That's when traders who sold the crash start reconsidering.

That's when momentum traders start returning.

That's when institutional narratives become louder.

And that's when FOMO can slowly start creeping back into the market.

But Bitcoin has work to do before we get there.

One zone at a time.


The Bull Case Doesn't Require Bitcoin To Go Straight Up

This is important.

I don't want BTC to simply go vertical.

Vertical markets are fun until they aren't.

I'd much rather see something like:

Higher low → breakout → consolidation → higher low → next breakout.

That's how sustainable trends develop.

Bitcoin could easily reject from the current resistance area and pull back.

That alone wouldn't make me bearish.

I'd be watching whether buyers defend the low-$70K region and, more importantly, whether the broader rising structure remains intact.

A healthy pullback that creates another higher low could actually improve this setup.

The bigger concern would be BTC completely losing the recovery structure and falling back toward the major lows.

That's where the bull thesis starts needing serious reevaluation.


Now Add The CLARITY Act

This is where the story becomes more interesting than just some lines on a Bitcoin chart.

For years, one of the biggest problems surrounding crypto in the United States has been regulatory uncertainty.

Not necessarily regulation itself.

Uncertainty.

Who regulates crypto?

Which assets are securities?

Which are commodities?

What can exchanges list?

What rules do institutions have to follow?

What happens when regulators change their interpretation?

Those questions have hung over the industry for years.

The CLARITY Act is an attempt to finally establish a more defined regulatory structure for digital assets in America.

And regardless of anyone's opinion about individual provisions of the bill, the bigger concept matters:

Crypto is moving toward becoming a formally regulated part of the U.S. financial system rather than something Washington doesn't know how to classify.

That's potentially a major long-term development.


Institutions Don't Like Gray Areas

Retail traders can open an app and buy Bitcoin because they think it's going higher.

Institutions operate differently.

Large asset managers, banks, pension funds, corporations and financial institutions have compliance departments, lawyers, risk committees and regulatory requirements.

They want rules.

They want custody standards.

They want clear jurisdiction.

They want to understand exactly what they're allowed to own and how they're allowed to interact with it.

That's why regulatory clarity can matter so much.

The bull argument isn't:

CLARITY passes = Bitcoin instantly moons.

That's silly.

The bigger argument is:

Clearer regulation lowers one of the barriers preventing traditional capital from participating more aggressively in digital assets.

And that is a much more important long-term story.


Bitcoin Is Becoming Part Of Traditional Finance

Think about how dramatically the Bitcoin narrative has changed.

Years ago, Bitcoin was mostly something crypto enthusiasts traded on specialized exchanges.

Today the ecosystem looks completely different.

Bitcoin has become accessible through traditional financial products.

Large financial institutions participate in the ecosystem.

Public companies can hold Bitcoin on their balance sheets.

Institutional custody has developed.

Traditional investors can gain BTC exposure without ever touching a crypto wallet.

And now Congress is debating how digital assets should formally fit inside America's regulatory framework.

Whether you're bullish or bearish on Bitcoin, that's a massive evolution.

Crypto isn't disappearing from the financial system.

The debate increasingly appears to be about how it gets integrated into the financial system.

That's an important distinction.


The Correction Could Ultimately Be Healthy

Nobody likes watching an asset fall roughly 50%.

But corrections serve a purpose.

The run toward the highs created enormous optimism.

Everyone starts believing price only goes one direction.

Leverage builds.

Speculation increases.

Late buyers chase.

Then the market does what markets always eventually do.

It resets expectations.

The collapse toward the $60K area likely wiped out a tremendous amount of speculative enthusiasm.

And that's not necessarily bad for the long-term structure.

Markets often need to transfer assets from impatient holders to patient holders before another major advance can begin.

The question isn't whether Bitcoin crashed.

We already know it did.

The question now is:

What does Bitcoin do after the crash?

That's what I'm watching.


My Bull Scenario

I'm keeping this deliberately simple.

I want Bitcoin to continue building higher lows.

I want the broader rising support structure to remain intact.

Then I want BTC to start reclaiming the major overhead zones.

First, roughly the low-$80Ks.

Then somewhere around the mid-$90Ks.

Then comes the massive $100K-$105K region.

If Bitcoin gradually reclaims those areas while maintaining higher lows, the weekly chart becomes progressively more bullish.

And eventually?

The previous highs come back into the conversation.

Break those highs and we're back in price discovery.

But we're nowhere near needing to make that prediction yet.


The Bear Scenario

There is always another side.

Bitcoin could fail around the current resistance zone.

The recovery could lose momentum.

BTC could break the rising structure and begin moving back toward the lows.

If that happens, I'm not going to sit here screaming "bullish" because I wrote a bullish blog.

Price comes first.

The low-$70Ks are an area I'd like to see buyers defend during normal pullbacks.

The $60K region is much more important structurally.

A major breakdown through that broader bottoming area would force me to reconsider the entire thesis.

That's trading and investing.

You build a thesis.

Then you let price tell you whether you're right.


The Bigger Picture

What makes Bitcoin interesting to me right now isn't any single indicator.

It's the combination of several things happening simultaneously.

The market experienced a huge reset.

Bitcoin found buyers around a major long-term technical area.

The weekly chart is beginning to build higher lows.

Price is now challenging meaningful overhead resistance.

And outside the chart, the regulatory environment surrounding digital assets in America could be entering a completely new phase.

None of those things guarantees Bitcoin goes higher.

Together, however, they create a setup worth paying attention to.


Final Thoughts

I'm not trying to predict where Bitcoin will trade next week.

I'm looking at the bigger picture.

Right now my rough roadmap is:

Low-$70Ks → important support area

Low-$80Ks → first major resistance test

Mid-$90Ks → next major resistance zone

$100K-$105K → major structural and psychological reclaim

Those aren't precision targets.

They're areas.

Bitcoin could overshoot them, undershoot them, wick through them or consolidate around them.

What matters is how price behaves when it gets there.

The simplest bull thesis is this:

Keep making higher lows.

Keep reclaiming resistance.

Keep turning old resistance into support.

If Bitcoin does that, I don't need to predict the exact top.

The chart will tell us the story as it develops.

And if regulatory clarity continues progressing while the technical structure continues repairing itself, Bitcoin could have both a technical narrative and a fundamental narrative working together.

That's when I really start paying attention.

For now?

The bull isn't fully back.

But it's waking up. 🐂₿

file_oSgKspZnJ4q08
Profile picture
Trader JoeProfile picture@trader-joe·Aug 23

$ADBE

Adobe Is Finally Getting Interesting Again

Adobe has been one of those stocks nobody really wants to talk about anymore.

And honestly, that's part of why I'm looking at it.

$ADBE went from being one of the premier software names in the market to getting absolutely destroyed. AI fears, slowing growth expectations, competition, valuation compression — pretty much everything that could hurt the narrative hit at once.

The stock eventually fell all the way into the $190s.

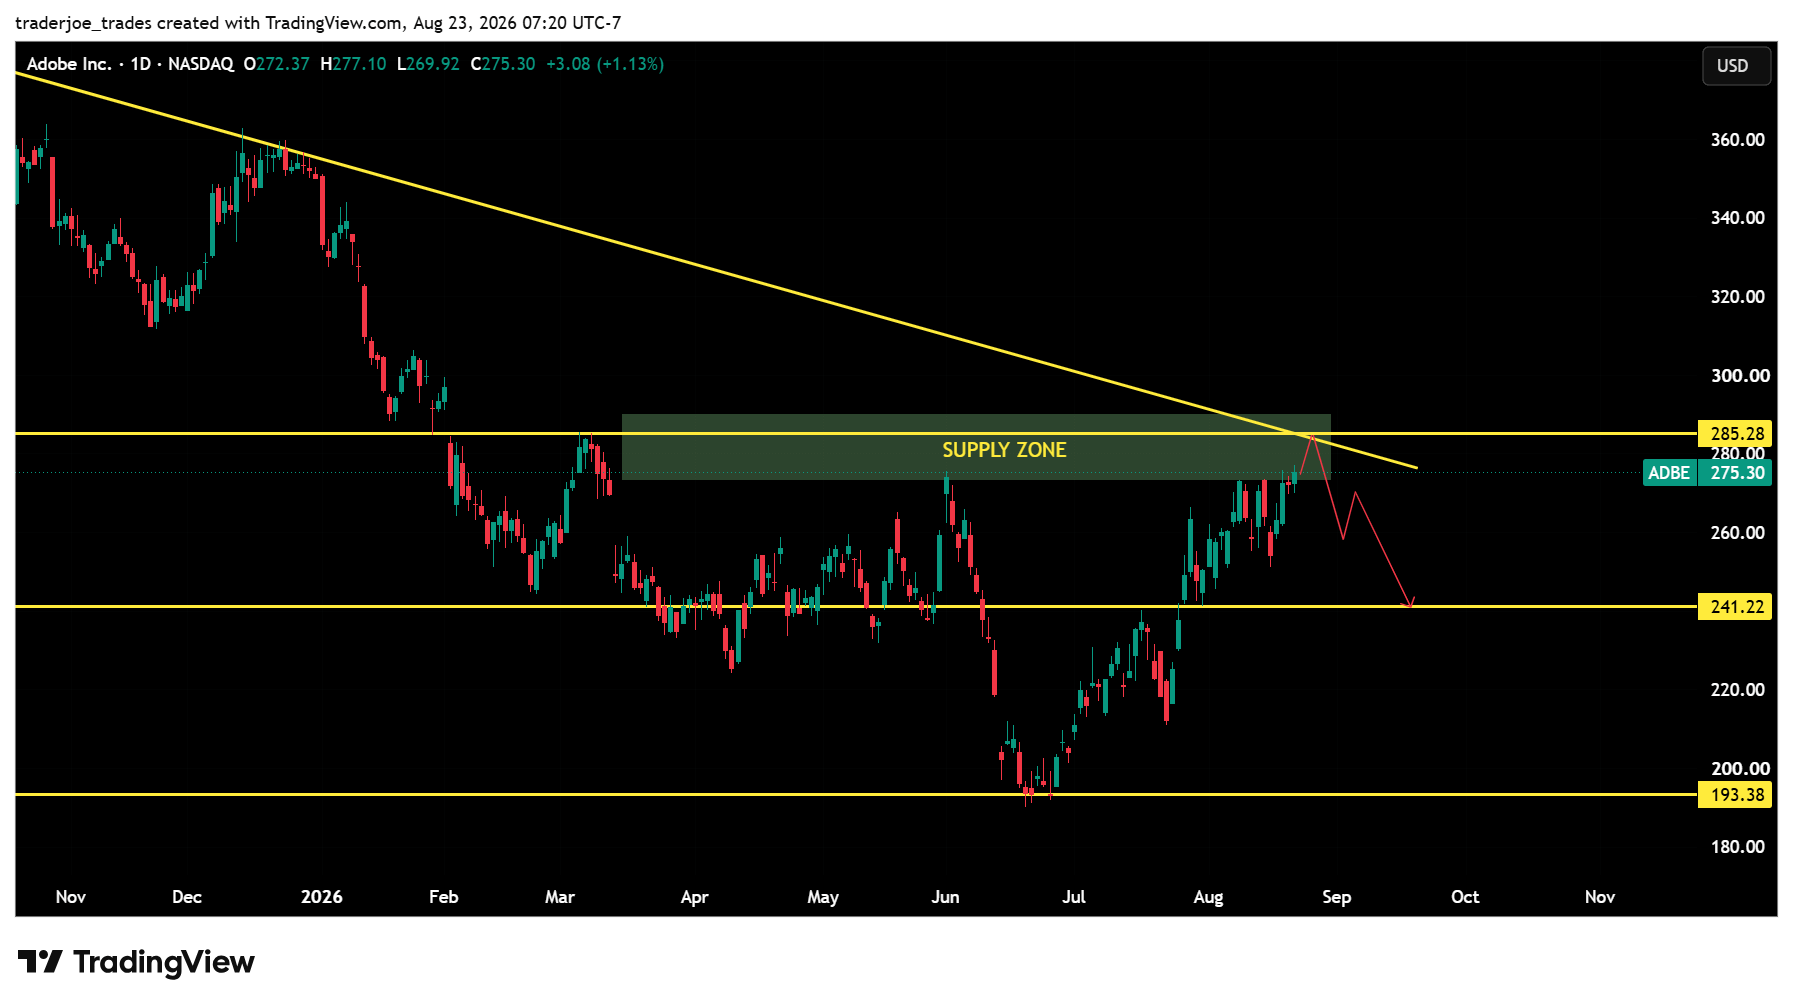
Now it's back around $275, and the chart is starting to get interesting.

First — Look at the Bigger Picture

I'm not going to pretend Adobe is suddenly in some beautiful bull market.

It's not.

The larger trend has still been down, and that long descending trendline on the chart tells the story pretty clearly.

But something has changed underneath.

ADBE hit roughly $193 and buyers showed up aggressively. Since then we've seen a pretty strong recovery back through the $241 area and into the $270s.

That $241 level matters to me.

It was an important battleground earlier in the year, and price has now reclaimed it.

So for now:

$193 = major support

$241 = important pivot

$275–290 = the real battle

And that last area is where things get fun.

ADBE Is Running Into a Wall

Look at the chart.

Price is now pushing directly into a supply zone around $275–290, while at the same time running into that long-term descending trendline.

That's some serious confluence.

This is exactly where I DON'T want to chase the stock simply because it's been green lately.

I want to see what price does here.

If ADBE can break through this supply, clear the descending trendline and actually hold above roughly $285–290, then we're no longer just talking about a bounce off the lows.

We could be looking at an actual change in market structure.

At that point, $300 becomes the obvious psychological level, followed by roughly the $320 area.

But it has to earn that first.

What If It Gets Rejected?

Wouldn't surprise me at all.

ADBE has rallied from roughly $193 to $275. That's a monster move off the bottom.

Stocks don't go straight up.

If sellers show up here, I'd watch the $260 area first, but the level I really care about is around $241.

A pullback into $241 that holds could actually be healthier than ADBE immediately ripping through $300.

Why?

Because then we'd potentially see old resistance become support.

That's the kind of price action that starts building a real base instead of another temporary rally.

If $241 completely fails, though, then I'm much less excited about the setup.

For Traders

I wouldn't overcomplicate this one.

ADBE is sitting right at a decision point.

Bull case:

Break $285–290, clear the downtrend and hold it. Then I'm watching $300 and potentially $320.

Bear case:

Reject supply and lose momentum. Then $260 comes back into play, with $241 being the bigger downside level.

This isn't where I'd blindly chase calls after a huge run.

Let the chart confirm which direction it wants.

Sometimes the best trade is waiting for the fight to finish.

For Investors

Investors should look at this differently.

Adobe isn't some random company trying to find a business model. It's still a huge software franchise with Photoshop, Illustrator, Acrobat, Premiere and the broader Creative Cloud ecosystem.

The big question isn't whether Adobe has good products.

The question is what those products are worth in an AI world.

That's what the market has been trying to price.

Generative AI created a legitimate fear that parts of Adobe's moat could shrink as image generation, video creation and design tools become easier and cheaper.

But there's another side to that argument.

Adobe doesn't necessarily have to defeat AI.

It needs to monetize AI inside the ecosystem it already owns.

That's why I'm much more interested in execution over the next several quarters than whatever the stock does next week.

If Adobe can prove that AI increases engagement, keeps Creative Cloud sticky and eventually creates additional revenue rather than destroying it, the narrative around this company could change pretty quickly.

And beaten-down stocks can move violently when the narrative finally changes.

Bottom Line

I wouldn't call the bottom.

I wouldn't call this a breakout either.

Right now ADBE is simply doing something it hasn't done in a while:

It's giving the bulls a legitimate argument again.

The recovery from $193 has been impressive. Reclaiming $241 was important.

But $275–290 is the exam.

Break it, hold it, and clear that long-term downtrend?

Now I'm paying very close attention.

Reject?

No big surprise. Let it pull back and show us whether buyers are actually willing to defend the recovery.

Investor or trader, the idea is basically the same:

Don't predict the breakout. Watch how price behaves when it gets there.

🐺 Woof Streets

We Trade. We Invest. We Win.

Possible bear scenario. NFA.

file_eKfu8r7JkfEWe