
Trading Journal — Trade Log & Performance Analytics Google Sheets Template
Log every trade with your actual risk and R-multiple
A trading journal that goes past “date, entry, exit” — this one calculates the numbers that actually tell you whether your trading is working: R-multiple, expectancy, profit factor, and a real equity curve, all from a single log.
What’s inside:
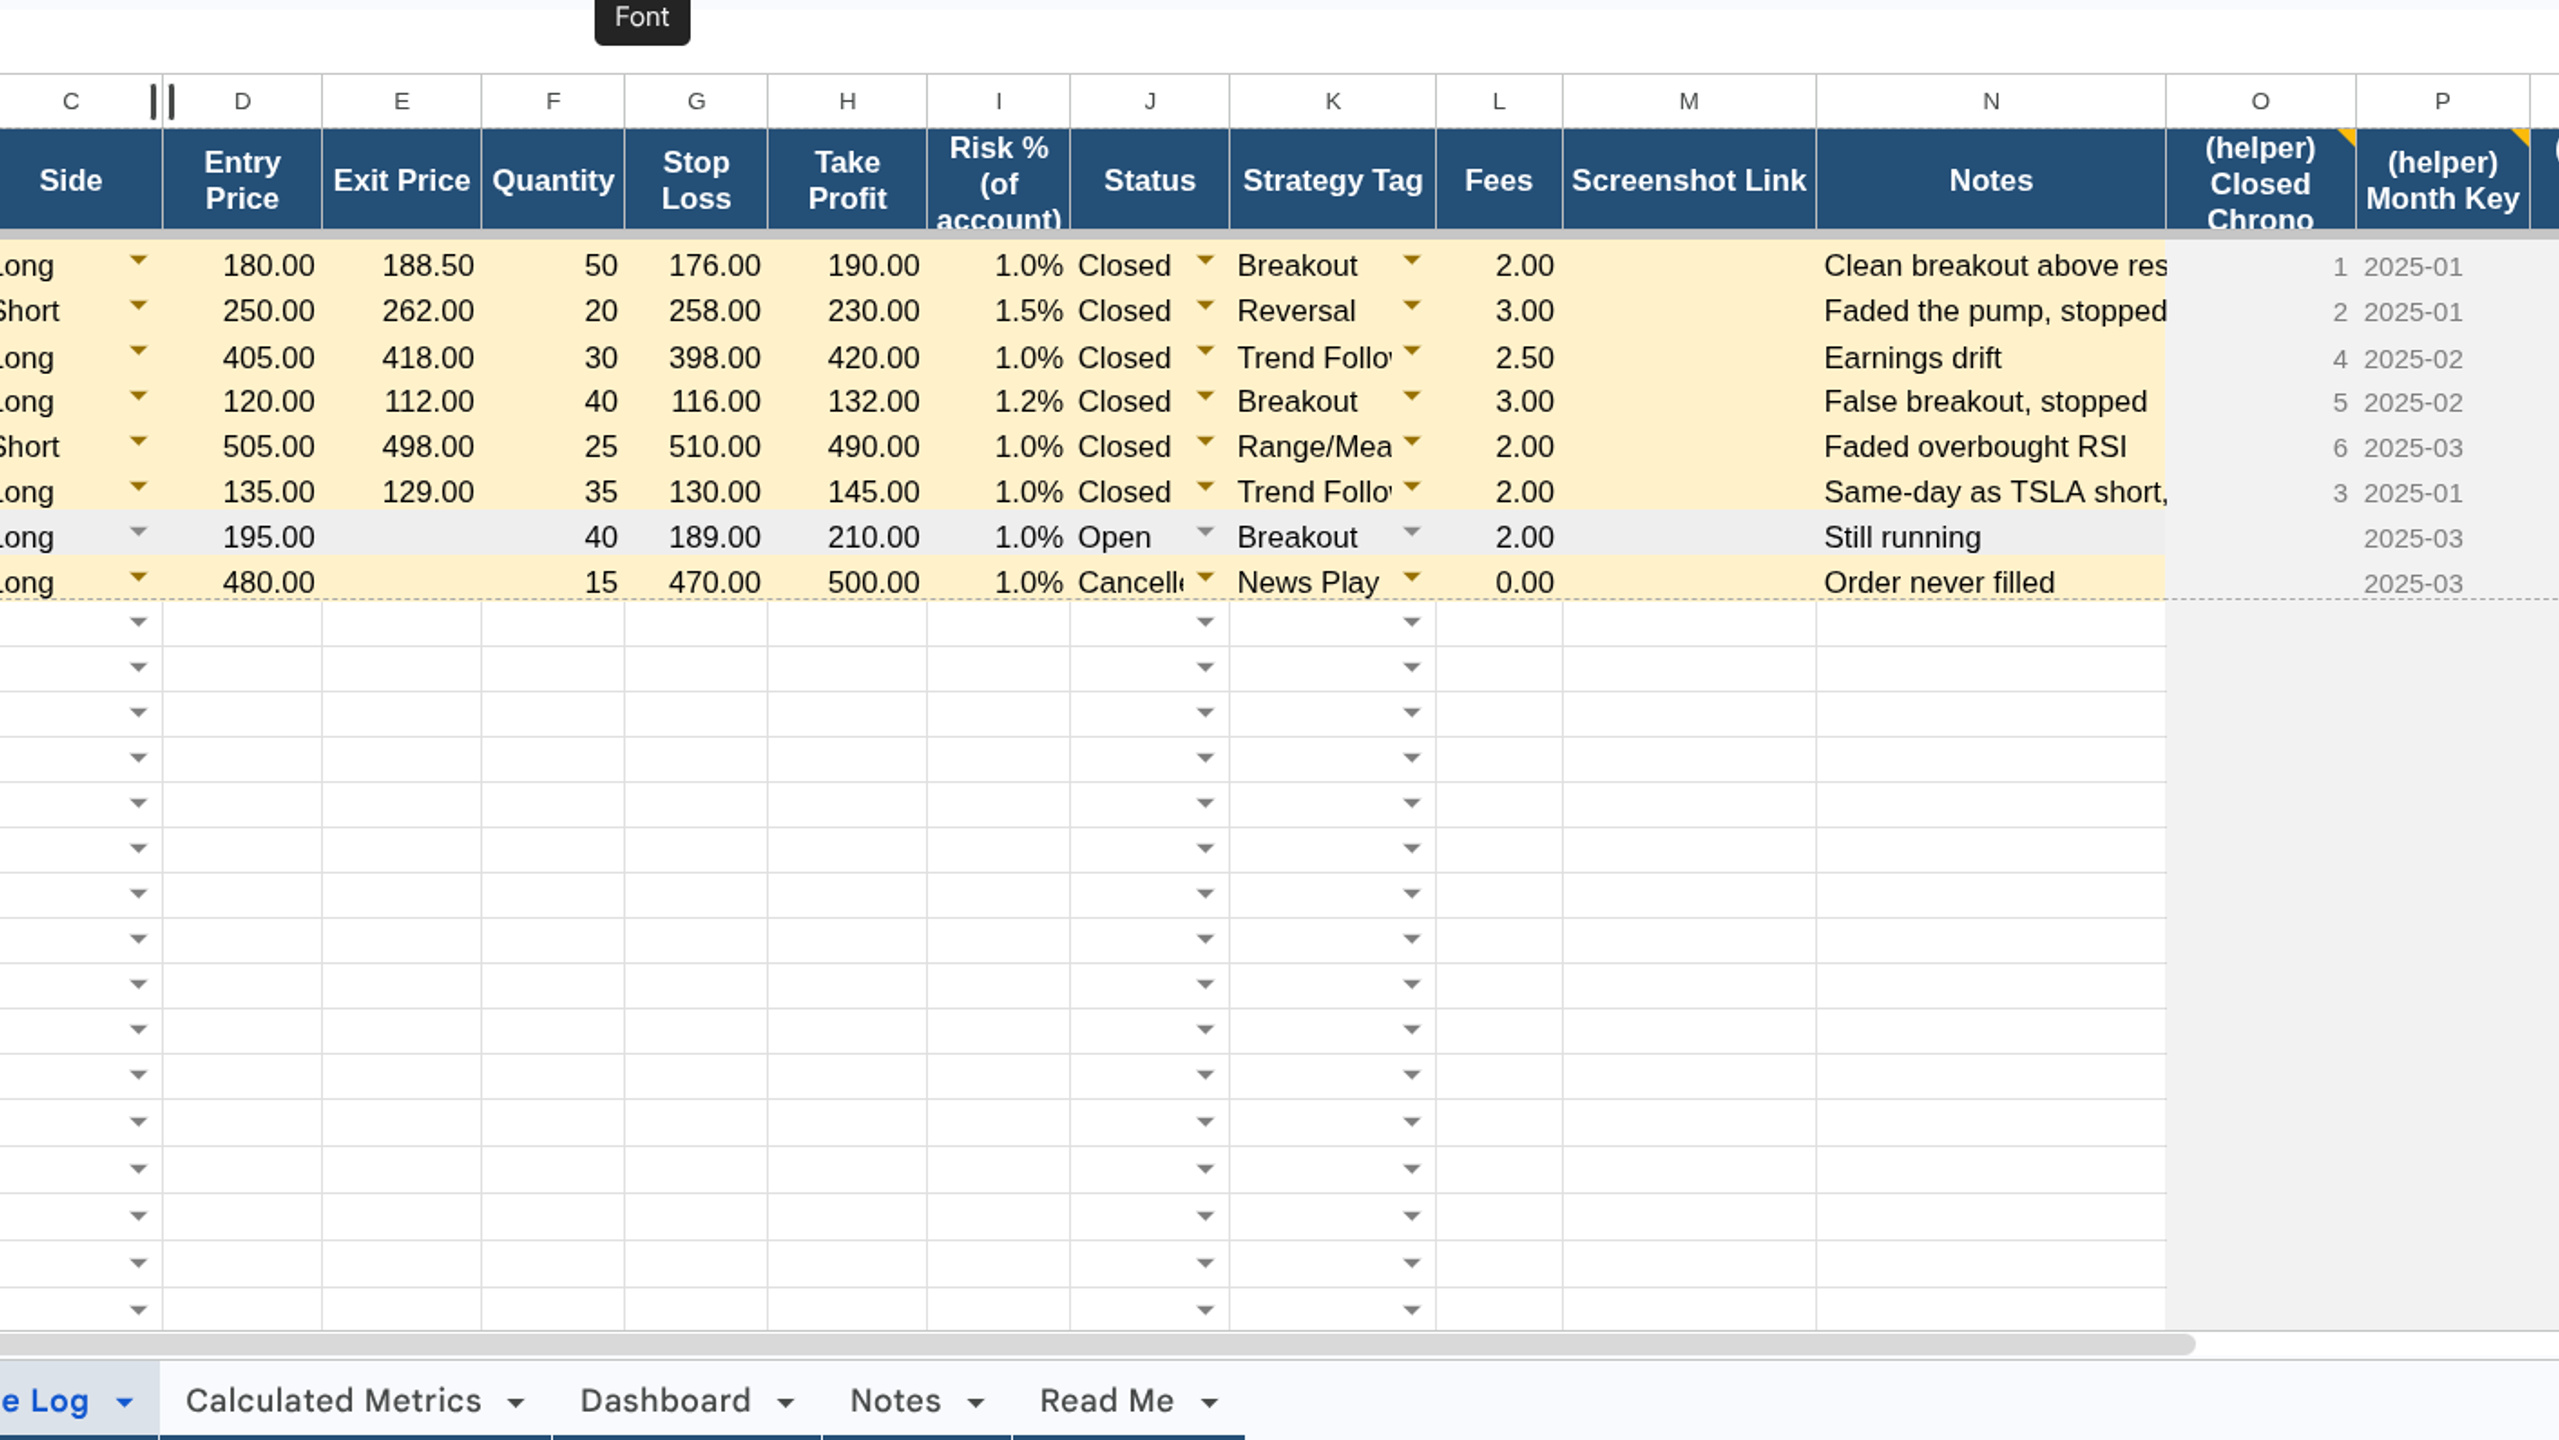
Trade Log tab — date, asset, side, entry/exit, quantity, stop loss, take profit, risk %, status, strategy tag, fees, a screenshot link field, and notes — dropdowns throughout, color-coded rows for wins/losses/open trades
Calculated Metrics — realized P&L and R-multiple computed automatically for every trade the moment you mark it closed
Dashboard — win rate, profit factor, expectancy (average R), average win/loss in both $ and R, current equity, total return %, best and worst trade, plus an auto-built equity curve chart
Trade frequency breakdowns — by month and by asset, so you can actually see patterns in what and how often you trade
Notes tab — a separate space for market observations and trading psychology reflections, independent of any single trade
Strategy tag system — editable list, so you can track performance by strategy over time
Full Read Me tab, including a plain-English explanation of R-multiple and profit factor for anyone newer to these metrics