

販売価格 シナリオ比較マトリクス / Selling Price Scenario Comparison Matrix
原価上昇や新商品の値付け、値上げ・値下げの検討に。小さな事業向けのExcel「販売価格 シナリオ比較マトリクス」です。
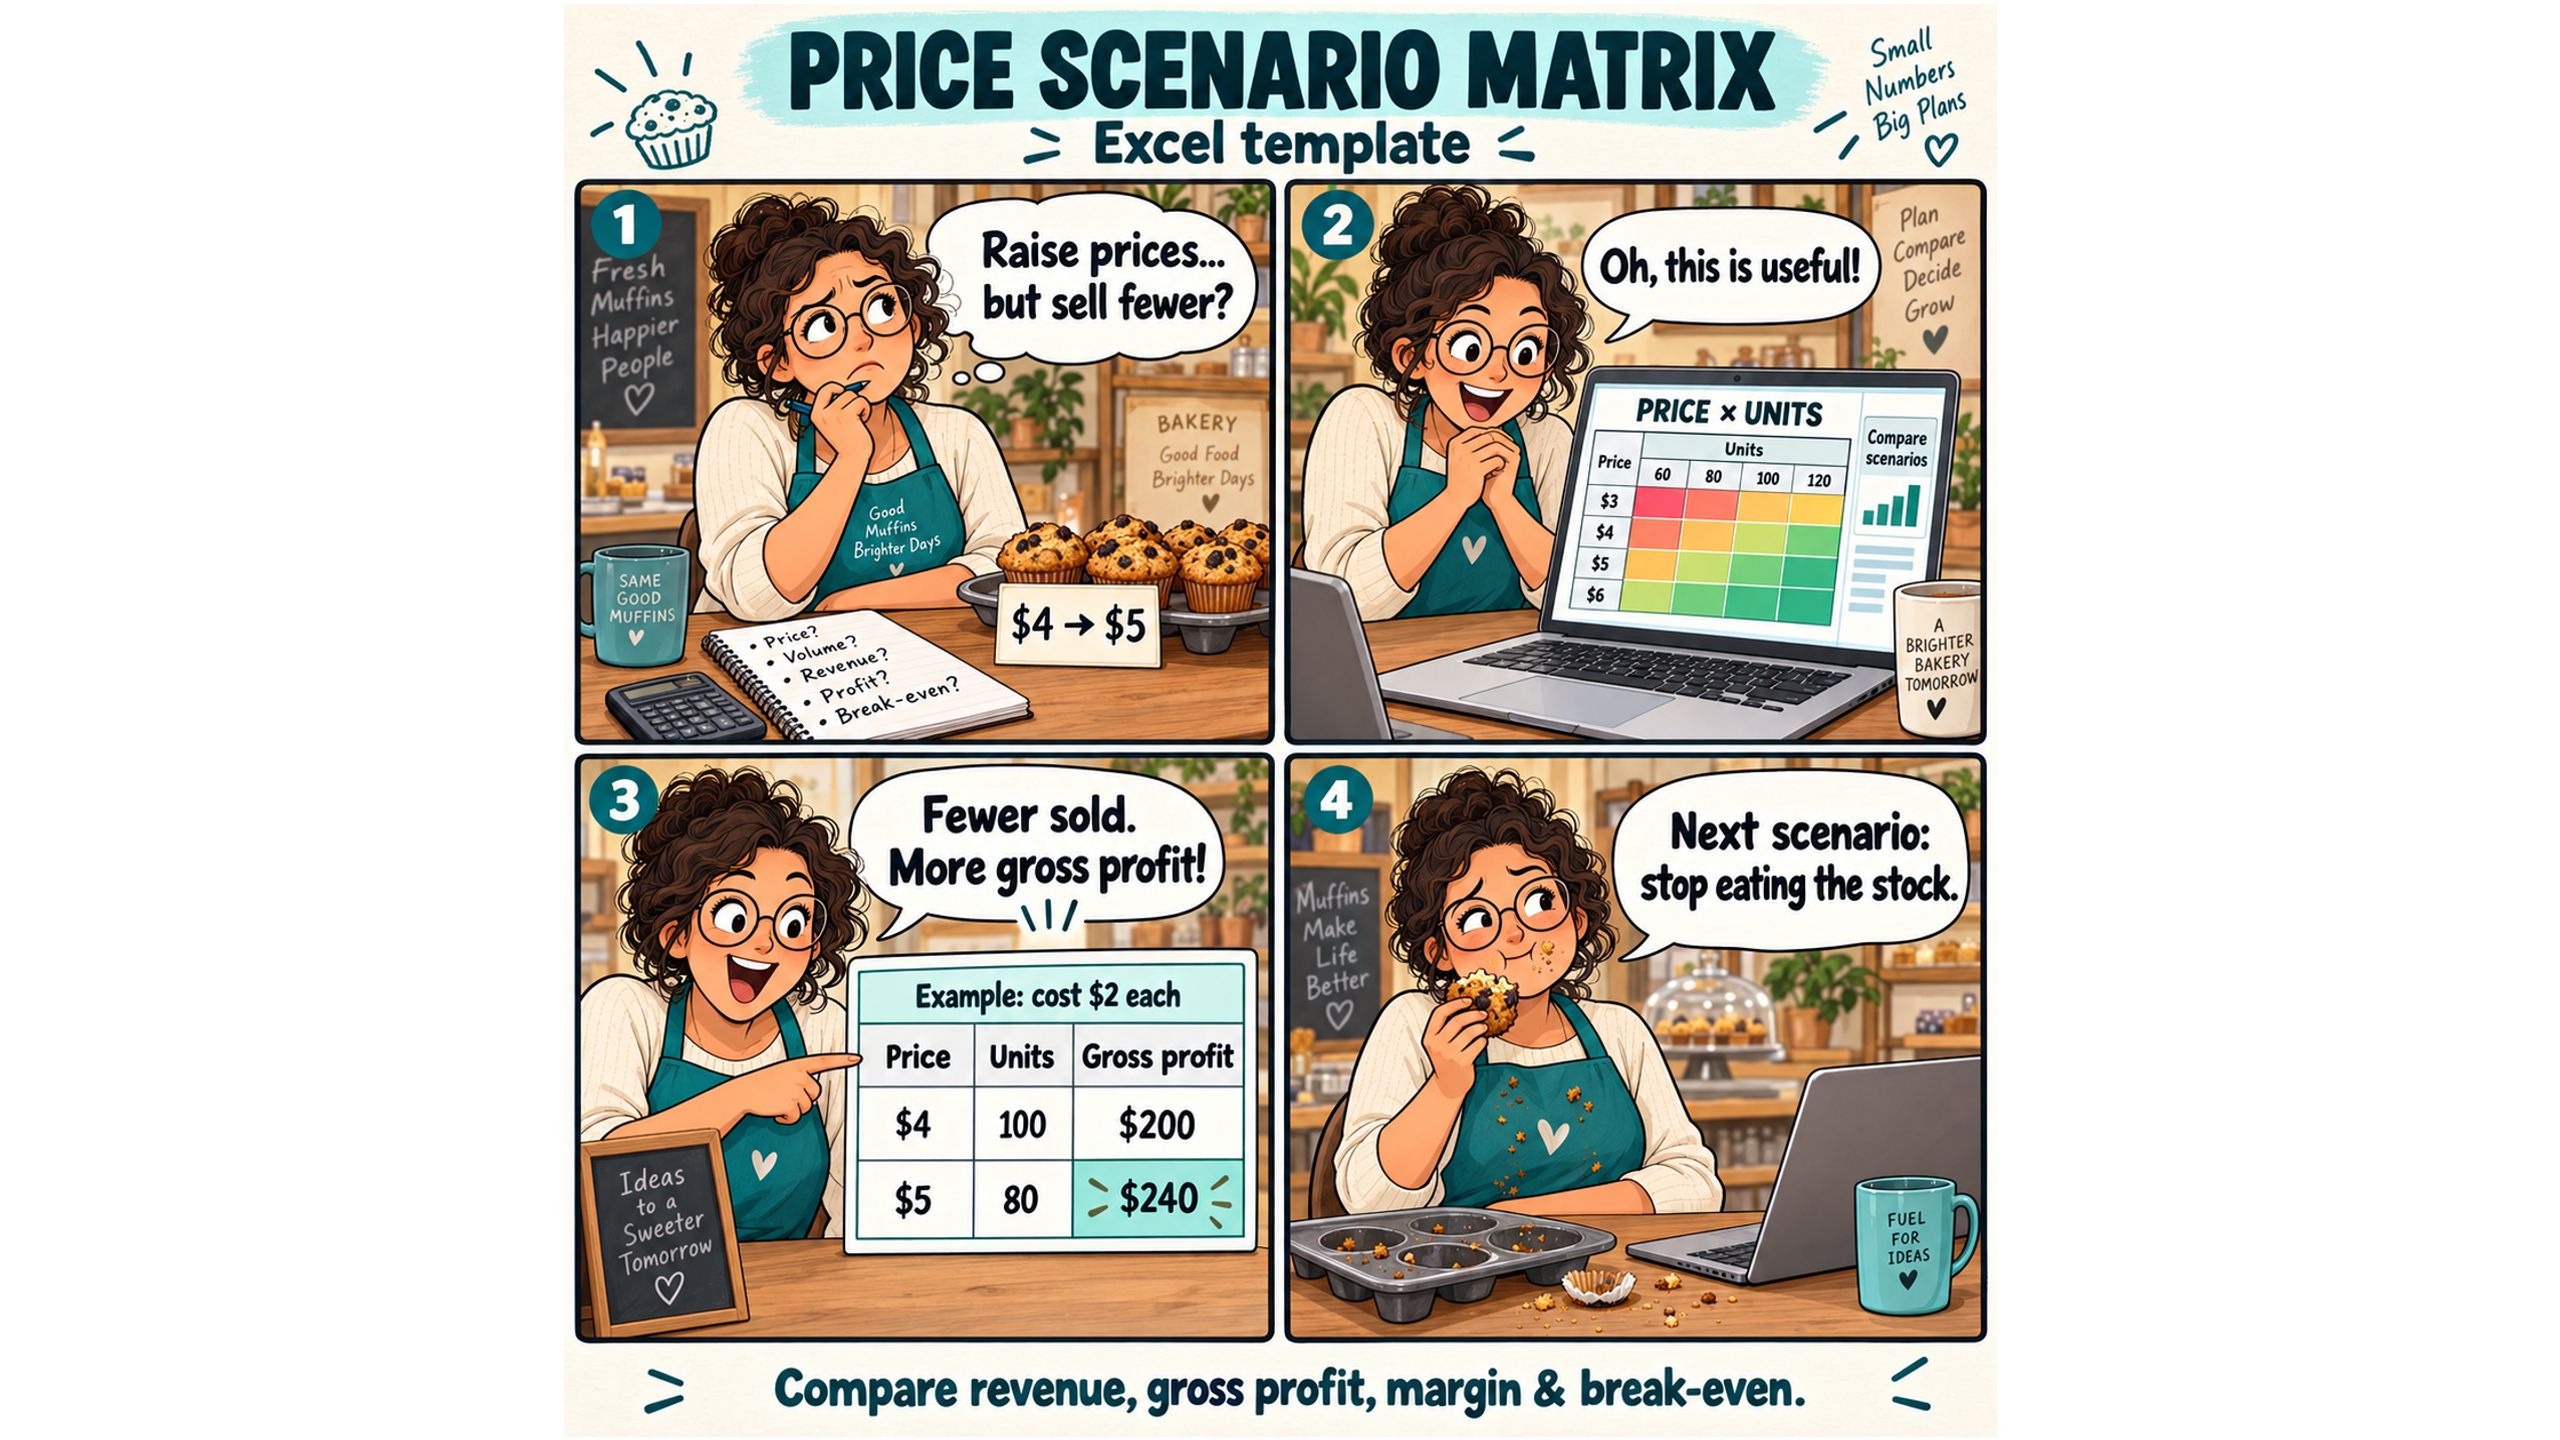
原価、現在の価格、候補価格、想定販売数量を整理し、現状維持や値上げで数量が減る場合などの売上・粗利・利益率・損益分岐を比較できます。価格×数量の表で粗利と損益分岐を色分けし、各価格で必要な販売数や、値下げを補う数量を確認できます。
新商品や既存商品の価格判断にお役立てください。数値は入力した前提に基づく参考値です。お客様の反応や日々の売れ行きとあわせてご検討ください。
マクロなしのExcel(.xlsx)。Excel 2019/2021/2024/Microsoft 365対応。
お仕事の依頼:ramaya08010801@gmail.com
Explore launch prices or price changes with the Sales Price Scenario Comparison Matrix, an Excel workbook for small business owners.
Compare costs, current and candidate prices, and expected sales quantities to review revenue, gross profit, profit margin, and break-even figures side by side. A color-coded price-by-quantity matrix shows gross profit and break-even results, helping you assess scenarios such as keeping your price, raising it with fewer sales, or lowering it with more sales. See the volume each option needs to cover costs and understand the trade-offs.
Use it for new or existing products. Figures are estimates based on your assumptions to support your judgment.
Macro-free .xlsx for Excel 2019, 2021, 2024, and Microsoft 365.
Work inquiries or collaborations: ramaya08010801@gmail.com