Bubble Score Daily

See when markets look overheated — before risk becomes obvious. Every day you get a Bubble Score for AMZN, BTC, EUR/USD, Gold, and the S&P...
Warsaw, PL
Created byProfile pictureJakub
4 joined
Profile picture
JakubProfile picture@kolojp·Jun 18

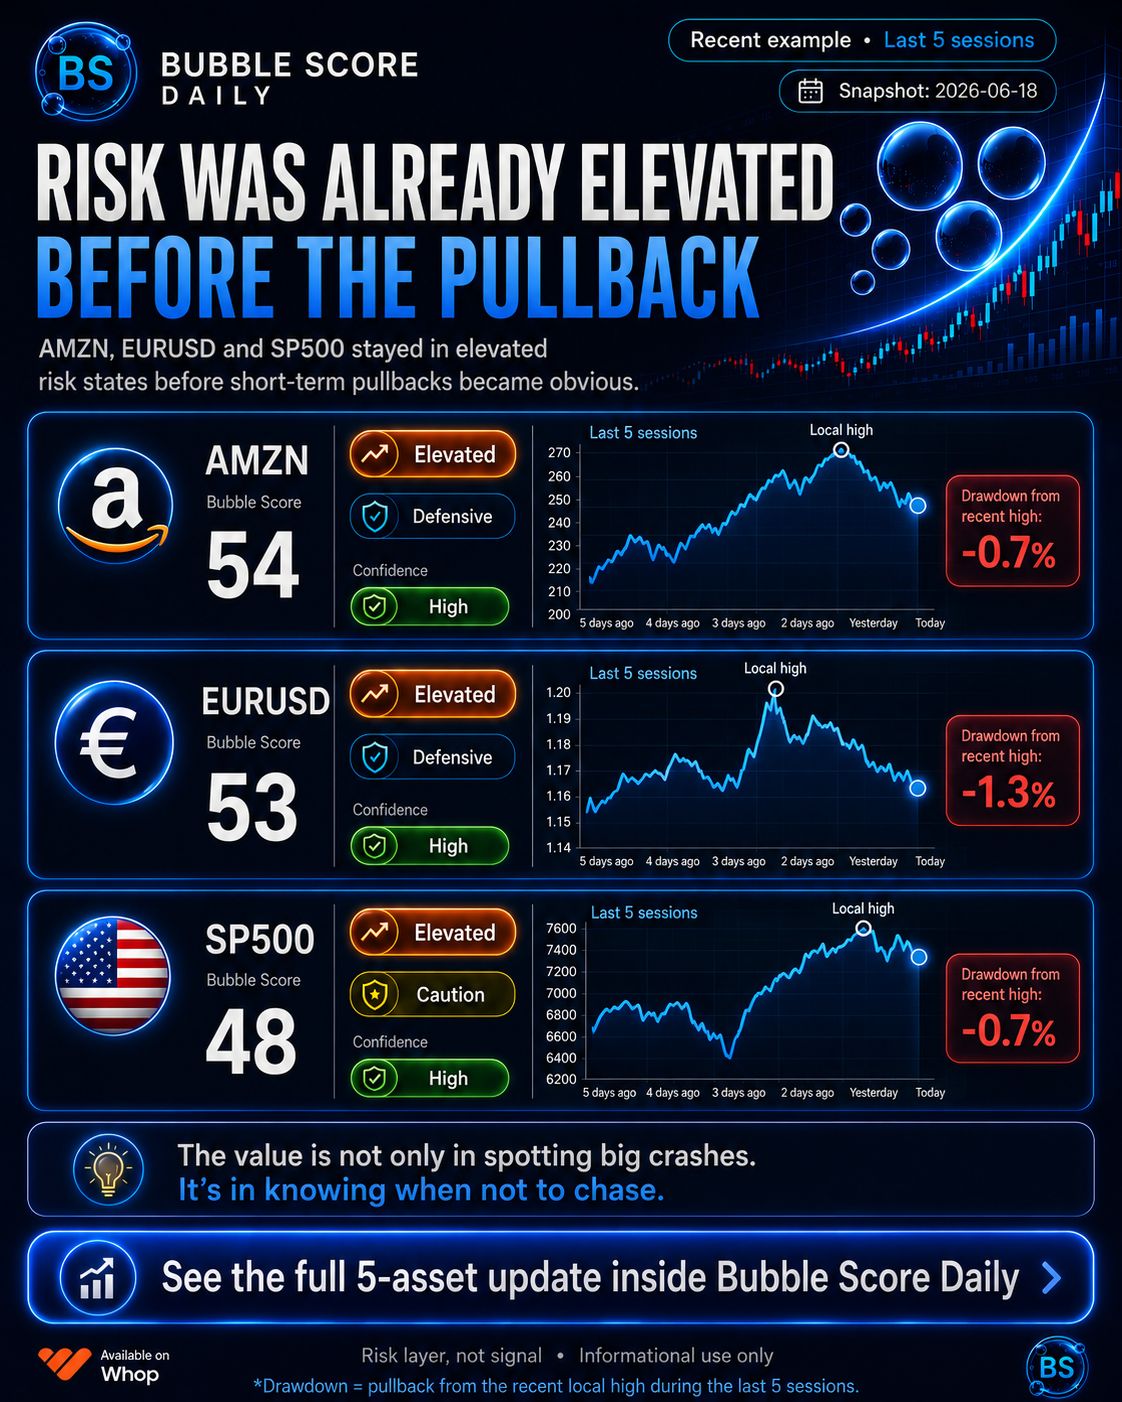
Risk is useful before the chart makes it obvious.

Over the last 5 sessions, AMZN, EURUSD and SP500 stayed in elevated risk states before short-term pullbacks became clear.

This is exactly where Bubble Score Daily is designed to help:

not to predict every top,
not to call every crash,
but to show when conditions are no longer calm — and when chasing late moves becomes harder to justify.

The value is not only in spotting big crashes.

It’s in knowing when not to chase.
file_PoLCHdzQDiuPV
Profile picture
JakubProfile picture@kolojp·Jun 12

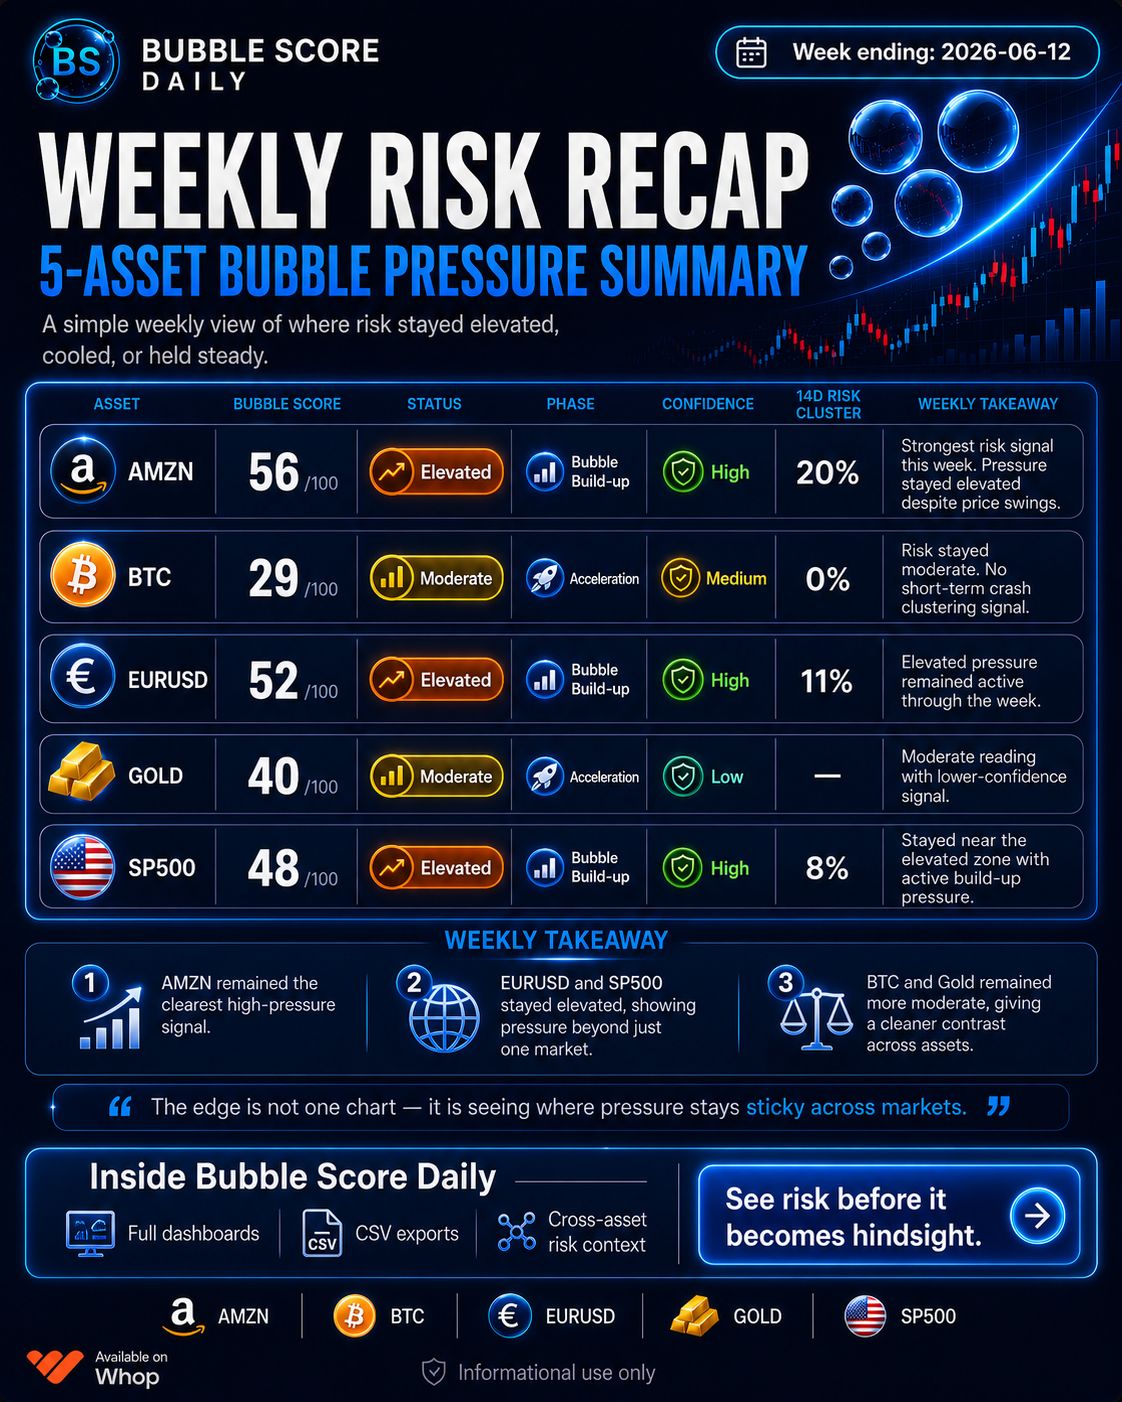
Weekly Bubble Score recap is live.

Most market posts focus on one chart.

Bubble Score Daily looks at something different:

where market pressure may be building across multiple assets at the same time.

This weekly recap compares BTC, AMZN, EUR/USD, Gold, and S&P 500 in one risk board.

Simple idea:

Bubble Score acts like a pressure gauge for markets — when pressure stays elevated, it can warn that a market is becoming more fragile and more vulnerable to sharper drawdowns.

Higher score = more bubble-like pressure and a more fragile market structure.

This week, AMZN remained the clearest high-pressure signal, while EUR/USD and S&P 500 also stayed elevated. BTC and Gold were more moderate.

That contrast is the value.

It helps you see where risk is concentrated — and where it is not.

Full dashboards, CSV exports, history, and cross-asset risk context are inside Bubble Score Daily.

file_TCDy3fH0zSiRj
Profile picture
Jakub@kolojp·Jun 12

Want the full context behind this weekly risk board?

I explained the Bubble Score Daily concept, the LPPL model layer, and the practical 5-asset dashboard here:

The short version:

Bubble Score is a pressure gauge for market fragility — the article shows how I use it in practice.

Profile picture
JakubProfile picture@kolojp·Jun 11

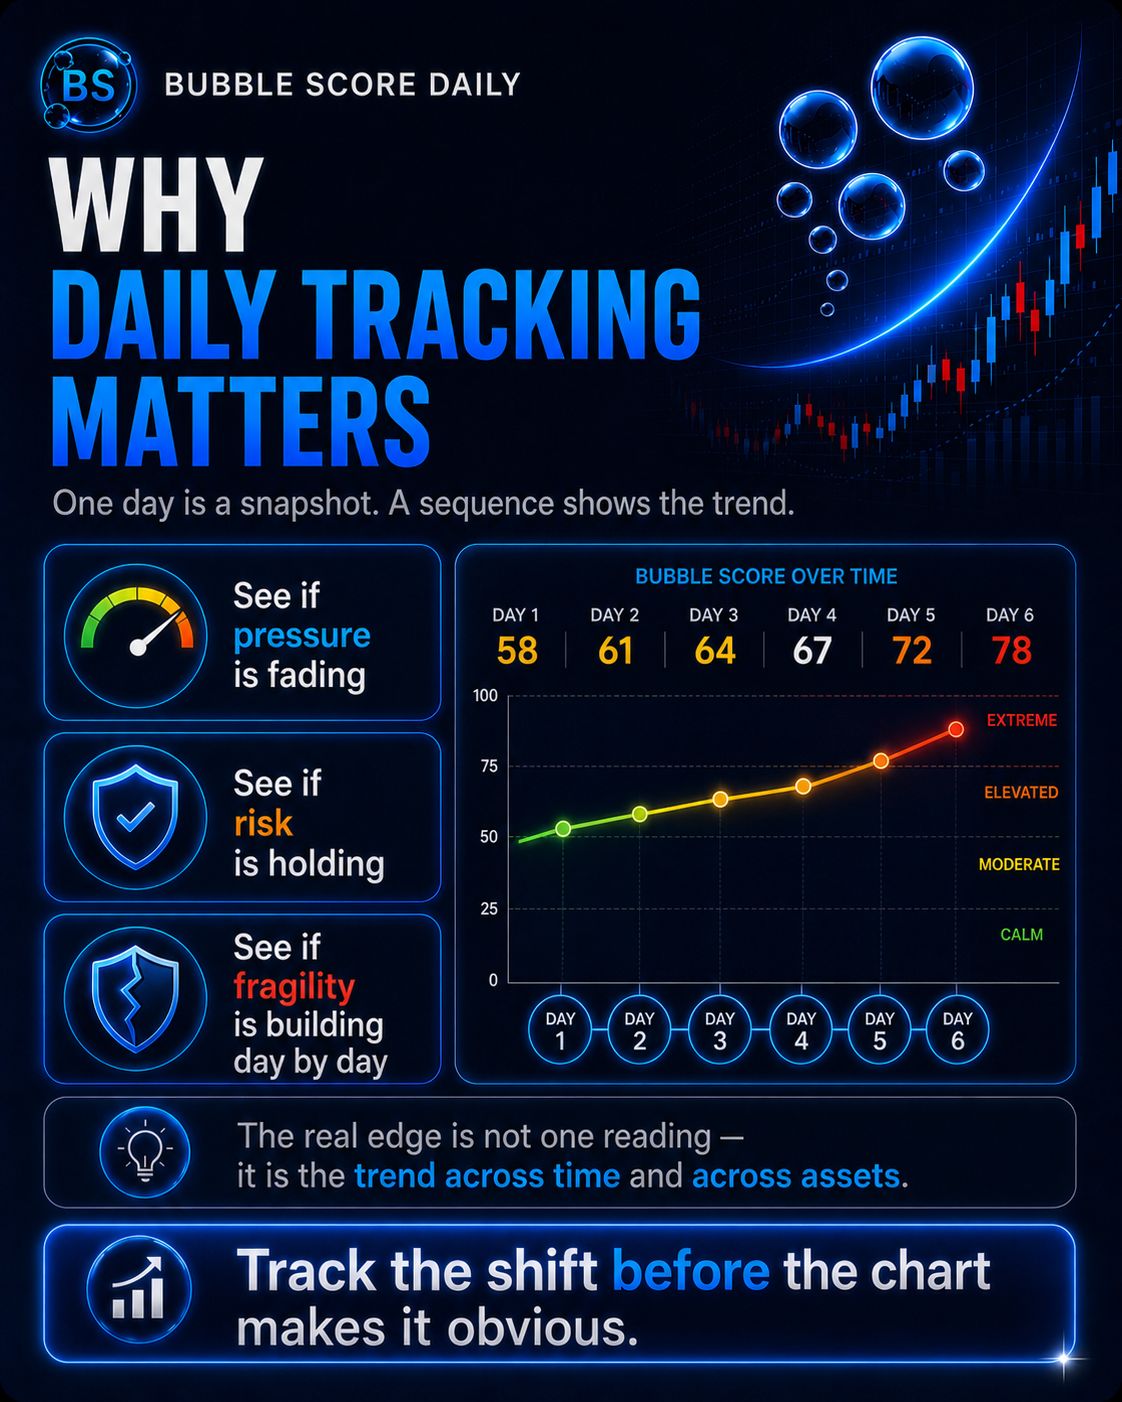
One reading is only a snapshot. The sequence is where the value is.

Daily tracking shows whether bubble pressure is fading, holding, or building day by day.

That matters because risk usually does not appear all at once.

It builds gradually — then the chart catches up.

Track the shift before it becomes obvious.

file_tSvg40xZBfVkK
Profile picture
Jakub@kolojp·Jun 11

I published a public creator-pack where I explain more about the Bubble Score Daily concept, the model behind it, and how the dashboard can be used in practice:

It shows how I think about market fragility, bubble pressure, and the current 5-asset setup in a simple, practical way.

Risk layer, not signal.

Profile picture
JakubProfile picture@kolojp·Jun 10

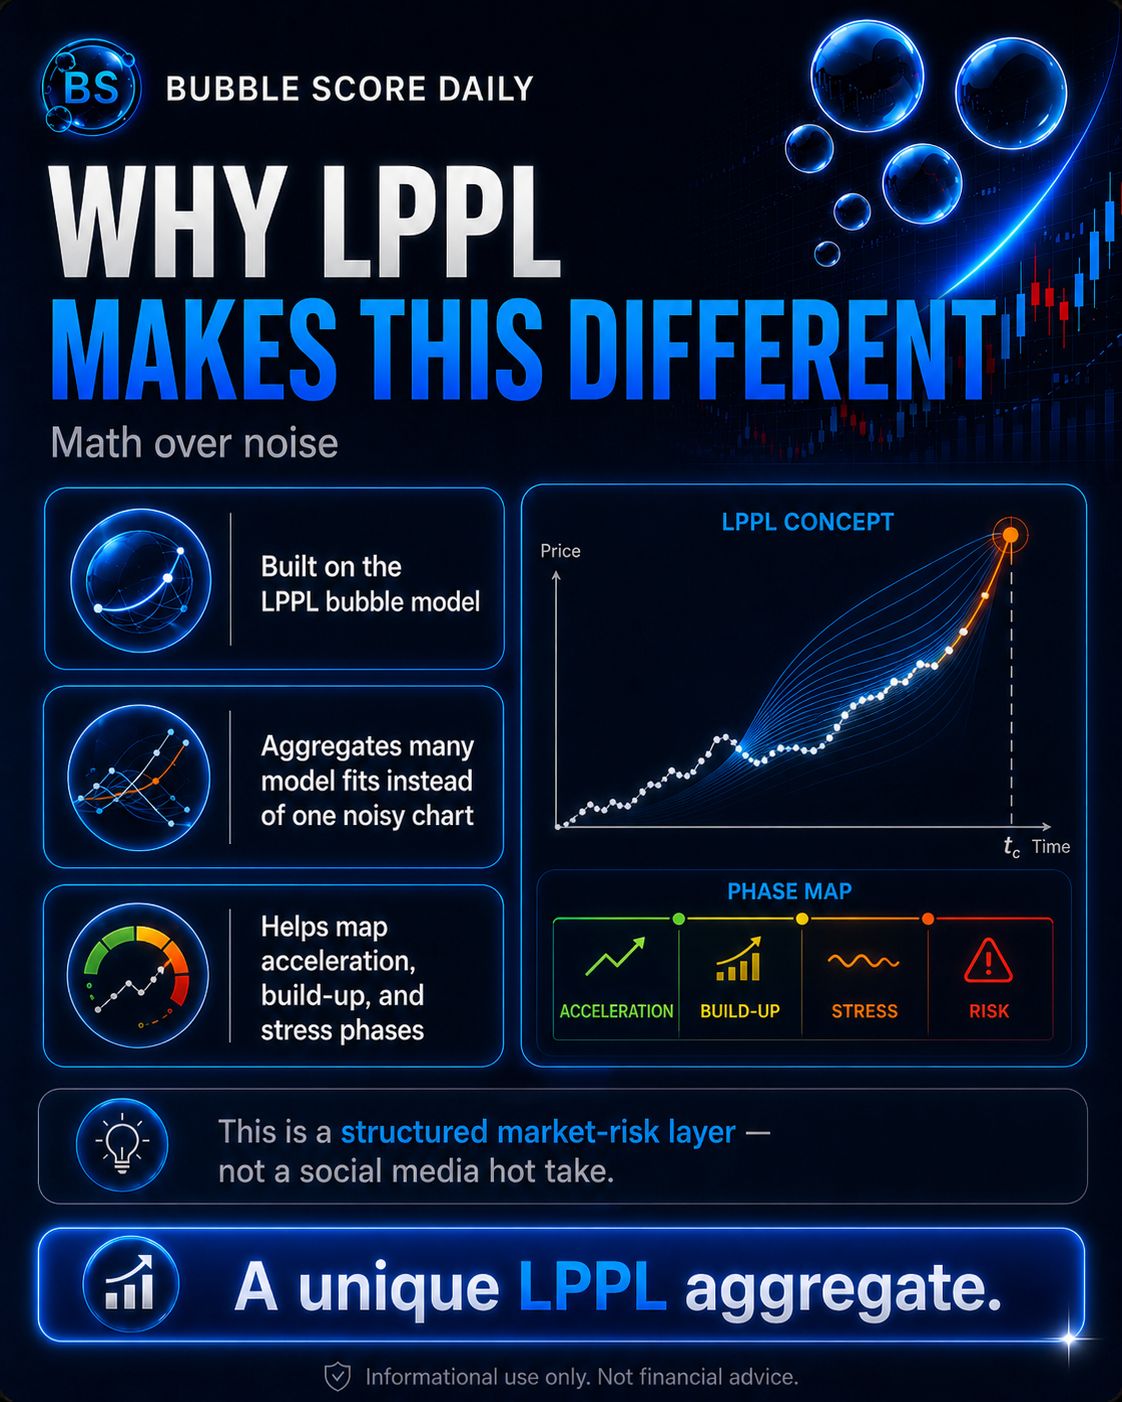
Why is Bubble Score Daily different?

It is built on LPPL bubble modelling — not random chart opinions.

Instead of looking at one noisy chart, it aggregates many model fits into a cleaner risk layer.

The goal is simple:

map acceleration, build-up, and stress phases before the market move becomes obvious.

Math over noise.

file_sLMuD52G3z6og
Profile picture
Jakub@kolojp·Jun 10

I published a public creator-pack where I explain more about the Bubble Score Daily concept, the model behind it, and how the dashboard can be used in practice:

It shows how I think about market fragility, bubble pressure, and the current 5-asset setup in a simple, practical way.

Risk layer, not signal.

Profile picture
JakubProfile picture@kolojp·Jun 9

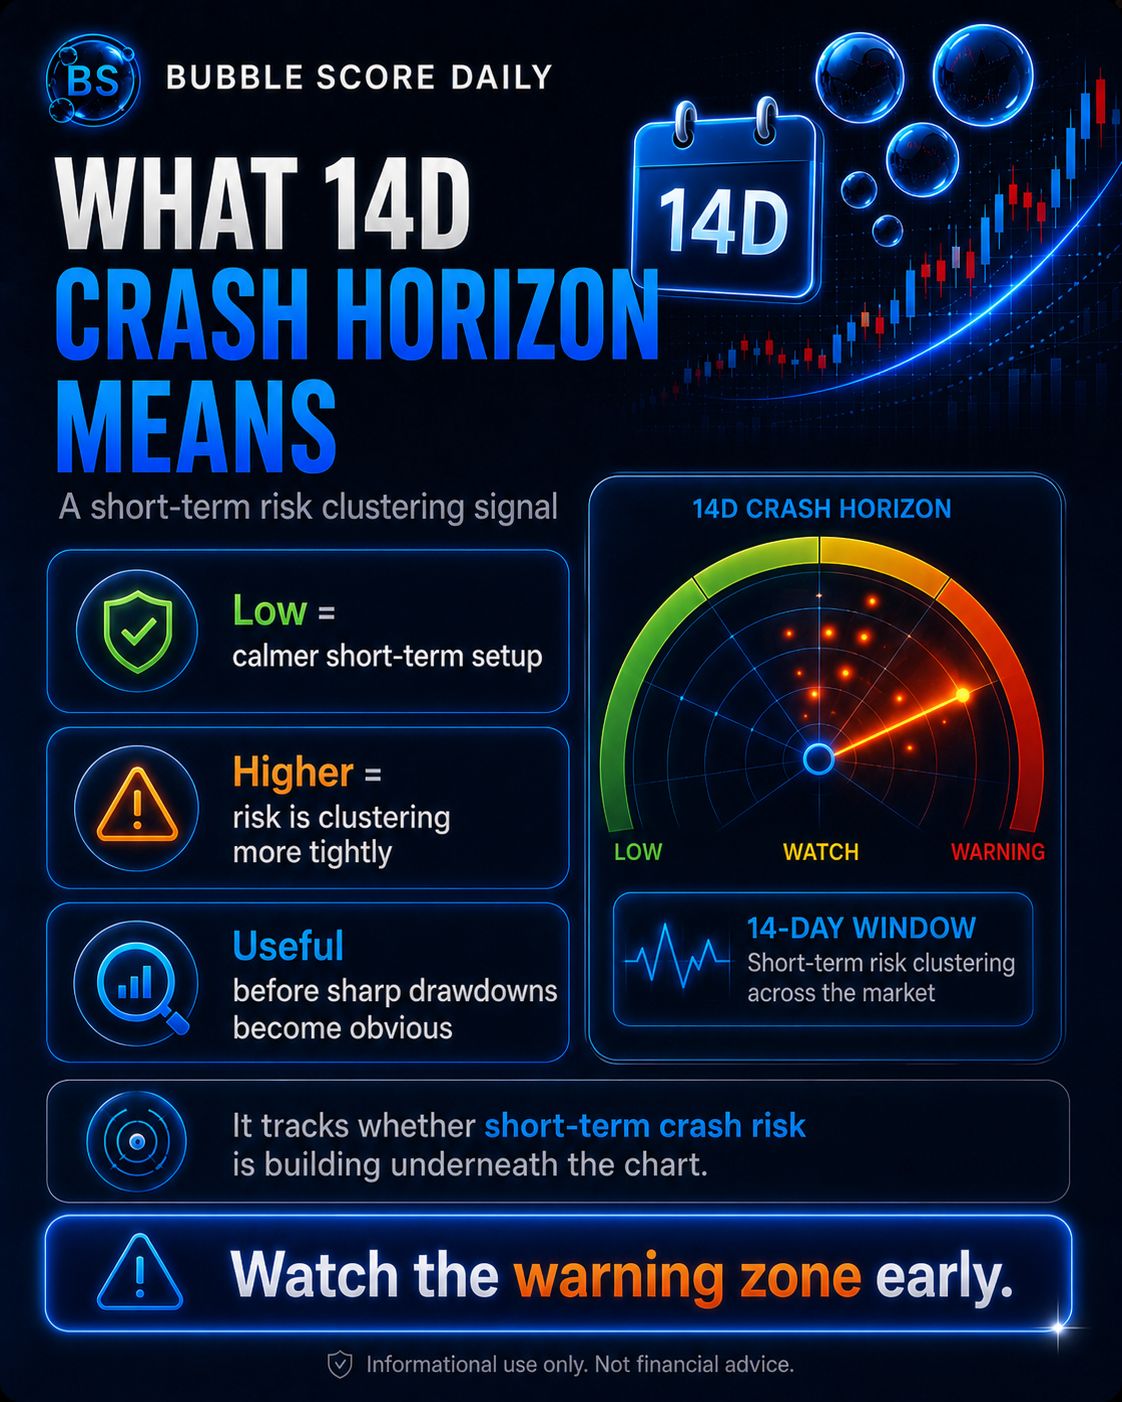
What does 14D Crash Horizon mean?

It tracks whether short-term crash-risk signals are clustering around the 14-day window.

Low = calmer setup. Higher = warning zone.

This matters because sharp drawdowns often do not look obvious until the move is already happening.

Watch the warning zone early.

file_RtcepIskG5cMf
Profile picture
JakubProfile picture@kolojp·Jun 8

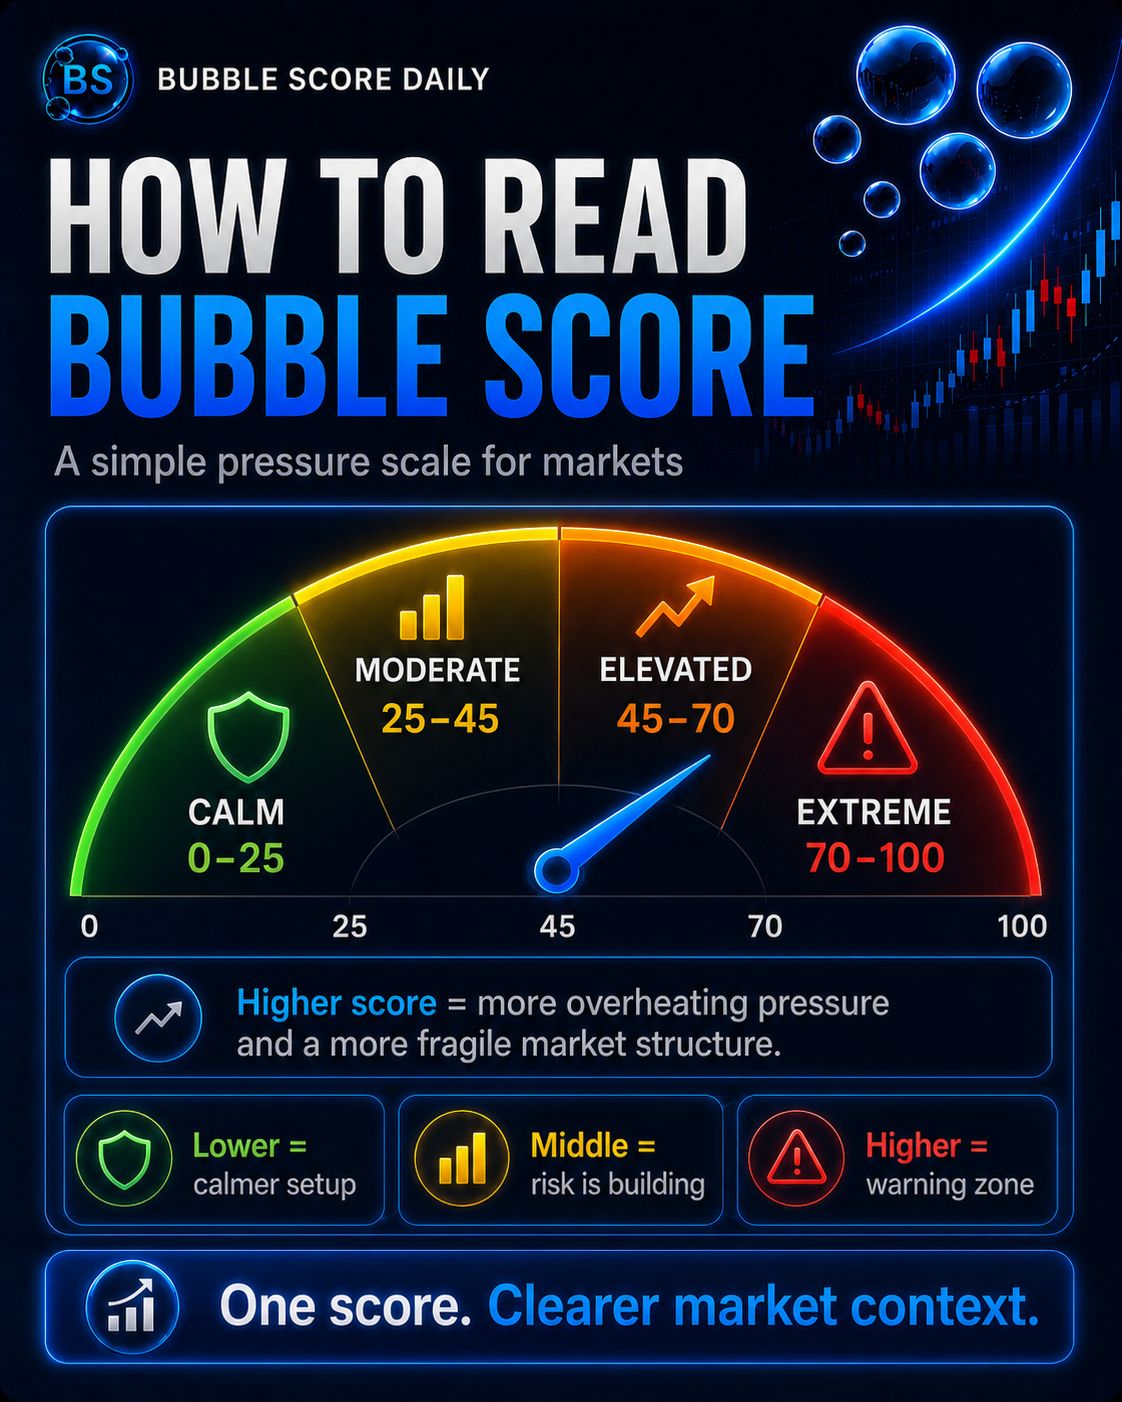
How to read Bubble Score:

0–25: Calm 25–45: Moderate 45–70: Elevated 70–100: Extreme

The higher the score, the more overheating pressure the model detects.

One number gives a cleaner market context across BTC, AMZN, EUR/USD, Gold, and S&P 500.

file_nfOtwZumZfOFF
Profile picture
JakubProfile picture@kolojp·Jun 7

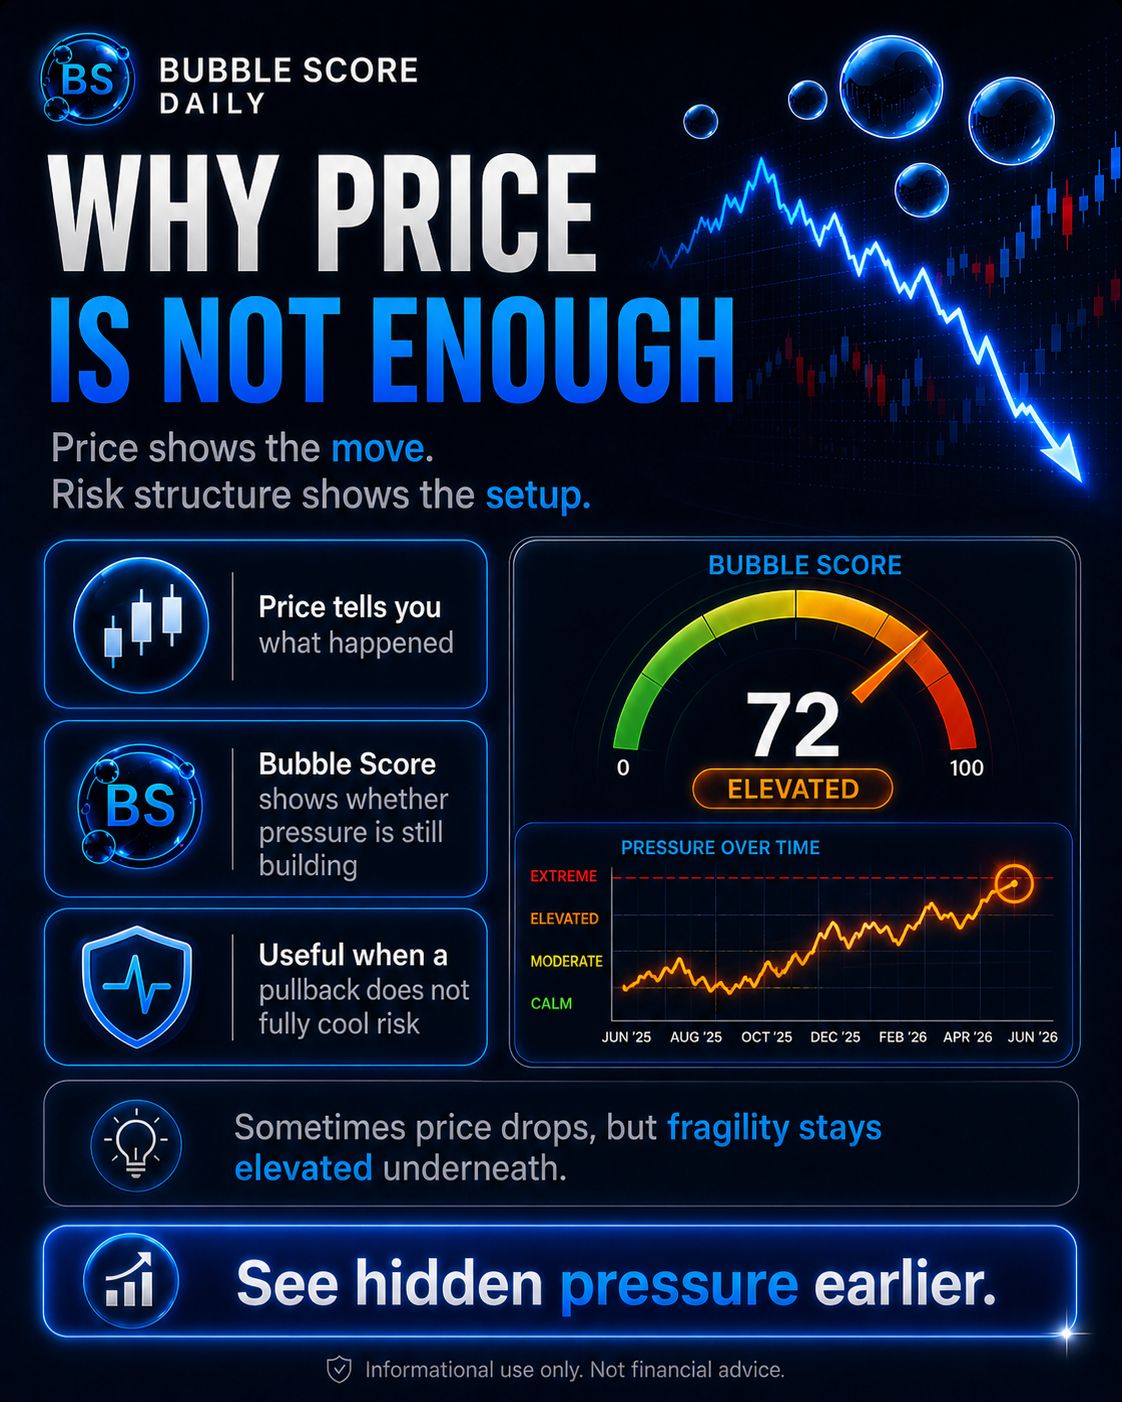
Price shows the move. Bubble Score shows the setup.

Sometimes price drops, but market fragility does not fully disappear.

That is why price alone is not enough.

Bubble Score Daily helps track whether hidden pressure is fading, holding, or still building underneath the chart.

See hidden pressure earlier.

file_z6rTDMvfrW4Vs
Profile picture
Jakub@kolojp·Jun 7

I published a public creator-pack showing how the dashboard works in the current macro environment:

Risk layer, not signal.

Profile picture
JakubProfile picture@kolojp·Jun 6

Hi everyone - quick weekend share:

I published a public research note on how strong U.S. data can still pressure stocks - and how I use Bubble Score Daily as a 5-asset risk layer across AMZN, BTC, EUR/USD, Gold and S&P 500.

The goal is not to predict crashes or give buy/sell signals.

It is to track where market fragility and overheating pressure may already be building before the next macro trigger arrives.

Full article here:

Would be interested in feedback from anyone who follows macro, trading, or market-risk research.

The 5-asset graphic is a sample view from Bubble Score Daily. Full dashboards, daily updates and asset-level details are available inside the subscriber product on my Whop profile.

file_nHPCpjRVIqUXt
Profile picture
JakubProfile picture@kolojp·Jun 6

Weekend read:

Strong U.S. data can still be bearish for stocks.

Why?

Because if the economy looks too strong, markets may price in higher rates for longer.

That is why I track not only the macro headline, but also which assets were already structurally fragile before the trigger arrived.

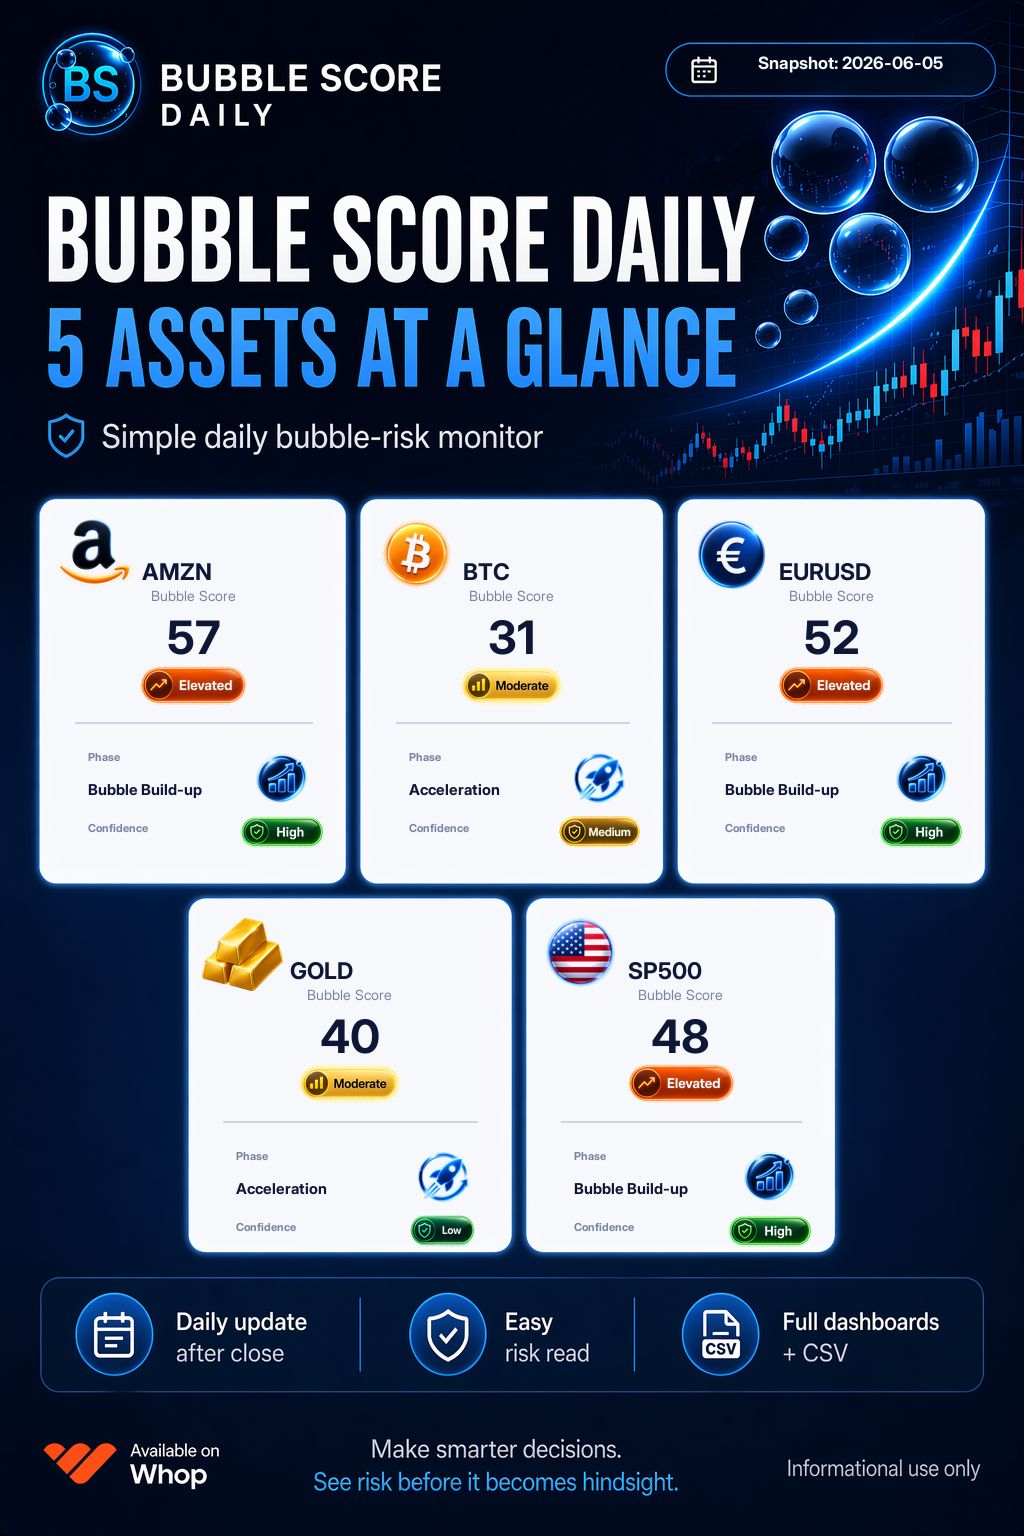
Latest Bubble Score Daily map:

AMZN: 57 / Elevated
BTC: 31 / Moderate
EUR/USD: 52 / Elevated
Gold: 40 / Moderate
S&P 500: 48 / Elevated

The strongest current signal is AMZN.

Not a buy/sell signal.
Not a crash prediction.
A daily risk layer.

Full article here:

file_ypQOhI6eZY8Tl
Profile picture
Jakub@kolojp·Jun 6

Quick clarification:

This is not meant as a market call or a trading signal.

The goal is to show how a simple 5-asset risk layer can help separate normal volatility from situations where overheating pressure may already be building.

Profile picture
JakubProfile picture@kolojp·Jun 5

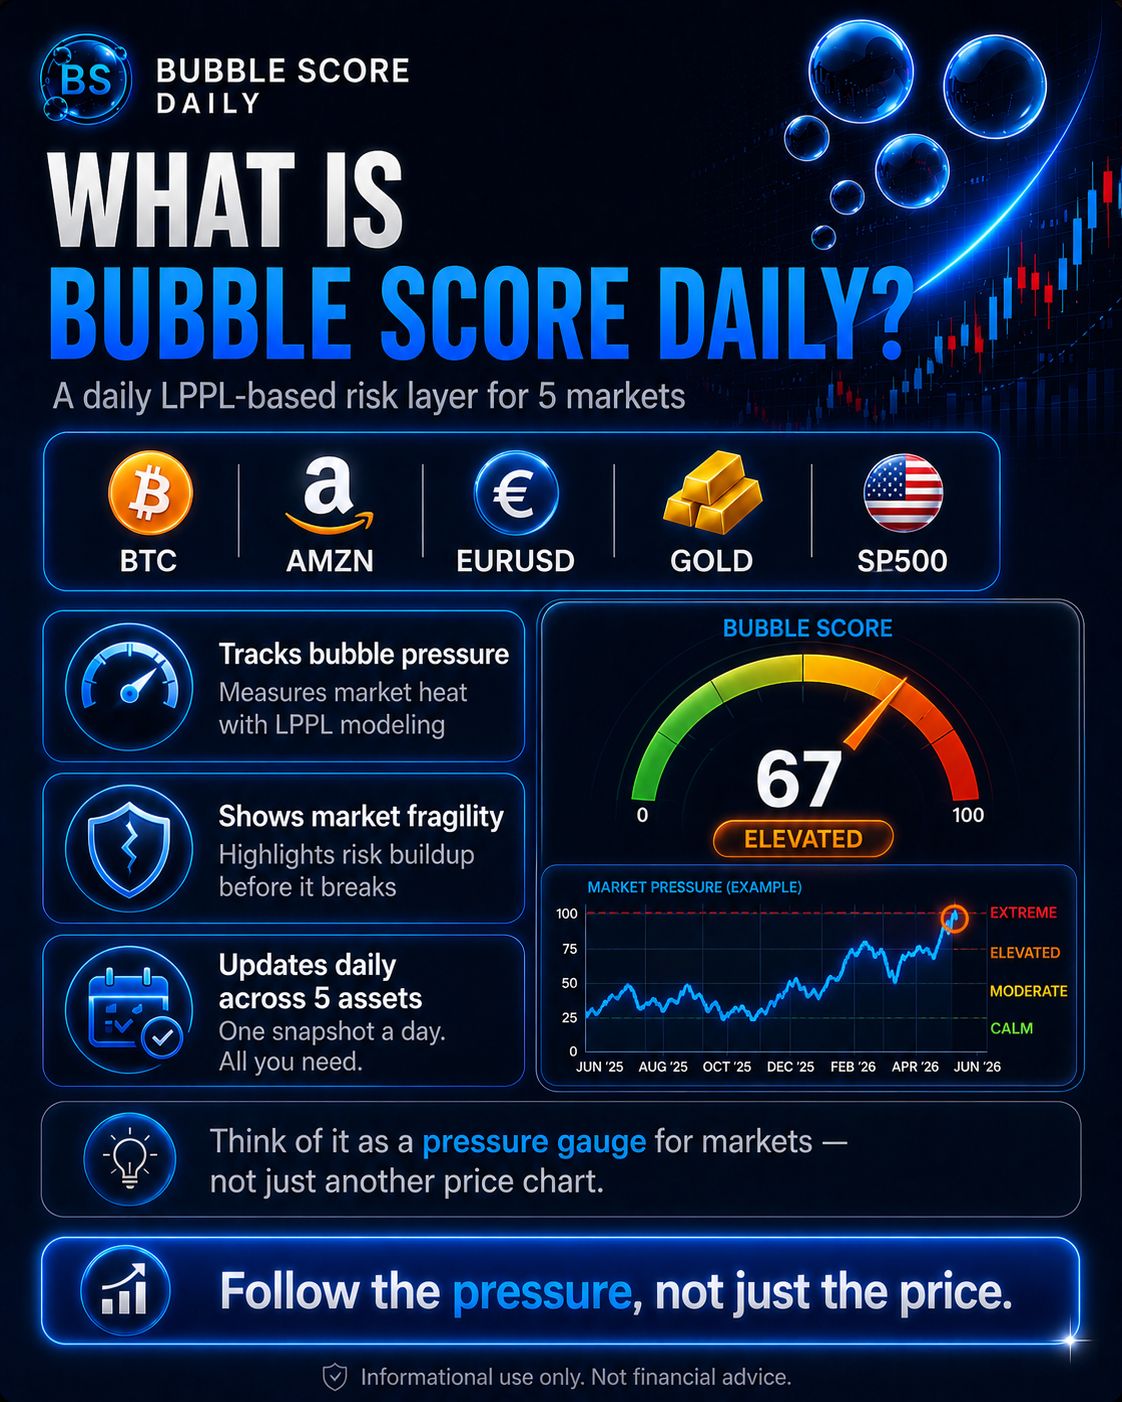
What is Bubble Score Daily?

A daily LPPL-based risk layer for 5 markets:

BTC, AMZN, EUR/USD, Gold, and S&P 500.

It does not just follow price.

It tracks bubble pressure, market fragility, and whether risk is building underneath the chart.

Think of it as a pressure gauge for markets.

Follow the pressure, not just the price.

file_ooSZXNjqdamKd