

What if you could stop guessing when your trading is actually working?
Most traders look at their P&L and call it a day. But a single profit number doesn't tell you when you perform best, which setups are working, or where you're consistently losing money.
That’s where this trading analytics system comes in.
📊 See your trading performance broken down by:
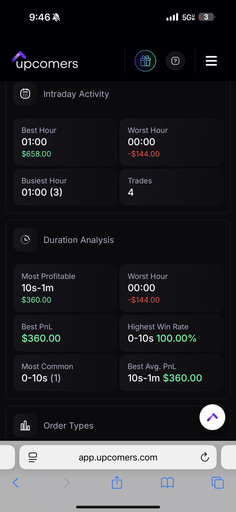
Best & worst trading hours
Most profitable duration
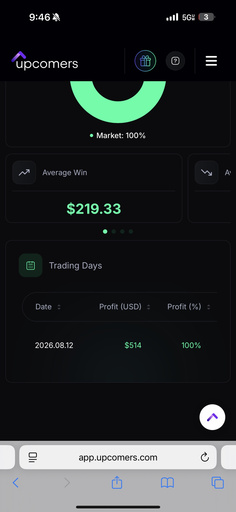
Average win
Win rate
Most common trade duration
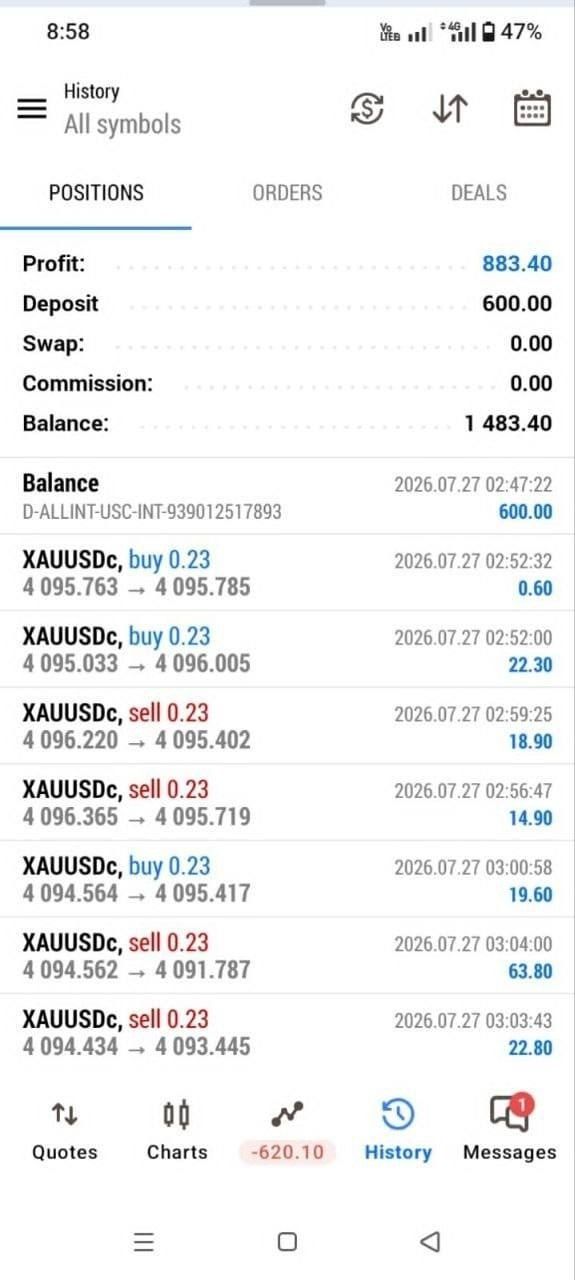
Average profit per trade
Trading days & daily performance
Order-type performance
The dashboard in the screenshots, for example, highlights metrics such as a $219.33 average win, 100% win rate, and detailed hourly/duration breakdowns.
Instead of simply asking “Did I make money today?”, you can start asking:
“What specifically is making me money and what should I stop doing?”
If you're serious about becoming more data-driven and consistent with your trading, this is built to help you turn your trading history into actionable insights.
Join and start tracking your edge. 📈
Would you use a dashboard that automatically shows you your most profitable trading hours, setups, win rate, average win, and other performance stats?