

GDS Last Hi-Lows
Quickly identify and track critical price levels
Track last candle, previous day, week, month & all-time highs/lows with customizable labels. Gain a trading edge!
My offers
- GDS Moving Averages IndicatorSubscription$8.95 / month+2 options7 day trial
- Gain a decisive edge. Master market trends and reversals.
- Visualize moving averages from multiple timeframes in a single timeframe
- Customizable lengths, colors and widths
- Dynamic angle and slope calculations
- Customizable label formatting and content
- GDS Channel IndicatorSubscription$1.99 / month+2 options7 day trial
- Dominate any market. Pinpoint trend-based pivots and support & resistance.
- Easily visualize TWO linear regression channels
- Adjustable length and width
- Customizable lookback regression bands
- Customizable channel colors, line styels and widths
- GDS Band IndicatorSubscription$1.99 / month+2 options7 day trial
- Effortletlessy spot trends, key pivots and support & resistance levels
- Plots customizable moving average (Bollinger) bands
- Color-coded Bullish/Bearish ribbon to highlight bullish and bearish trends
- Clear signals for potential long and short entry points
- GDS Last Hi-LowsSubscription$1.99 / month+2 options7 day trial
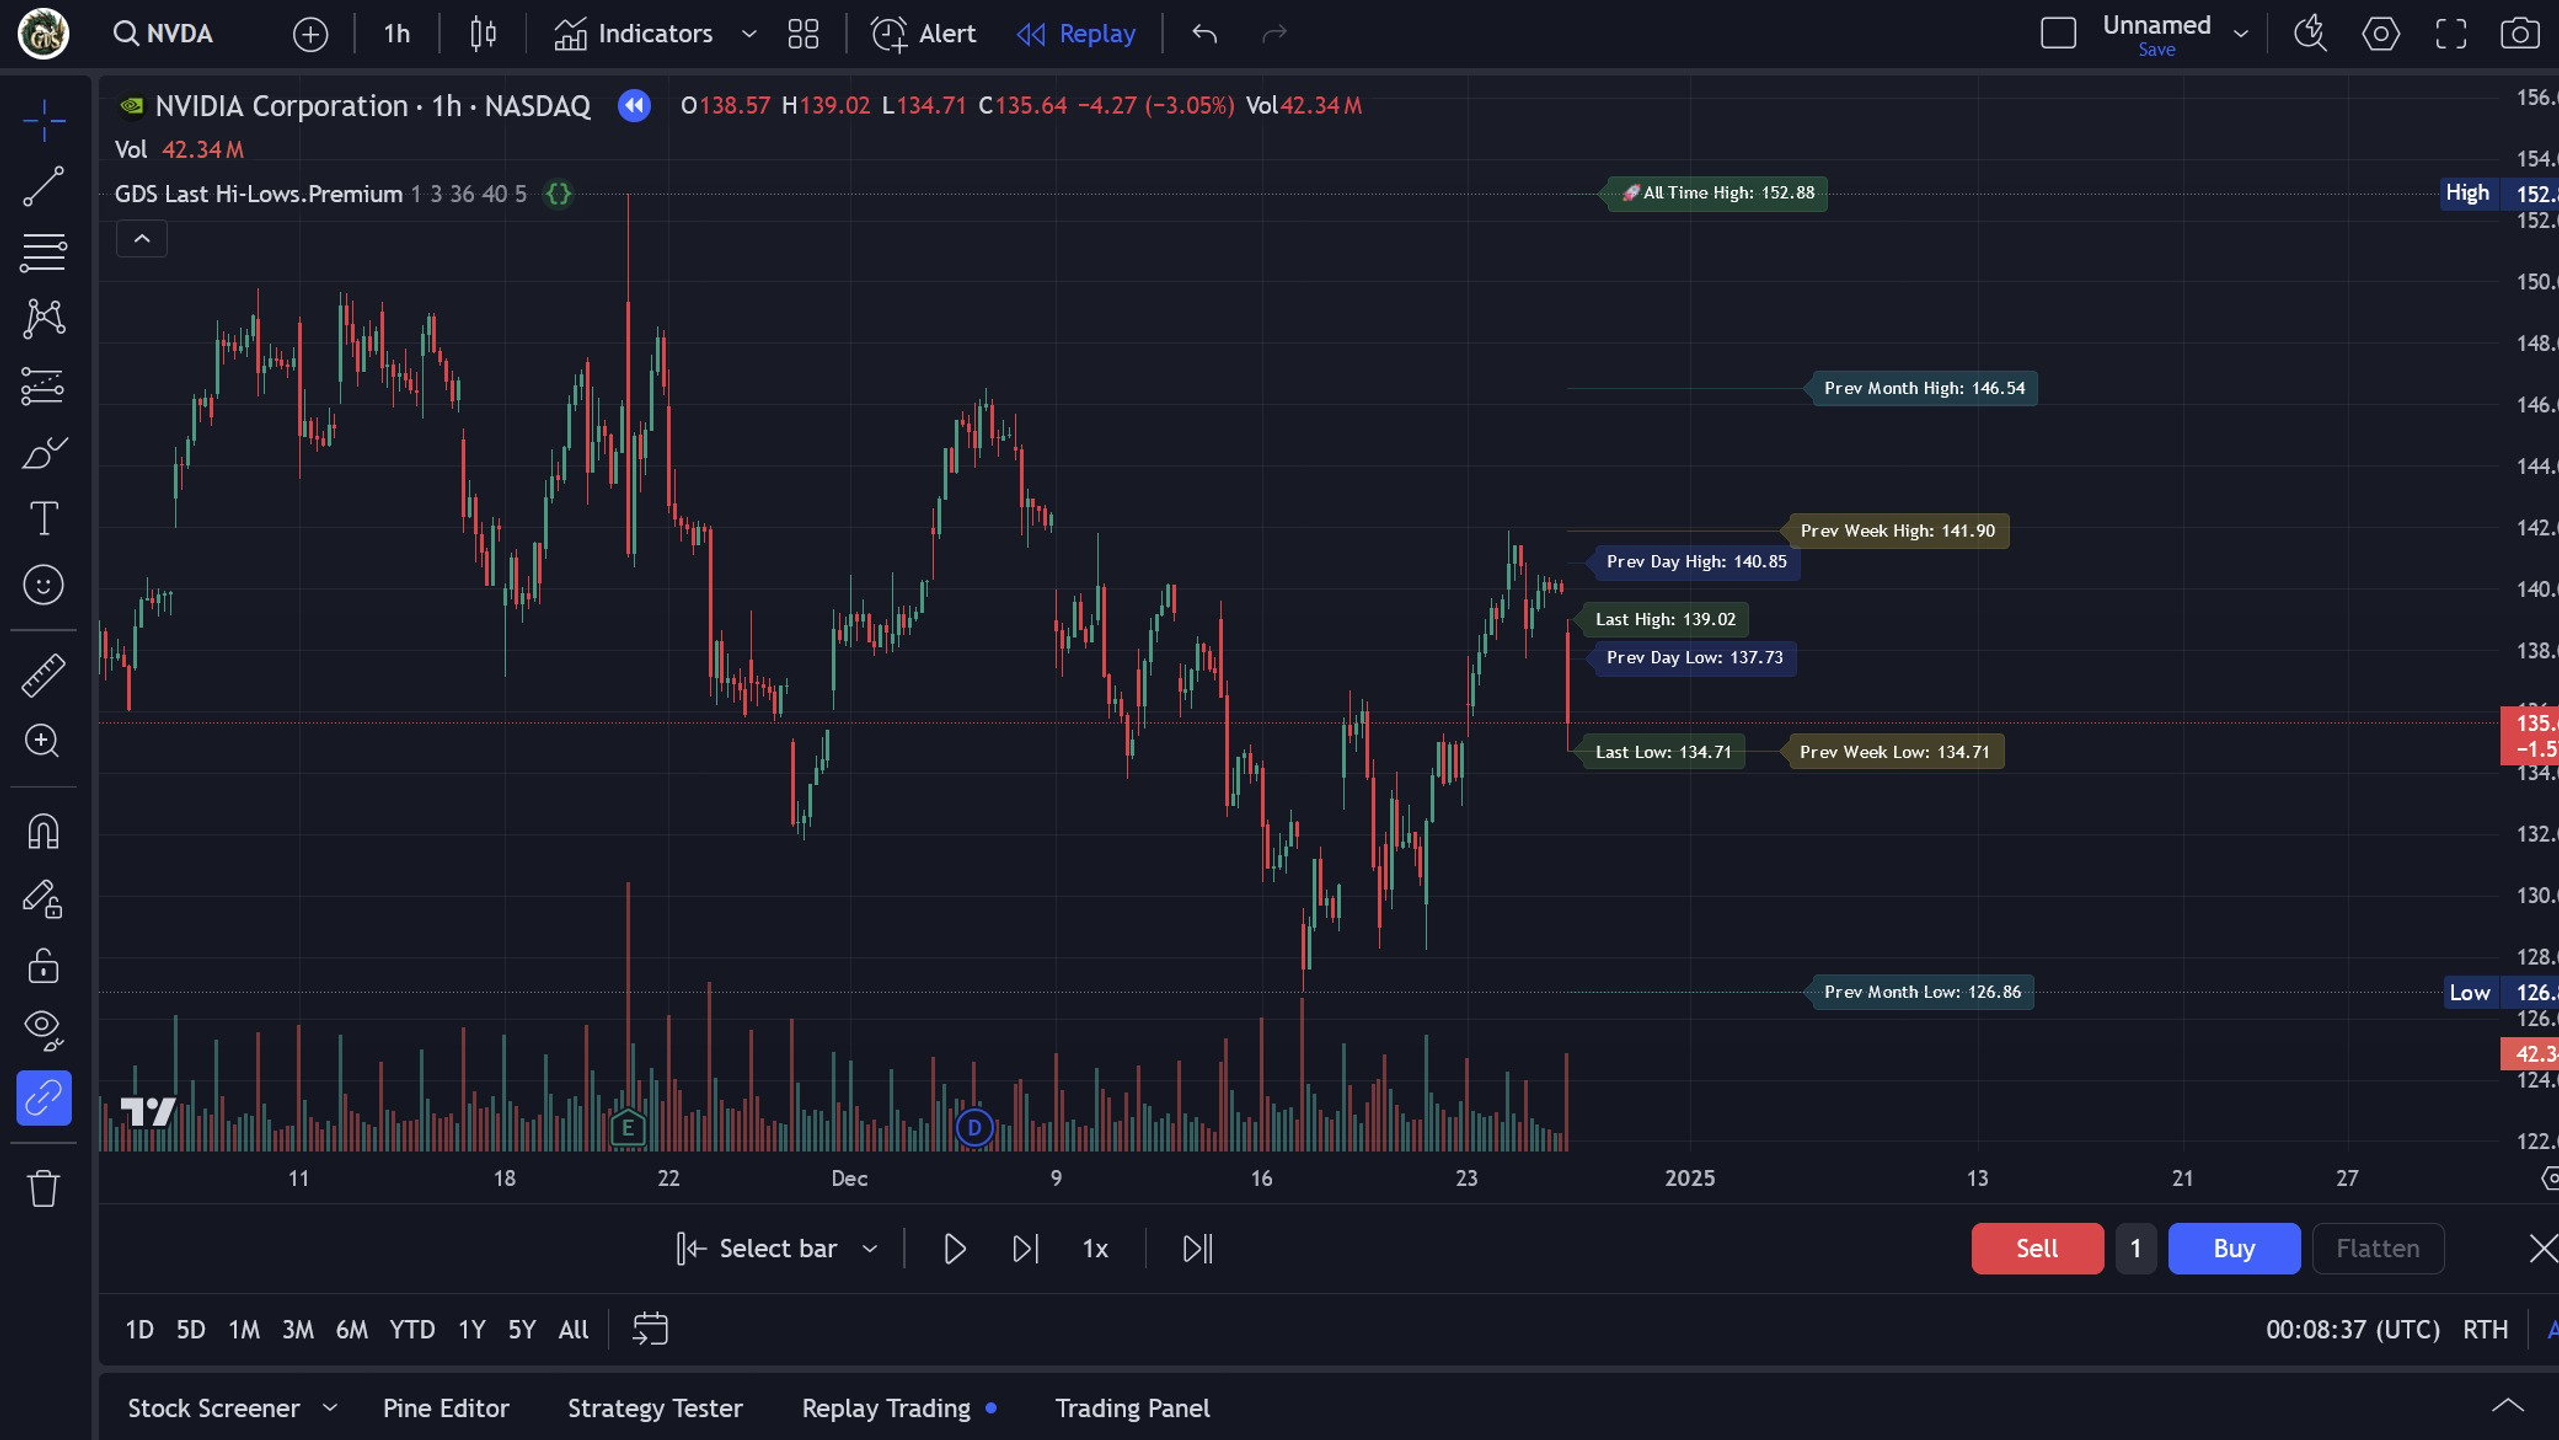
- Effortlessly monitor the most important price points
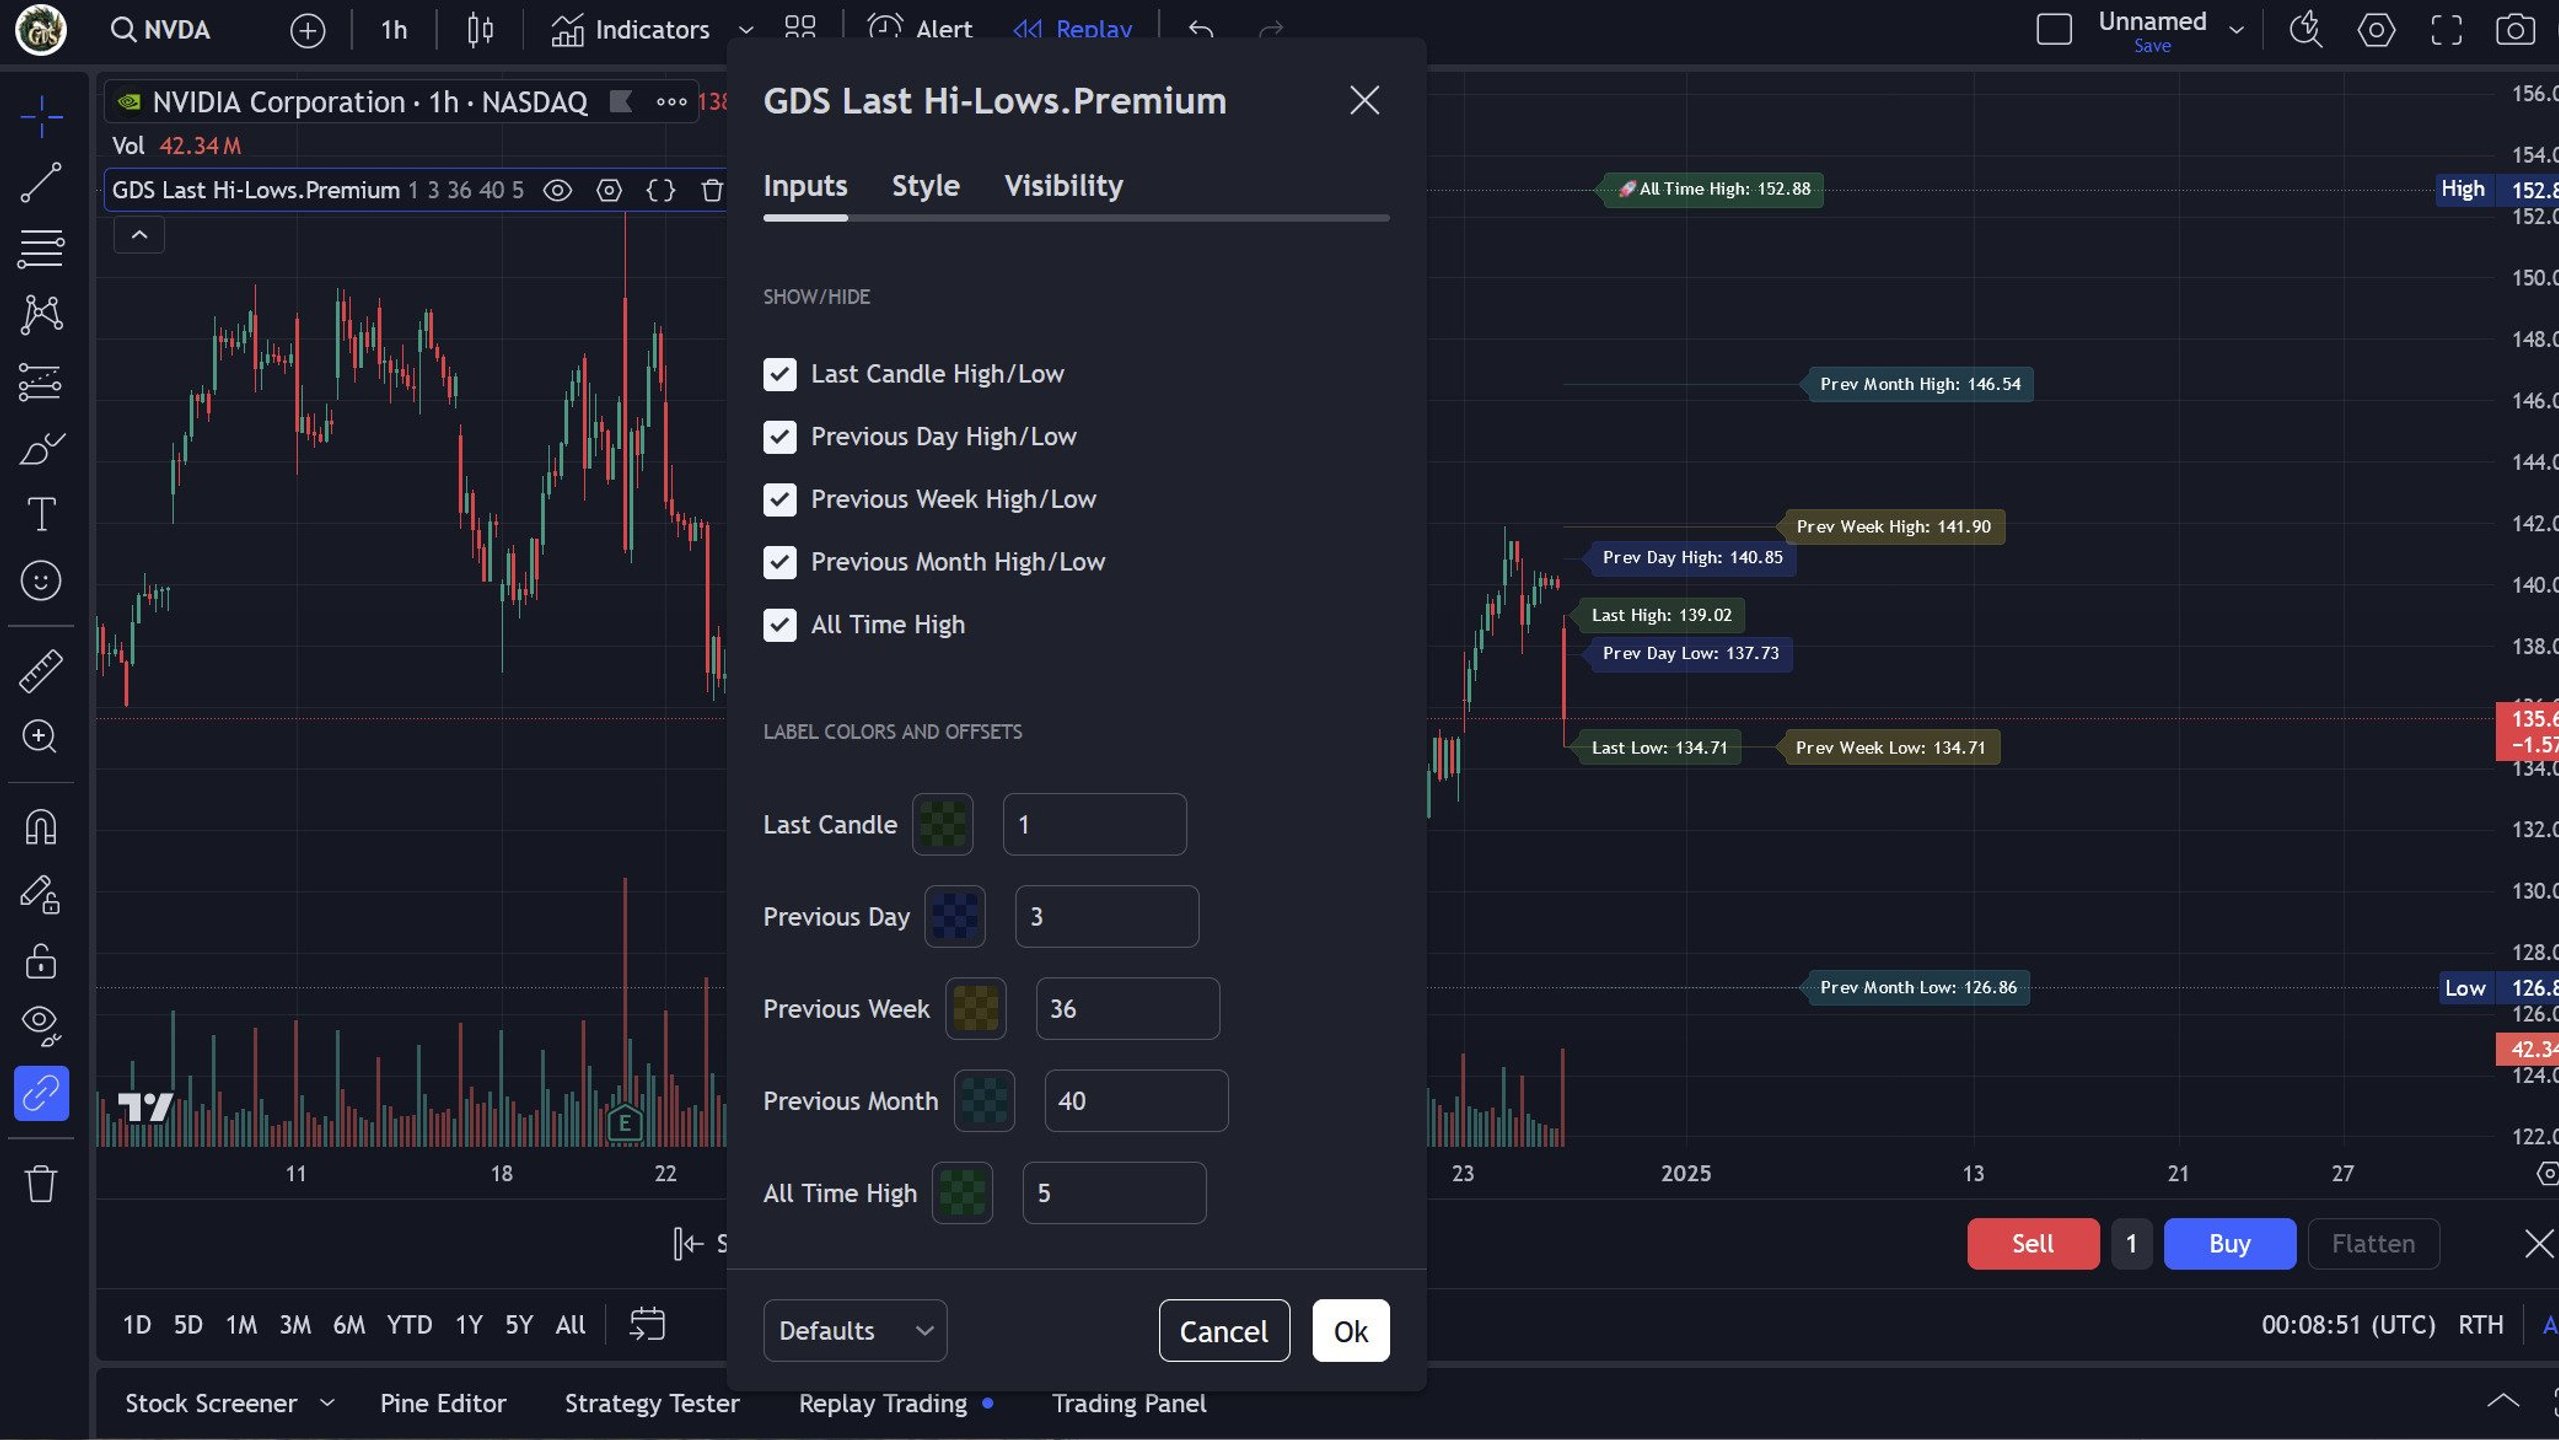
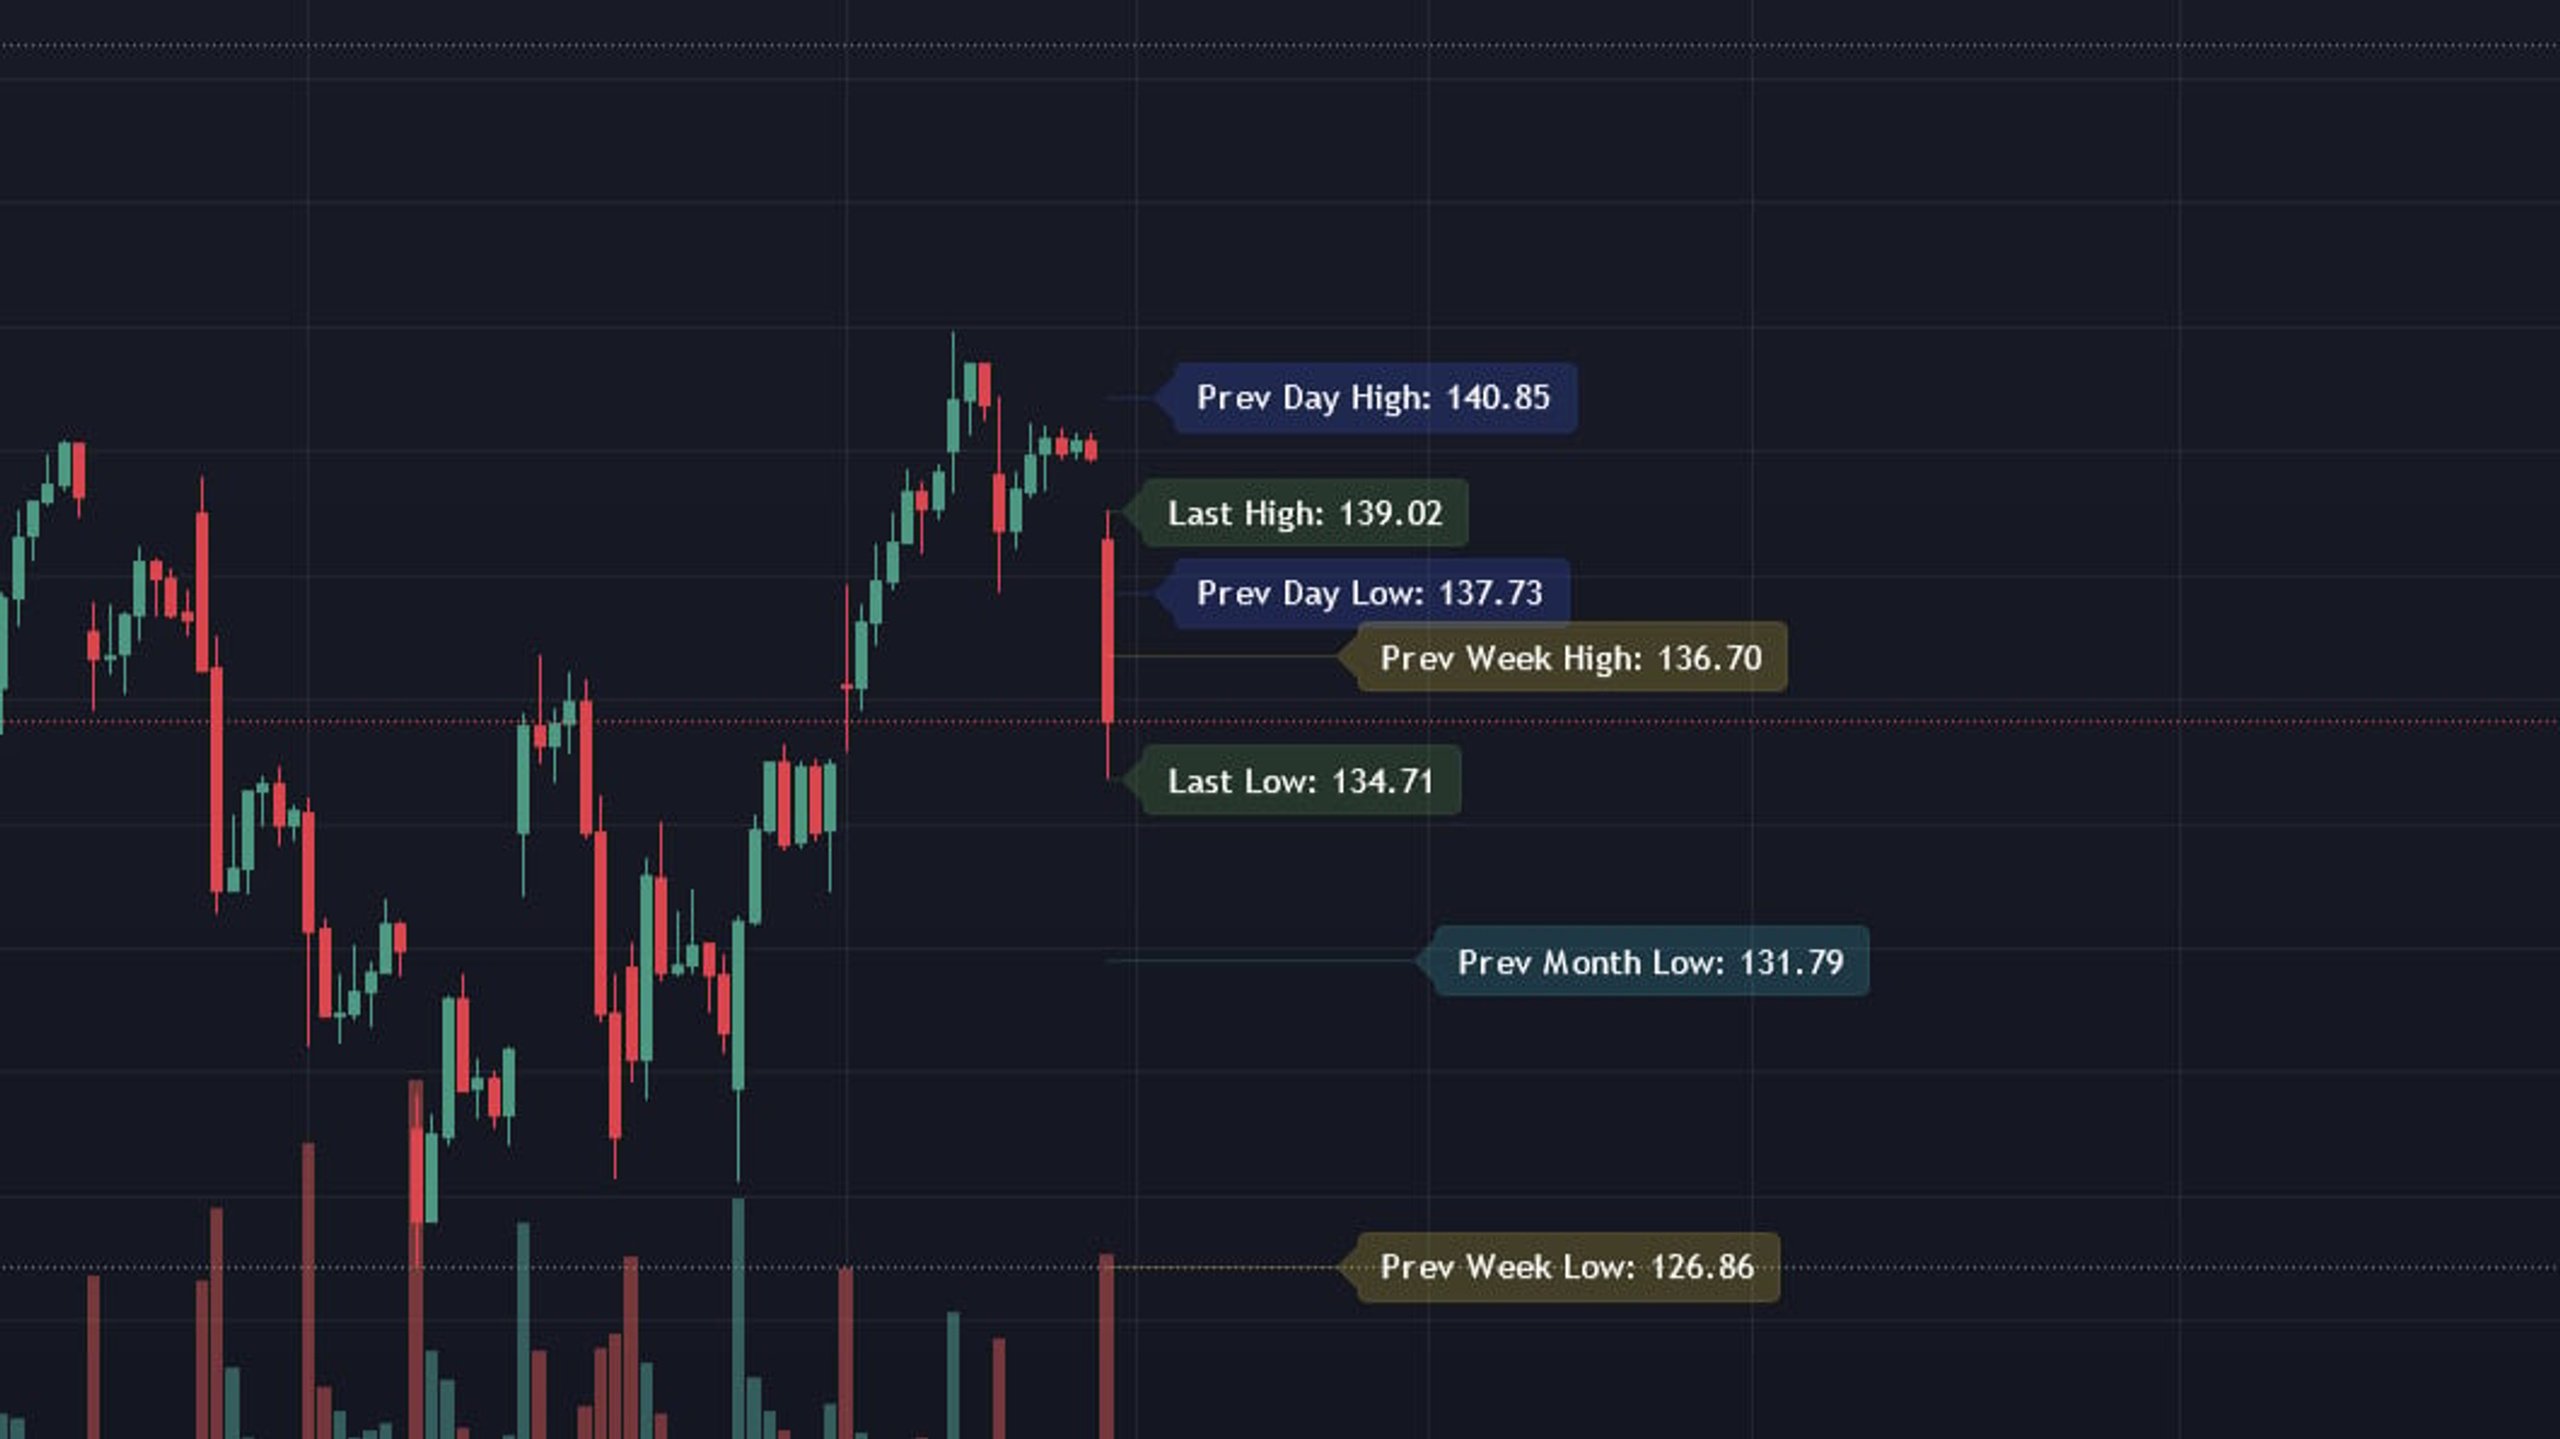
- Tracks high and low for previous candle, day, week, month and all-time high
- Show or hide each high/low pair individually
- Customizable colors and offsets
- GDS Indicator Suite PremiumSubscription$12.95 / month+2 options7 day trial
- The ULTIMATE key to master trends, pivots and support & resistance levels
- FREE access to all new PAID indicators FOR LIFE!
- Moving Averages, Channel, Band and Last Hi-Lows Premium Indicators
- Clear signals for potential long and short entry points
- Crafted with attention to usability, suitable for minimalists and maximalists
- GDS Ticker CompareFree lifetime
- Dual-Ticker Comparison
- Compatible with options and futures
- Customizable pivot calculation
- Lead/lag Adjustment
Here's what you'll get
- Last Hi-Lows (Premium)GDS Last Hi-Lows (Premium) indicator for TradingView.
- Ticker Compare Indicator (Free)GDS Ticker Care (Free) Indicator for TradingView.

Learn about me
GDS Holdings@gdstv • Joined Jan 2025
Who this is for
- The Trend RiderSeeks to capitalize on trends. Uses MAs to identify direction & strength. Values clear visuals and customizable tools.
- The Aspiring TraderEager to learn, wants simple tools to understand market trends, and make informed decisions without feeling overwhelmed.
- The Swing SniperAims to profit from short- to medium-term price swings. Looks for precise entry/exit points at support/resistance levels.
- The Multi-Frame AnalystAnalyzes multiple timeframes for confirmation. Needs tools to quickly assess trends & levels across different periods.
Pricing
Join GDS Last Hi-Lows
$1.99 / month+2 options
7 day trial
- Effortlessly monitor the most important price points
- Tracks high and low for previous candle, day, week, month and all-time high
- Show or hide each high/low pair individually
- Customizable colors and offsets
Frequently asked questions
Reviews

Become an affiliate
30% Reward
Earn money by bringing customers to GDS Last Hi-Lows. Every time a customer purchases using your link, you'll earn a commission.GDS Last Hi-Lows$1.99 / month+2 options