

Why I built a real-time news radar (and what it caught in its first week)
Most people consume news passively. You open Twitter, scroll Reddit, maybe check a news app. By the time you see something, it's already been through 3 rounds of commentary.
I wanted something different — a raw signal feed. No opinion layer, no algorithm deciding what matters. Just real-time events from primary sources, classified and plotted on a map as they happen.
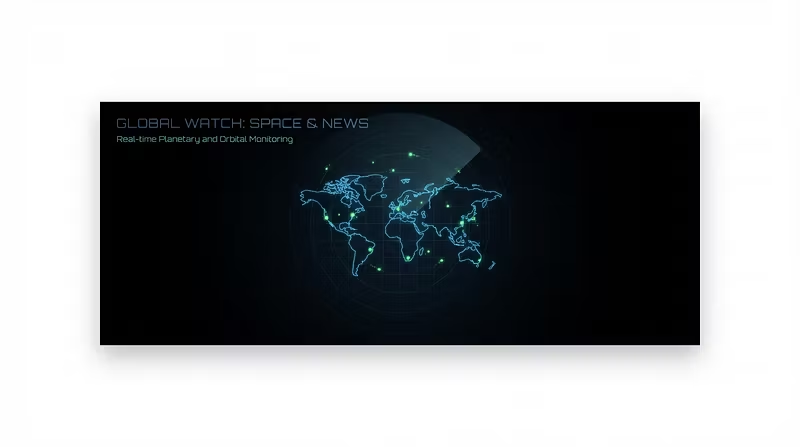
So I built Signal Radar. It pulls from BBC World News, BBC Tech, BBC Science/Environment, and two NASA feeds (Breaking News + Solar System Updates). Every 60 seconds, new items get classified into 5 categories: Global News, Technology, Science, Space Discovery, and Major Events.
The first thing you notice when you watch raw signals flow in: the world moves fast. In any given hour, there are 15-30 new signals across these sources alone. Patterns emerge that you'd never catch scrolling a feed — regional clusters, topic waves, the gap between when NASA drops a discovery and when mainstream outlets pick it up.
This isn't for casual news readers. It's for people who need to see signals first — OSINT researchers, analysts, anyone whose edge depends on information speed.
The dashboard is live now. $19/month gets you the full radar.
