Why most retail traders read charts wrong (and how indicators fix it)
I spent years staring at naked charts thinking I had an edge. Spoiler: I didn't.
The problem isn't that technicals don't work — it's that most traders are looking at lagging information and calling it analysis. Moving averages tell you where price was. RSI tells you what already happened.
What actually moves the needle:
The options chain tells you where smart money is positioning before the move happens. But reading raw options data in real time is overwhelming — thousands of contracts, constantly changing.
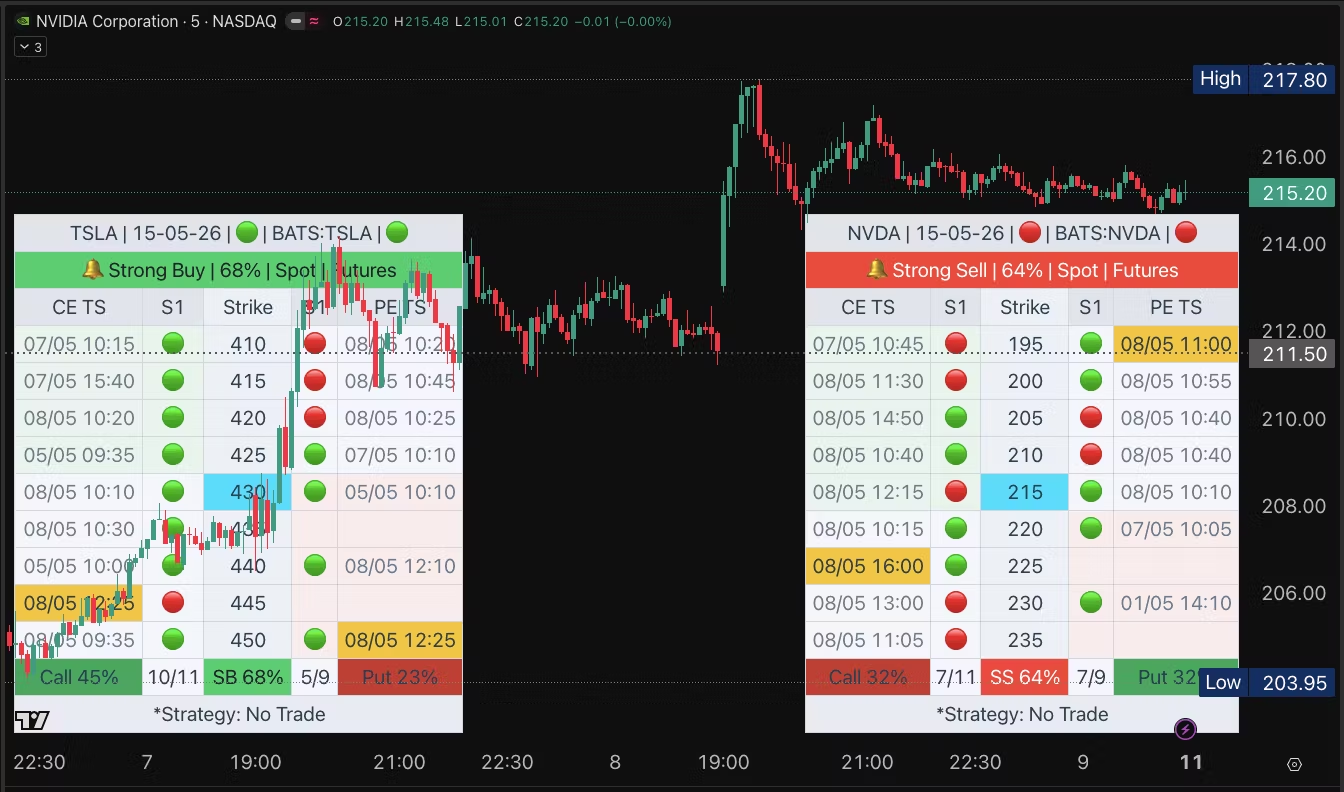
That's why I built custom TradingView indicators that distill the signal from the noise:
Flow imbalance detection — highlights when call/put volume diverges from historical norms at specific strikes
Key level mapping — automatically plots the price levels where the largest institutional positions are concentrated
Entry timing — combines volume profile with flow data to pinpoint when the move is most likely starting
These aren't magic. They're tools that give you a structured way to read what the market is actually telling you — instead of guessing.
I run these on every single trade I take. If you want access to the full suite, OpChain has you covered.