

The one theta signal almost nobody tracks (and it's costing premium sellers real money)
Spent the last few months deep in options chains building a decay tracker, and the thing that surprised me most wasn't the decay curves themselves — it was how many premium sellers get the shape of theta decay completely wrong in their head.
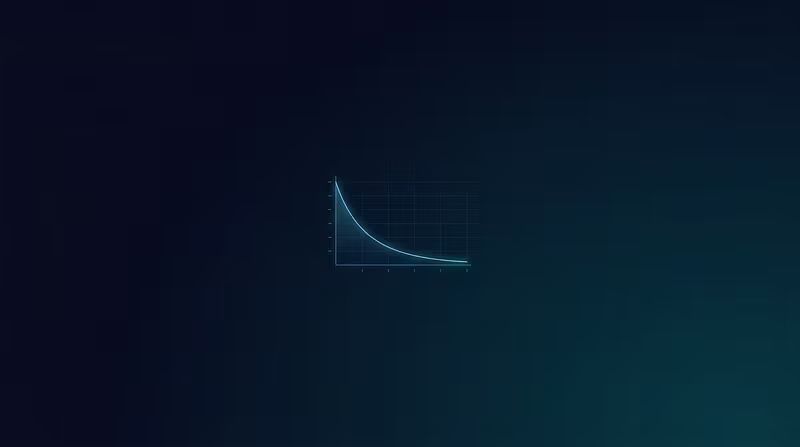
Most people think decay is roughly linear. It's not. It's convex. Somewhere around 45 DTE it starts steepening, and by the time you're inside 21 DTE (what I call the gamma zone), the bulk of your daily time value is evaporating — but your directional risk (gamma) is ramping up at the exact same time. Reward and risk accelerate together. Most spreadsheets don't show you this, they just show you a static greeks snapshot.
The signal that actually matters isn't "how much theta am I earning today" — it's "is my decay outpacing adverse price movement, or is price action quietly canceling out my decay gains." I ended up calling this decay/price divergence, and once you start watching for it, it changes how you manage exits. A position can look "fine" on paper (decaying on schedule) while the underlying has already moved enough that you're not actually ahead anymore.
If you sell premium regularly — covered calls, CSPs, credit spreads, condors — I'd genuinely recommend tracking this divergence rather than just theta in isolation. It's the difference between managing a system and just waiting around hoping time decay bails you out.
Built a tool around this exact problem if anyone wants to see it in action — happy to answer questions either way.