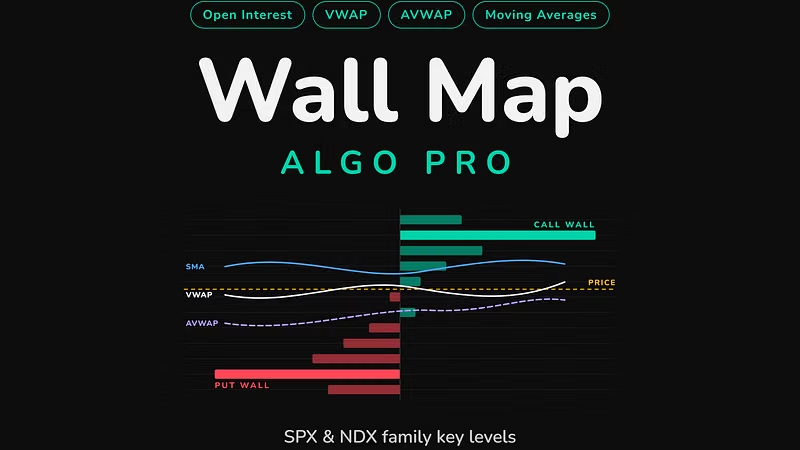


Dead zones: where the market has no floor.
In the first post we looked at institutional walls: strikes where so much open interest piles up that dealer hedging turns them into real support and resistance. This post is about the opposite — and it matters just as much.
¿WHAT A DEAD ZONE IS?
Open interest is not spread evenly across strikes. It clusters. Institutions build positions at round numbers, at monthly expirations, at levels that match their books — and between those clusters there are stretches of price where almost nothing is held. No meaningful puts. No meaningful calls. Nobody is hedging anything there.
That stretch is a DEAD ZONE: a span of price with no mechanical reason for anyone to buy or sell the underlying.
¿WHY PRICE SLIDES THROUGH THEM?
A put wall slows a decline because the dealers short those puts must buy futures as price approaches the strike — hedging flow acts like a brake. Inside a dead zone there is no such flow. If price breaks the last wall above a dead zone, the next mechanical buyer might be 1% lower. The market doesn't grind through that space; it tends to slide through it fast, because nothing in the options book stands in the way. The same is true upward: a rally that clears the last call wall below a dead zone often accelerates until it reaches the next cluster.
Dead zones don't cause moves. They remove friction. The move was going to happen; the dead zone decides how fast it travels.
¿WHY OPTION SELLERS SHOULD CARE MOST?
If you sell options premium — credit spreads, iron condors, covered anything — the dead zone is the single most useful thing the map can show you. A short strike placed inside a dead zone has no wall defending it: if price enters the zone, there is nothing between the entry and your strike but air. A short strike placed BEHIND a major wall, on the far side of the hedging flow, is a different trade entirely — same distance, same premium, completely different structure. Distance from spot is not safety. Structure is.
¿HOW WALLMAP DRAWS THEM?
The engine scans every expiration's open interest for each instrument and marks the stretches where it finds no defensible cluster — explicitly, as shaded spans on the chart, recomputed every premarket. They are the "do not sell" areas of the map. They move every day, because the book moves every day: a dead zone that was empty on Monday can have a 20,000-contract wall built inside it by Thursday. A map from last week is a map of a market that no longer exists.
NEXT IN THIS SERIES
The line that changes what every wall means: zero-gamma — why the same strike behaves like a magnet on one side of it and like a trapdoor on the other.
---
The full daily map — every wall per expiration, the technical ladder, confluence grades, dead zones and the zero-gamma line, delivered premarket as a data block for the WallMap Algo PRO TradingView indicator — is part of the private service:
DISCLAIMER: This content shows historical and current market positioning for informational and educational purposes only. It is not financial advice and no performance is implied or guaranteed. Trading involves substantial risk of loss.