Explore over 100 small business statistics covering revenue, costs, marketing, technology, and more.
Key takeaways
- Cash flow management is the top reason small businesses fail, with 82% citing it as their primary cause of failure.
- Small businesses drive global economies, representing 90% of companies and creating up to 70% of all jobs worldwide.
- Software businesses offer the highest profit margins (19.14%) among small business-friendly industries, making them attractive ventures.
Small businesses are typically defined as independent entities with under 250 employees. While this varies from country to country, one thing is consistent: small businesses make a big impact. In most economies, they account for 90% of all companies, generate over 70% of employment, and contribute a notable 70% to the GDP.
Whether you run a small business or intend to start one, we’ve consulted a wide range of sources to deliver over 100 small business statistics covering revenue, costs, marketing, technology, and more.
Key small business statistics
Small businesses represent 90% of all companies1 worldwide.
They’re also responsible for close to 70% of gross domestic product (GDP) worldwide and contribute up to 40% of national income in emerging economies.
As of 2024, small businesses created up to 70% of all jobs2 globally.
They accounted for 66% of business employment in advanced economies3 and created up to 80% of all jobs in emerging economies.
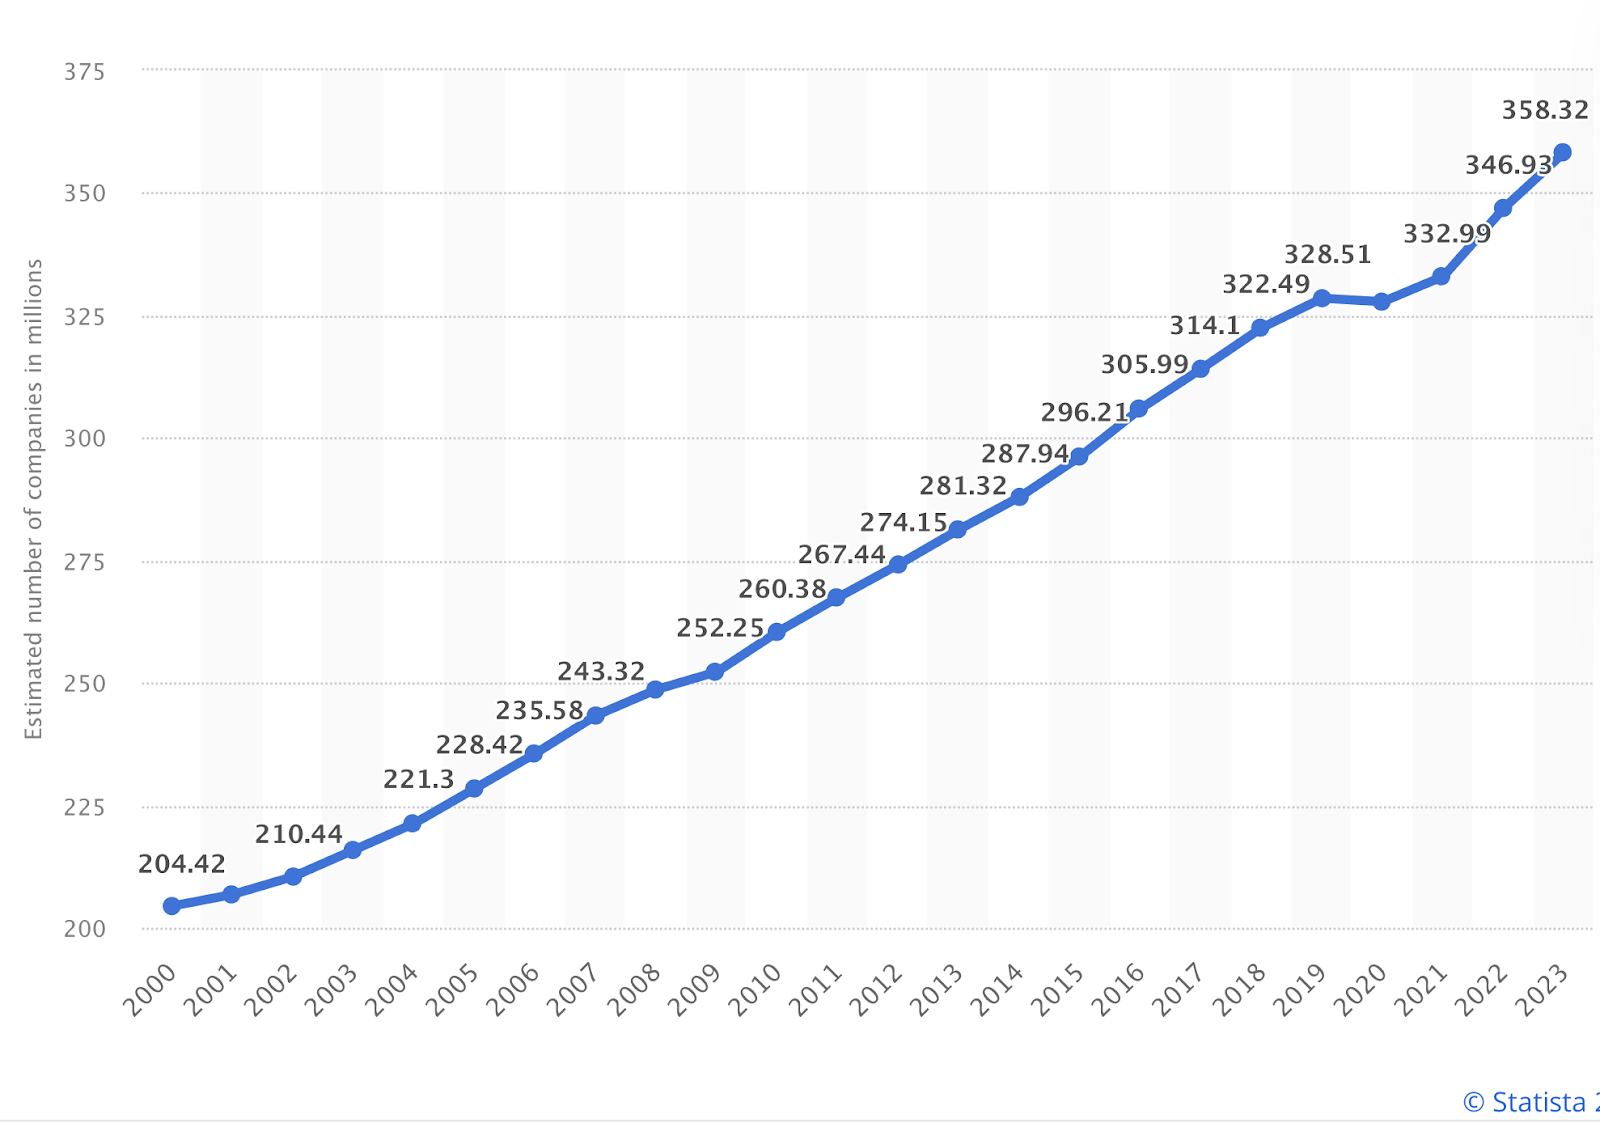
There were approximately 358 million small and medium-sized enterprises4 with fewer than 250 employees worldwide in 2023.
In 2020 alone, 32% more small businesses5 were formed globally. The top 5 countries that saw the largest new business formation in 2020 were:
- United Kingdom - 101%
- United States - 86%
- Australia - 73%
- Germany - 62%
- Canada - 58%
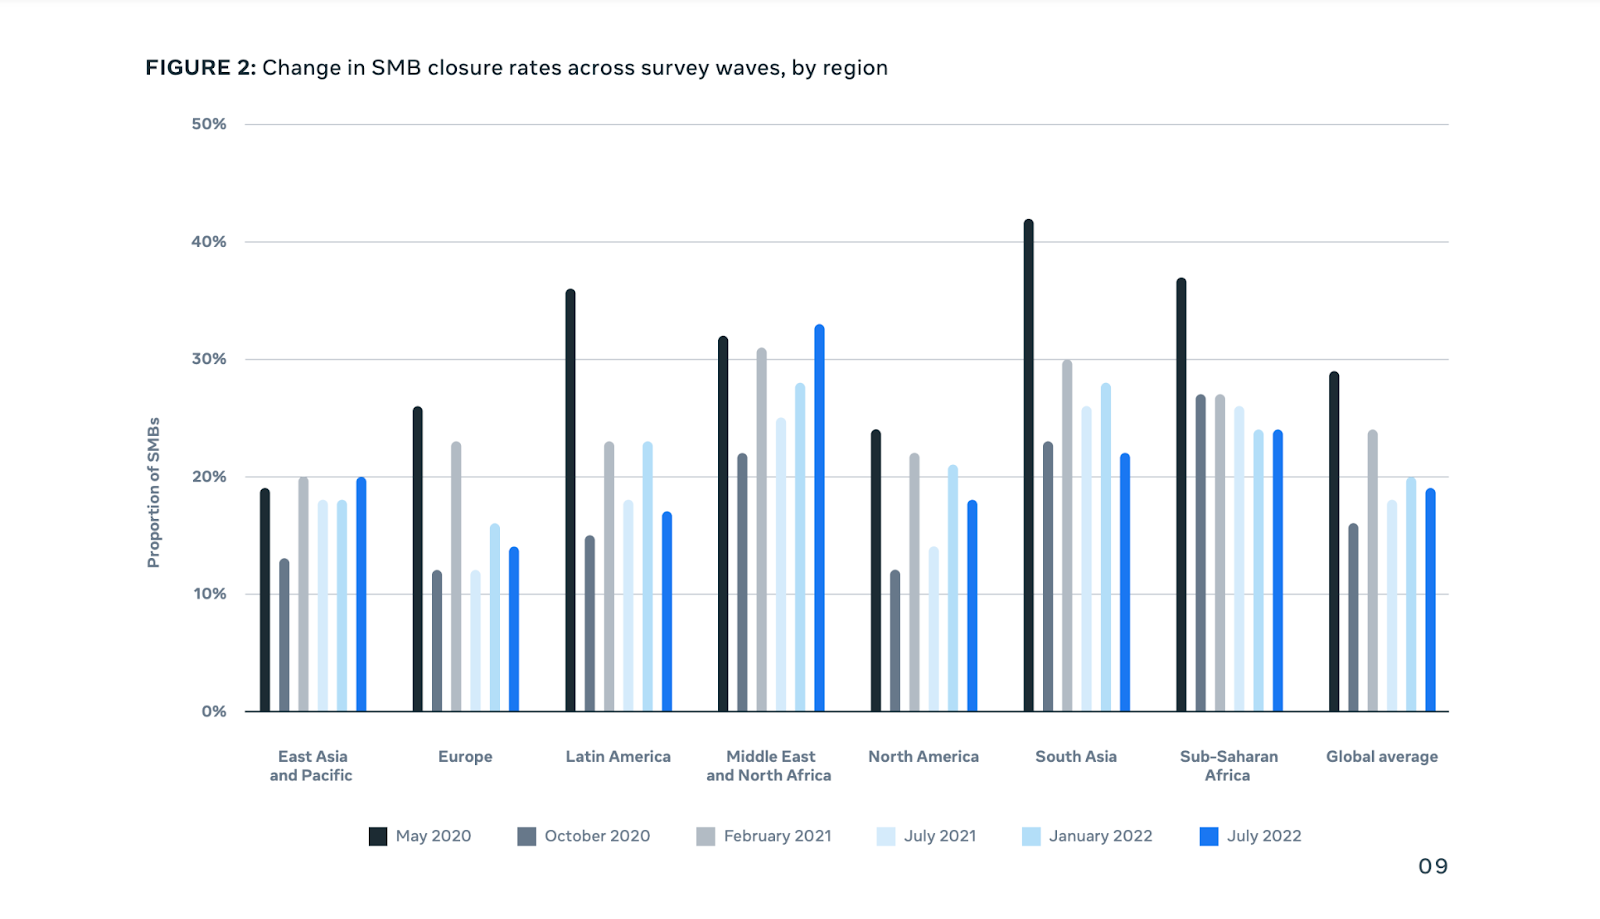
A 2022 Meta report studied over 22,054 SMB leaders across 30 countries and territories, including 5,198 SMB leaders in the US. It found that global small business closure rates were 19%6.
However, small business closures varied at the regional level, with Europe experiencing the least closures at 14% and the Middle East and North Africa experiencing the highest closure rates at 33%.
The same report also found that women-led small businesses reported higher closure rates at 23% versus 17% for men-led small businesses.
Despite higher closure rates, women-led small businesses reported better sales.
In terms of why small businesses fail, 82% of small businesses failed due to cashflow problems in 20237.
Additionally:
- 42% failed due to no market need for their product or service.
- 29% failed due to running out of funds.
- 23% failed because they didn't have the right team.
- 19% failed because they were pushed out by the competition.
Small Business Statistics US
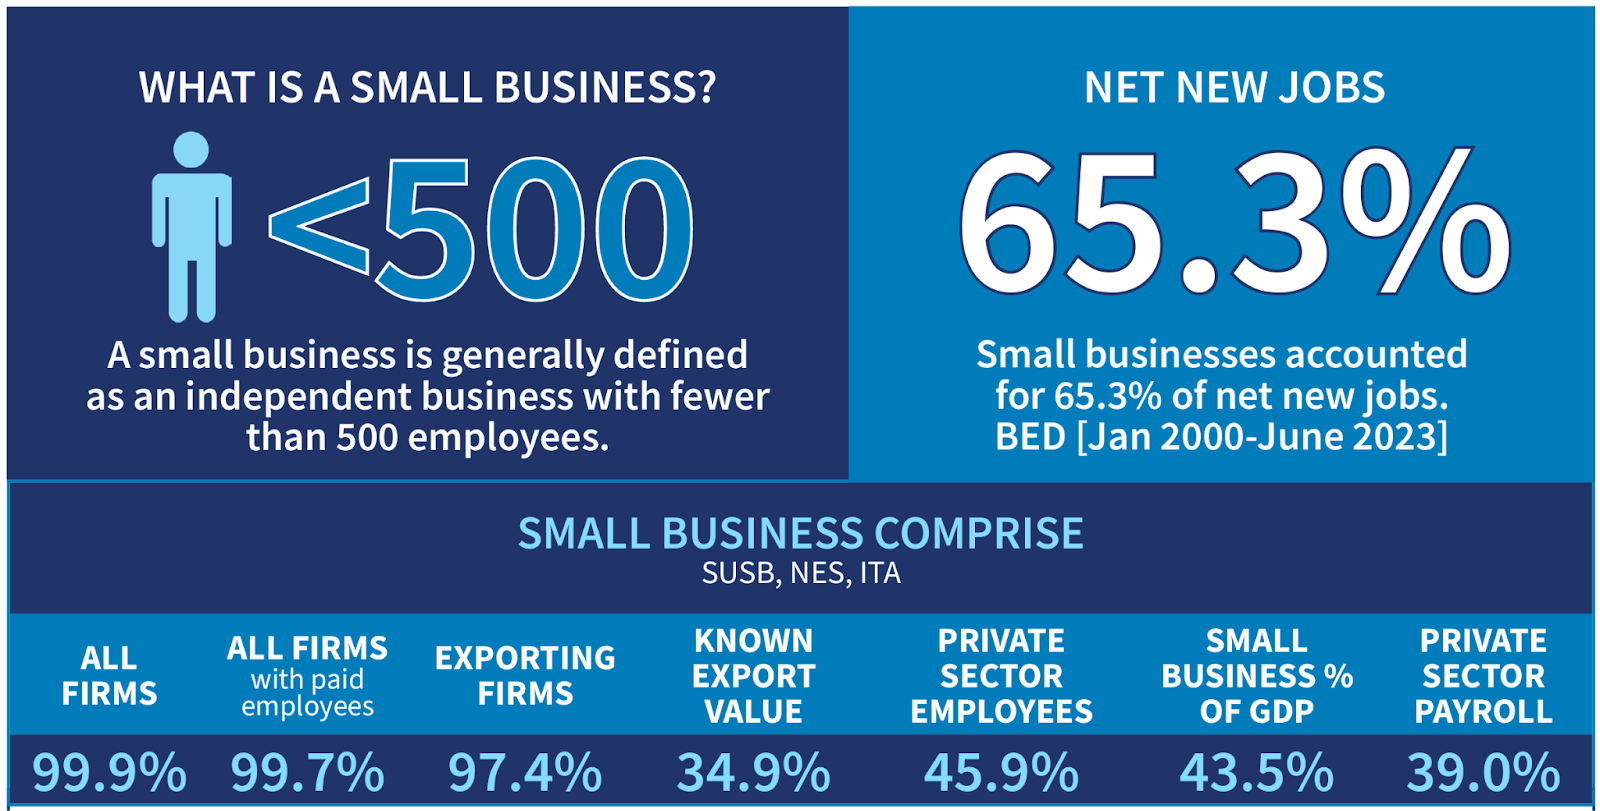
As per 2024 SBA data, there were 34.75 million small businesses in the US8, accounting for 99.9% of all firms in the country.
Small businesses also accounted for:
- 99.7% of firms with paid employees
- 97.4% of exporters
- 45.9% of private sector employees
- 43.5% of gross domestic product (GDP)
- 39% of private sector payroll
- 38.9 % of private sector receipts
- 34.9 % of known export value
According to the same data, 81% of small businesses were non-employer firms (no employees), while 18.1% were employer firms.
The number of non-employer firms increased by a notable 84% from 2011, while the number of small employer firms increased year-over-year over the same period.
The data also revealed that small businesses accounted for 61% of net new job creation.
Between January 1995 and June 2023, small businesses created 20.2 million net new jobs. While over 9.1 million small business job losses occurred in 2020, small business employment recovered, adding 10.7 million new jobs by Q3 2022.
In terms of small business types, sole proprietorships made up 86% of non-employer firms in 2021.
They also accounted for 13% of small employer firms.
The majority of small employer firms (53%) were S-corporations.
This was followed by:
- C-corporations (14.8%)
- Partnerships (12.2%)
- Non-profits (7%)
36% of small business owners had between 2 to 5 employees. This was followed by 30% who had between 6 and 20 employees.
Meanwhile:
- 21% of small business owners worked alone and identified as solo entrepreneurs
- 10% had between 21 and 50 employees
- 2% had between 50-100 employees
- 1% had over 100 employees
In the US, around 20% of new businesses failed within the first two years9, 45% in five years, and 65% within 10 years.
Only 25% of new businesses survived 15 years or more. These statistics haven't changed much over time, and have been fairly consistent since the 1990s.
Additionally, small business closure rates were highest in the states of New York and Arizona at 28%.
On the other hand, small business closure rates were lowest in North Carolina, Ohio, and Tennessee.
Small Business Statistics UK
There were 5.6 million small businesses with 0 to 49 employees in the UK in 2023, up 0.8% from 202210.
Between 2010 and 2023, the small business population increased by 1.1 million or 24%.
Small businesses accounted for 99.9% of the business population.
They also accounted for 60% of employment and around 50% of turnover in the UK private sector.
4.1 million small businesses in the UK had no employees and 1.4 million had employees.
Additionally:
- 3.1 million or 56% were sole proprietorships
- 37% or 2.1 million were actively trading companies
- 365,000 were ordinary partnerships
Small Business Statistics Canada
There were over 1.19 small businesses11 in Canada as of 2023.
Small businesses, defined as those with 1-99 paid employees, accounted for 97.8% of all businesses.
Small businesses in Canada employed around 5.7 million people in 2023.
This was a notable 46.8% of the private labor force.
Between 2001 and 2020, the number of small businesses opened in Canada increased every year.
Due to economic conditions, 2013, 2016, and 2020 were the exceptions. In those years, business formation decreased.
Small Business Statistics Australia
There were over 2.58 million small businesses with 0 to 19 employees12 in 2023.
Small businesses, defined as those with less than 20 employees by the Australian Bureau of Statistics (ABS), accounted for 97.3 of all Australian businesses.
61% of small businesses were non-employer establishments.
The remaining 27% of small businesses employed an average of 1-4 people.
Small business revenue statistics
The average revenue for a small business with a single owner or employee was around $44,000-$46,000 per year in 202313.
Additionally, 66% or two-thirds of small businesses made less than $25,000 per year.
Average small business revenue14 increased with the number of employees.
- Small business revenue went up to $378,000 for 1-4 employees.
- Small business revenue increased to $1 million or more for 5-9 employees.
- Small businesses employing 10-19 employees generated $2.1 million in revenue annually.
Businesses owned by men had an average small business revenue of $675,643, whereas women-owned businesses had an average revenue of $475,707 in 2024.
That’s a 30% difference and a significant change from 2007 when women-led small businesses made up to 77% less than men-led small businesses.
When it comes to which small business is most profitable, small business profitability varies across industries.
Net profit margin, or the revenue generated less business and operating expenses offers a glimpse into some of the most profitable industries for small businesses. Examples of net profit margins across small business-friendly industries15 include:
| Industry | Gross Margin | Net Margin |
|---|---|---|
| Advertising | 28.11% | 0.89% |
| Apparel | 51.93% | 3.15% |
| Business and Consumer Services | 33.5% | 5.45% |
| Computer services | 25.52% | 4.40% |
| Education | 44.23% | 1.30% |
| Healthcare Products | 55.64% | 8.19% |
| Publishing and Newspapers | 45.99% | 1.82% |
| Retail | 30.86% | 3.09% |
| Software | 72.52% | 19.14% |
Upflip found that some of the most profitable digital small businesses to start in 2024 were:
- Podcast Production: Average annual revenue of $3.2 billion, startup costs of $5,500, and an average profit margin of 39.1%16
- Software Company: Average annual revenue of $10.6 million, startup costs of around $55,000, and an average profit margin of 18.3%
- Social Media Management: Average annual revenue of $817,000, startup costs of between $100-$10,000, and an average profit margin of 6.9%
- Consulting: Average annual revenue of $364,000, startup costs of $1,000-$3.5 million, and an average profit margin of 6.4%
Small business costs statistics
How much does it cost to start a small business in 2024? As of 2024, startup costs for micro businesses were around $3000, while some of the cheapest businesses to start cost $12,00017. However, start-up costs for businesses such as restaurants went up to $400,000.
Ultimately, small business costs depend on different factors such as business type, industry, and so on.
In 2024, 4% of small business owners spent less than $50,000 to start their business18.
- 27% of small business owners spent between $50,000-$175,000.
- 15% of small business owners spent between $175,000-$250,000.
- 27% of small business owners spent between $250,000-$500,000.
- 16% of small business owners spent between $500,000-$1 million.
- 13% of small business owners spent over $1 million.
As of 2024, small business owners spent an average of $40,000 in their first full year of business19. Additionally, they allocated their costs as follows:
- Product costs - 31.6%
- Staff costs - 18.8%
- Operating expenses - 11%
- Offline costs- 10.5%
- Marketing - 10.3%
- Online Store costs - 9%
- Shipping costs- 8.7%
Recommended Small Business Cost Allocation
| Cost | % of First Year Budget |
|---|---|
| Operating Costs | 10%-15% |
| Product Costs | 28%-36% |
| Marketing | 7%-12% |
| Online Costs | 9%-10% |
| Staff Costs | 14%-30% |
34% of small businesses cited shipping costs as their most unexpected costs in 2023.
This was followed by legal fees (23%) and inventory or product costs (21%).
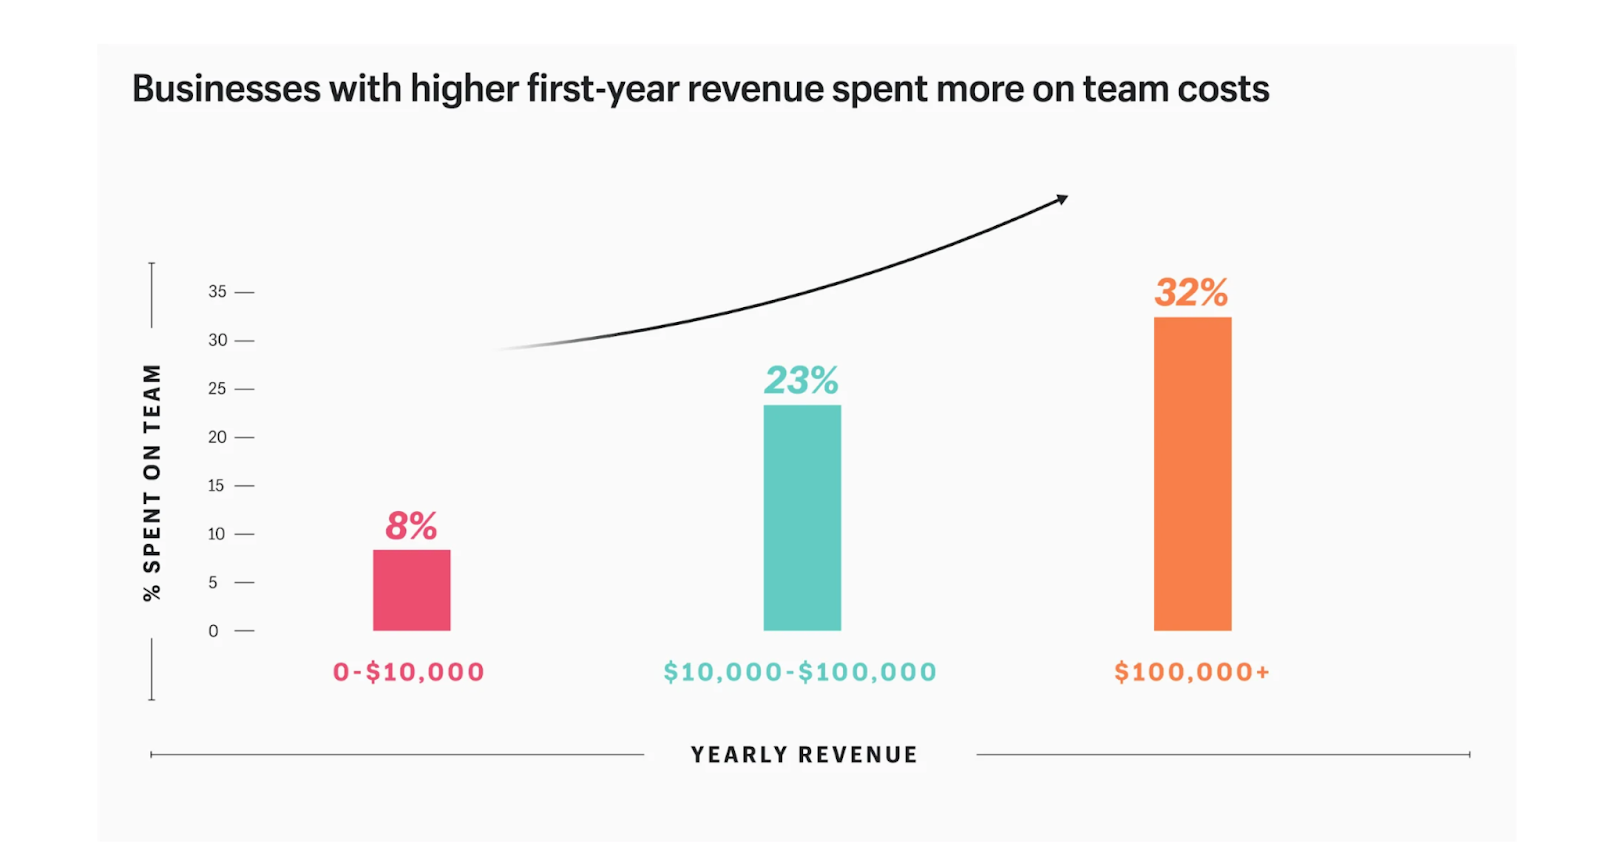
As of 2024, businesses that spent more on staff costs had higher first-year revenue.
- Those that spent 32% on staff costs made over $100,000.
- Those that spent 23% on staff costs made between $10,000 and $100,000.
- Those that spent 8% on staff costs made up to $10,000.
Additionally, the most effective marketing budget for small businesses was anywhere between 7%-12% of revenue.
Businesses that spent 13% of their revenue on marketing made up to $10,000 in yearly revenue. Those that spent 7% of their revenue made between $10,000-$100,000+.
As of 2023, the least expensive costs for small businesses were incorporation fees at $145.
Meanwhile:
- Equipment costs were the highest at anywhere between $11,000 and $125,000.
- The average employee cost was between $41.03 to $43.26 per hour.
- Rent costs were up to $2,500 per month.
- Insurance costs ranged between $500-$700 per year.
- Website costs were around $200 once-off and $50 monthly.
Small business challenges
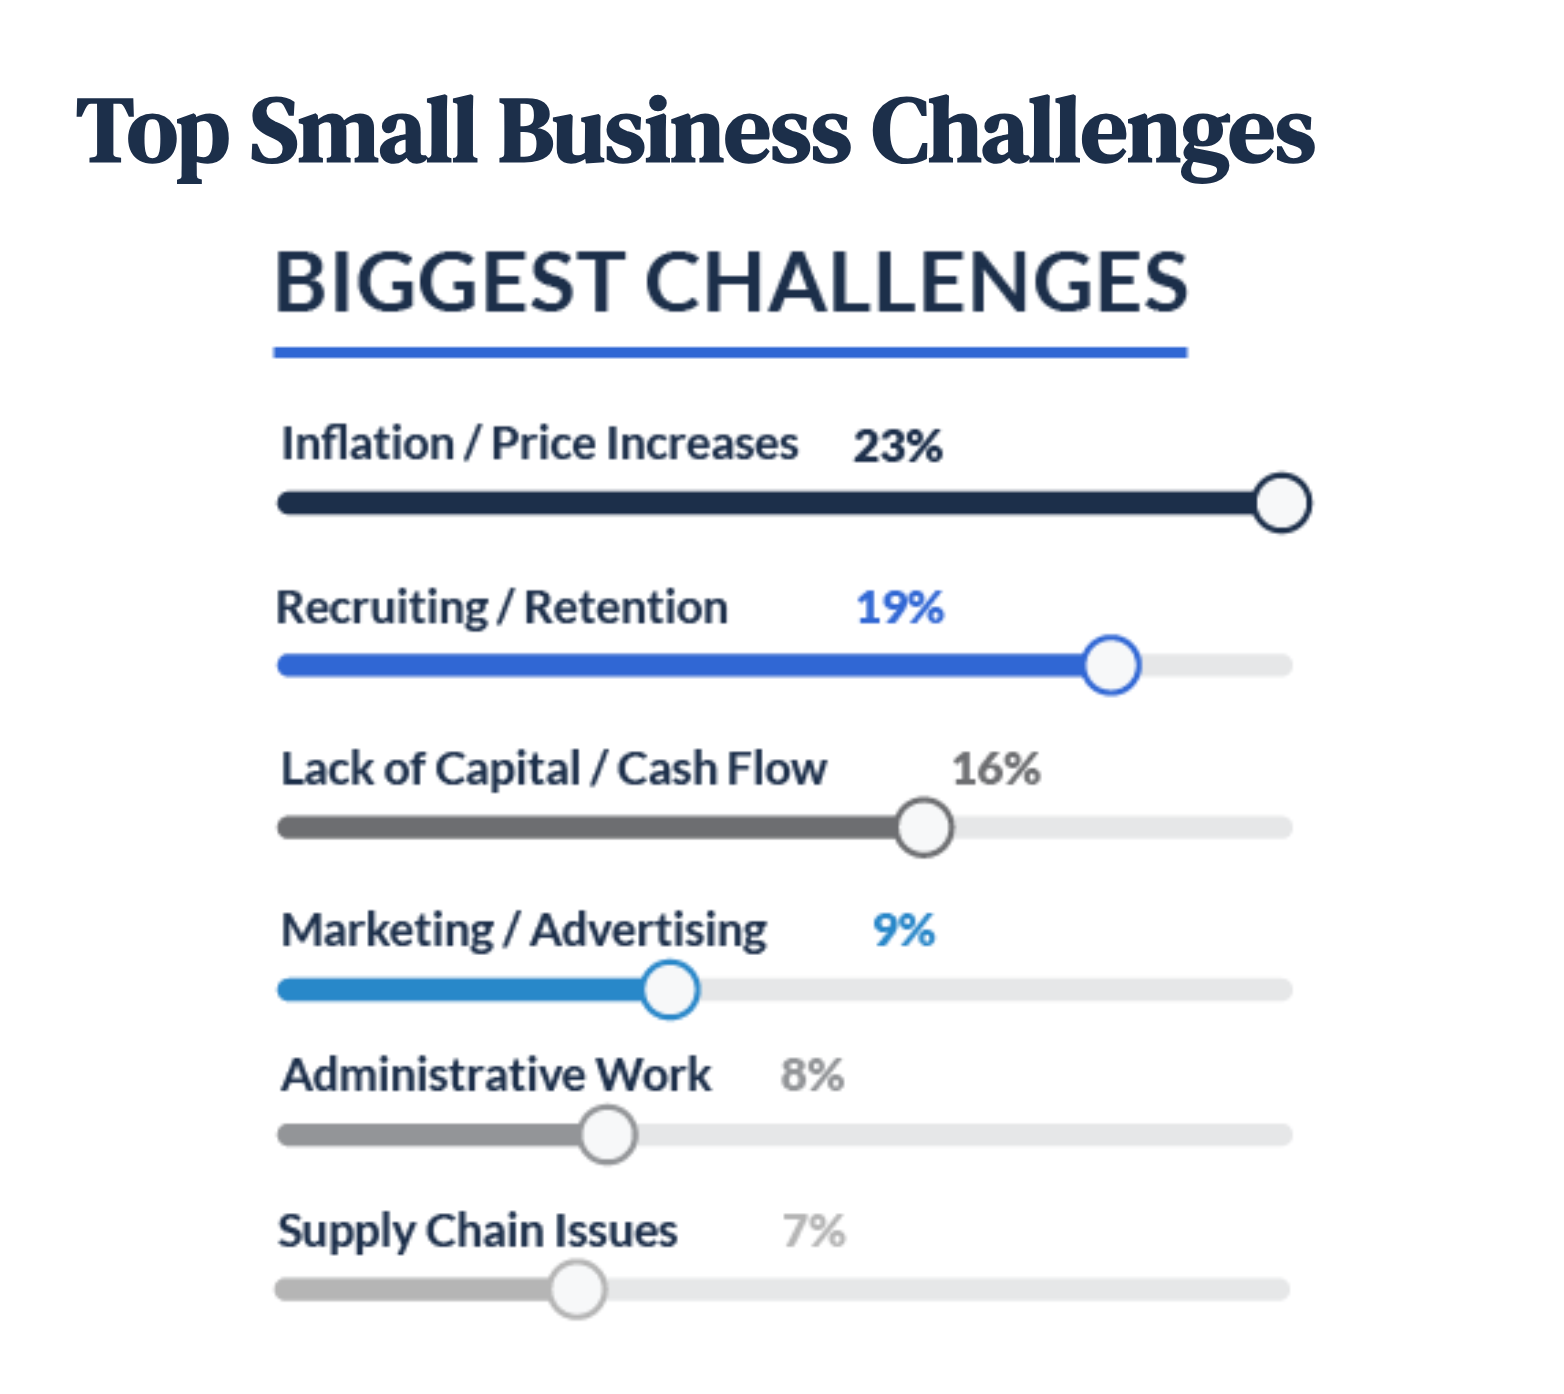
According to a 2024 NFIB survey, 25% of small businesses reported inflation as their single biggest challenge20.
Due to inflation, 20% of small businesses raised their average selling prices. Additionally, small business optimism on the NFIB Small Business Index decreased to 88.5, the lowest level since 2012.
Besides inflation, 19% of small businesses had recruitment and employee retention challenges in 2024.
16% also cited a lack of capital or cash flow as a key challenge. Other challenges included:
- Marketing and advertising - 9%
- Administrative work - 8%
- Supply Chain issues - 7%
20% of small business owners identified candidates' lack of work experience as a key challenge to their employment efforts.
This was followed by a low number of applicants or low interest, which was down 29% in 2024, signifying a positive shift in the job market. Other hiring challenges included:
- A lack of soft skills
- Competitive employment conditions
- A lack of technical skills
The most difficult positions to hire for in 2024 were in:
- Sales
- Construction and Maintenance
- Food Service
- Management
- Healthcare and Childcare
- Business and Financial Operations
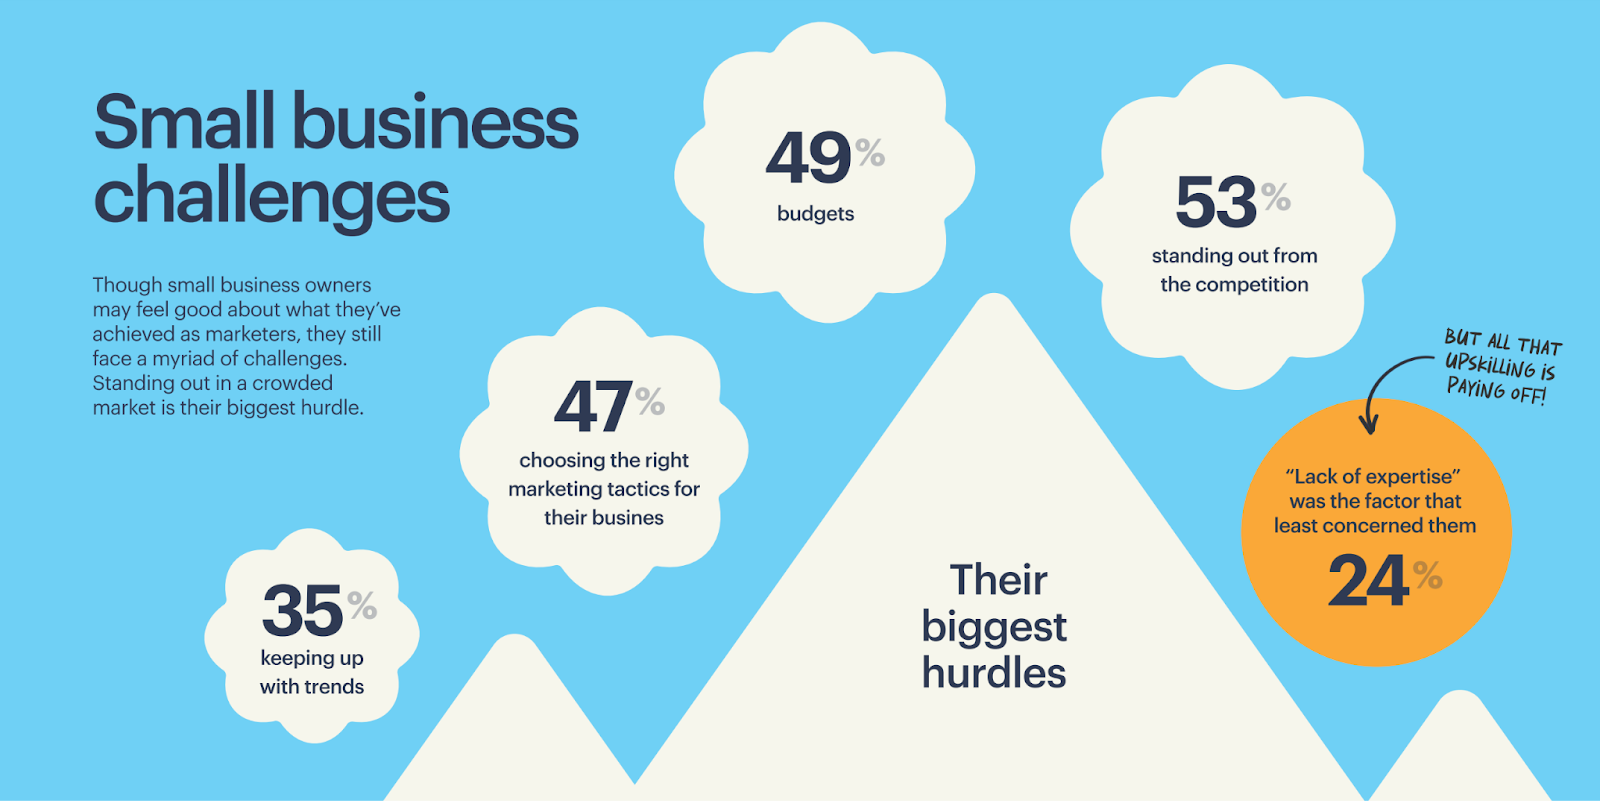
53% of small businesses considered standing out from the competition as a key challenge in 202421.
This was followed by:
- Marketing budgets - 49%
- Choosing the right marketing tactics - 47%
- Keeping up with relevant trends - 35%
45% of businesses recognized the need to improve their processes in 202422.
A further 42% saw the need to invest in human resources. Other top investment priorities included:
- AI - 38%
- Automation - 35%
- Partnerships - 23%
Small business financing statistics
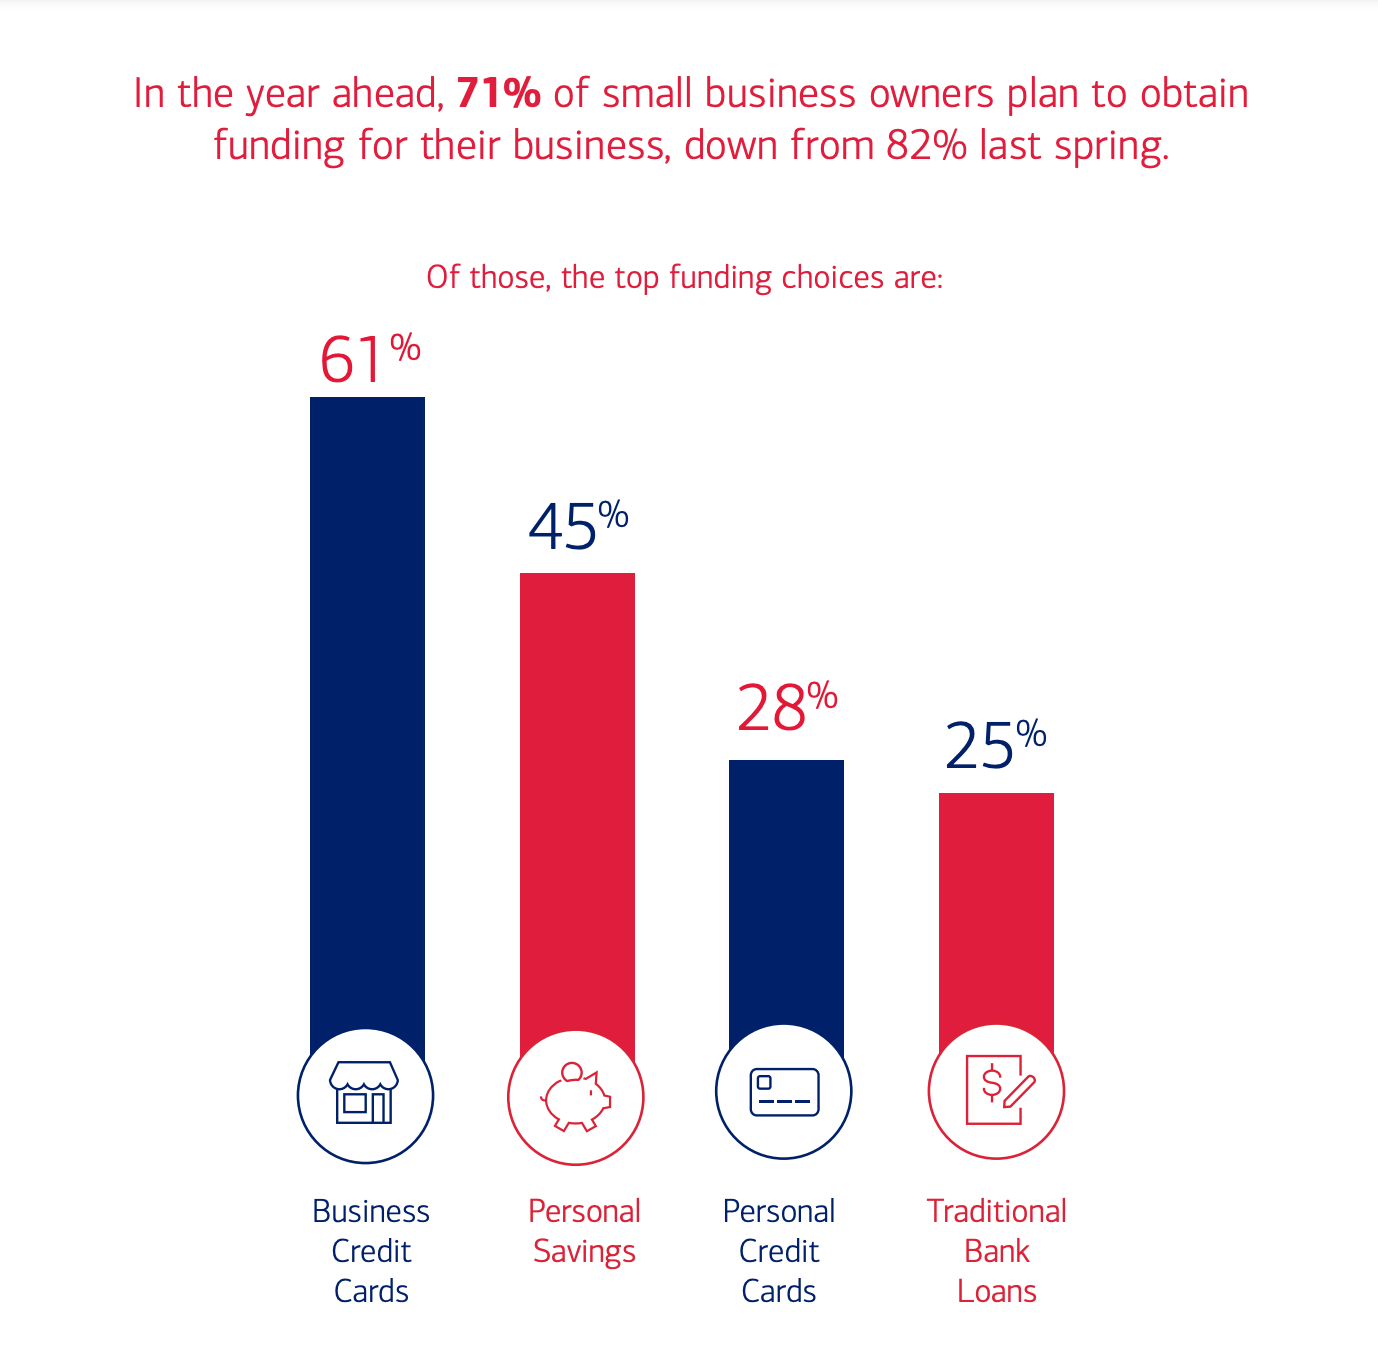
71% of small businesses planned to get funding in 2024, down from 82% in 2023.
The top funding sources were:
- Business credit cards - 61%
- Personal savings - 45%
- Personal credit cards - 28%
- Traditional bank loans - 25%
In March 2024, small business credit card balances were up 18% compared to the 2019 average.
With inflationary pressures making it more difficult for them to access bank loans, small businesses are turning to alternative forms of financing such as their credit balances.
While tightening standards for commercial and industrial loans eased to 20% at both small and large banks, small business loans were harder to access in 2023.
Loan approval rates moderated at big banks, institutional investors, and credit unions whereas approval rates at alternative lenders such as online lending fintechs hit peak levels.
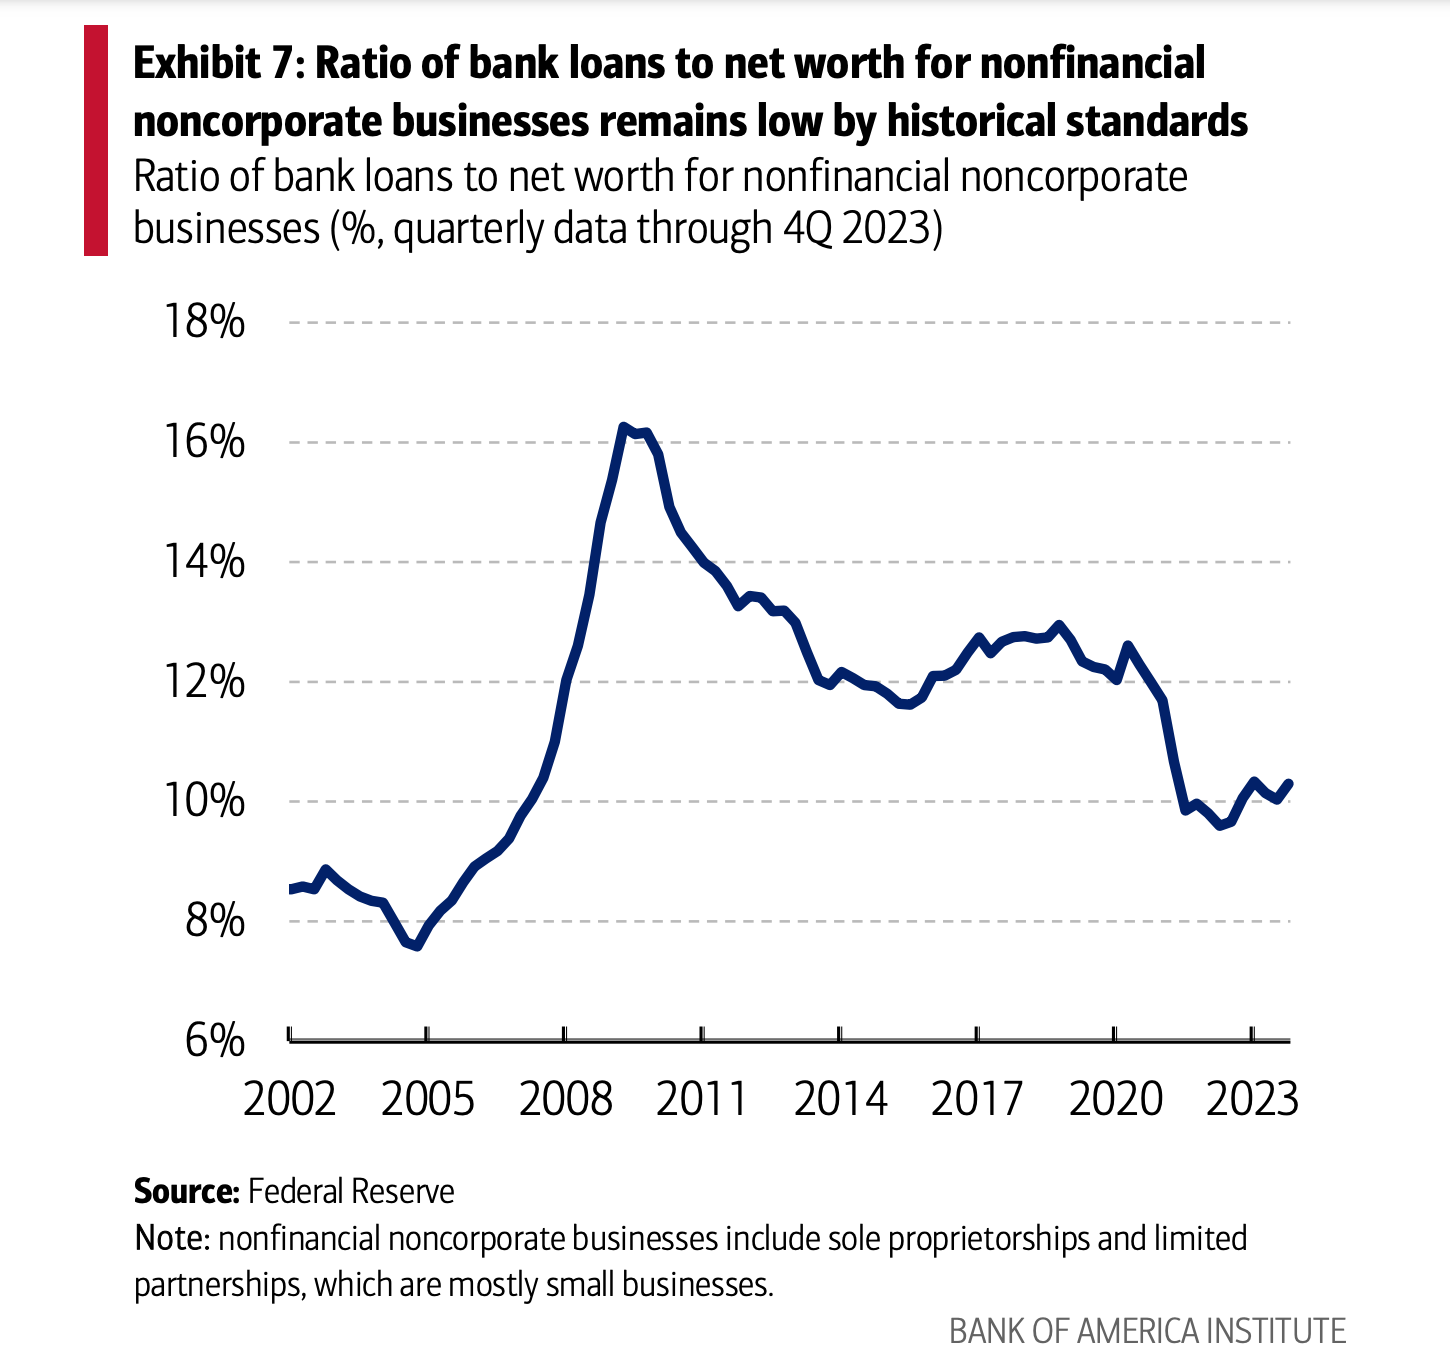
The ratio of total small business bank loans to net worth hit a record low of 10% in 2023.
This implies that small business balance sheet conditions were relatively healthy.
As of 2023, business financing in the US was primarily from equity financing (family, friends, or personal savings) or debt financing (bank loans).
- 71% of small businesses had outstanding debt.
- 33% of small businesses received equity financing.
- 28% of small employer firms received pandemic-related financial assistance, down from 87% in 2020.
As of 2022, 40% of small businesses, particularly in developing countries, had unmet financing needs amounting to over $5.2 trillion every year.
This was equivalent to 1.4 times the level of global MSME lending. The regions with the largest total global finance gaps were:
- East Asia and Pacific - 46%
- Latin America and the Caribbean - 23%
- Europe and Central Asia -15%
Small business owner statistics
77% of small business owners were confident that their businesses would be able to endure ongoing economic challenges in 2024.
18% were unsure, while 5% anticipated not surviving these challenges.
Small business owners stated the following factors as key concerns:
- Increased prices - 29%
- Loss of revenue - 17%
- Increased wages -11%
- Reducing labor costs - 7%
- Budget cuts - 6%
73% of small business owners reported being somewhat happy (37%) or very happy (36%). Overall, these levels of satisfaction represented a slight increase from 2023.
On the other hand, 12% of small business owners reported being somewhat unhappy (8%) or very unhappy (4%).
When asked about their top plans for 2024, the majority of small business owners (41%) said they planned to hire more staff.
Other priorities included:
- Digital Marketing
- Expanding or remodeling
- Traditional Marketing
- Other (IT, Accounting Services, Payroll services, etc.)
In 2024, most small business owners (28%) started their own ventures because they were ready to be their own boss.
Other key motivators included:
- Dissatisfaction with corporate America - 23%
- Pursuing their passion - 14%
- Having the opportunity - 11%
- Retirement - 9%
- Being laid off - 9%
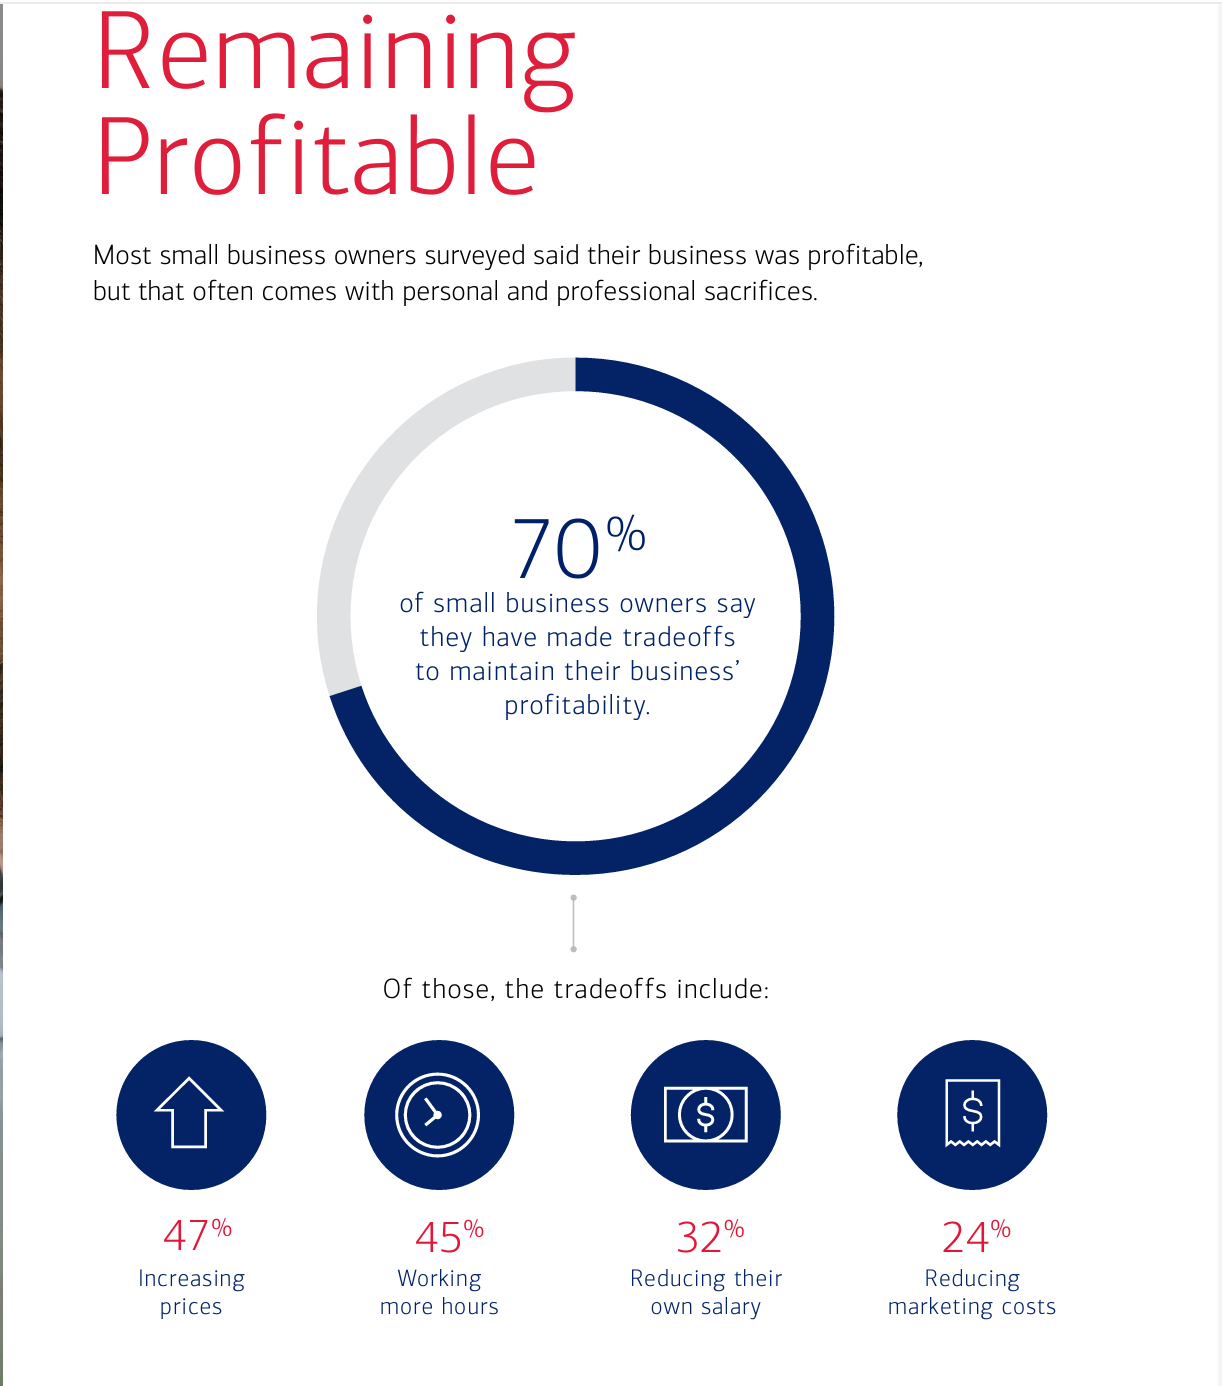
Over 70% of small business owners made trade-offs to maintain profitability.
Key trade-offs included:
- Increasing prices - 47%
- Working more hours - 45%
- Reducing their own salary - 32%
- Reducing marketing costs - 24%
There was a significant shift in business ownership in 2024, with Millennial business ownership increasing by 27% year over year.
Gen X accounted for 47% of all small business owners. Baby Boomers accounted for 37%, while millennials accounted for 16% of small business owners.
In terms of how small business owners pay themselves, a 2024 report found that small business owners needed to earn an average of $351,000 to feel successful in 202423.
- 65% of small business owners said they would be happy with less than $351,000.
- 16% said they needed to earn $1 million or more to feel successful.
- 11% said earning $25,000 for the year would be enough.
- 64% of small business owners were on track to meet their earnings for 2024
A 2024 report revealed that 55% of small business owners made more in 2023 than in 202224.
39% planned to expand their business, down 9% from 2023, while:
- 30% planned to hire more employees, down 4% from 2023.
- 16% planned to apply for a bank loan or credit, down 8% from 2023.
As of 2024, 79% of small business owners were confident in their marketing knowledge, with 71% saying they did all their marketing themselves.
63% of small business owners upskilled to understand marketing better in 2023. Meanwhile, 13% of small business owners planned to do so in 2024.
Small business consumer statistics
78% of consumers considered it important to buy from small businesses. In fact, 40% of consumers planned to shop small as much as possible in 2024.
Additionally, a majority of consumers (41%) stated that being able to support a local business was the key reason they bought from a small business.
46% of consumers regularly sought out small businesses in their communities. When asked about how often they shop small:
- 40% of consumers said once or twice a month.
- 36% said once or twice a week.
- 11% said every day.
The top 5 reasons consumers chose to support small businesses included:
- Location and convenience - 49%
- Product quality - 45%
- Price - 43%
- Wanting to support local - 41%
- Benefiting the local economy - 38%
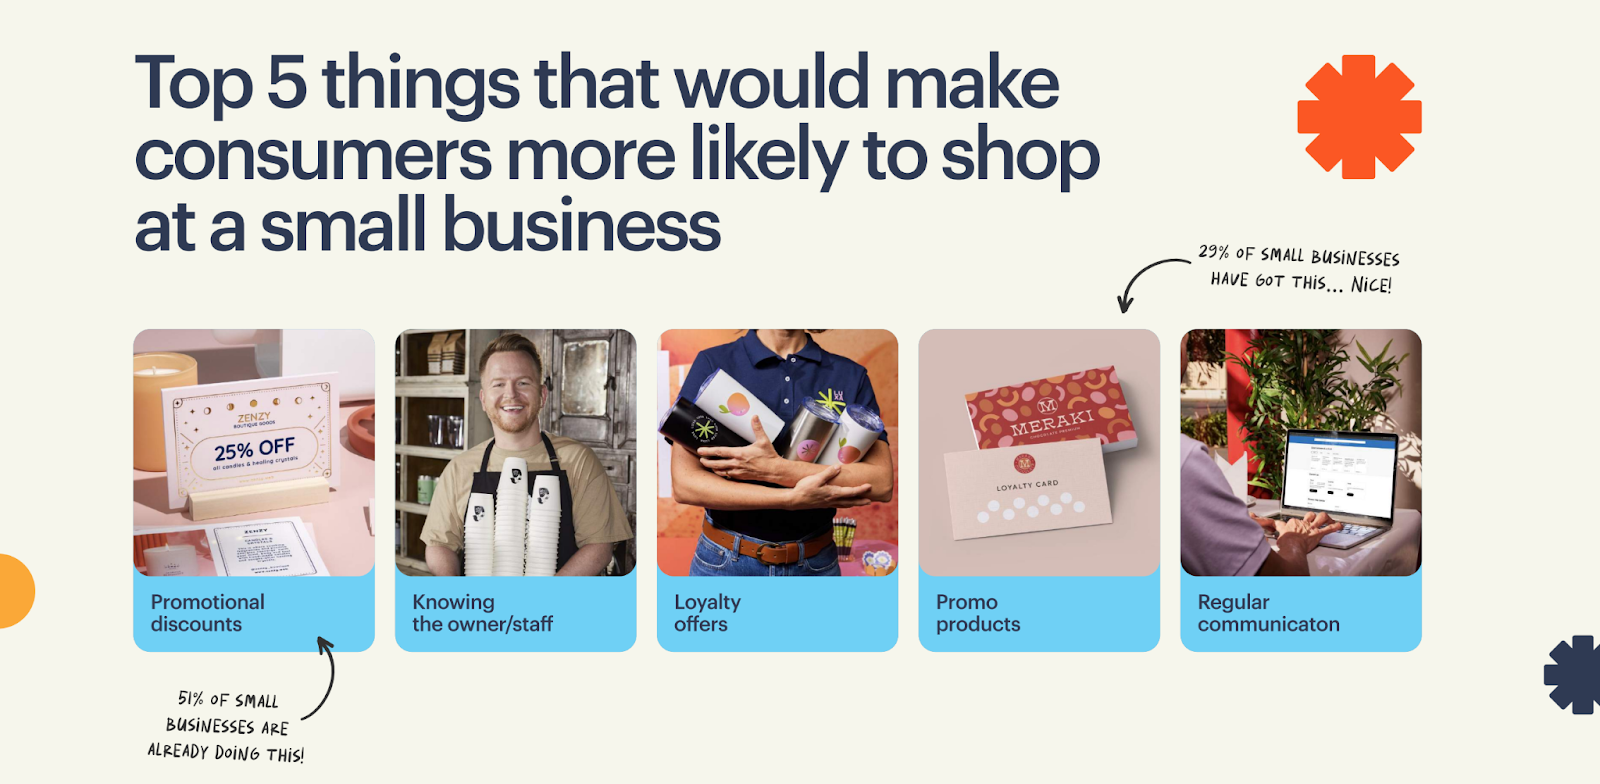
Promotional discounts and knowing the owner of a small business made consumers more likely to support a small business.
Other motivators included loyalty offers, promo products, and the regular communication of these special offers.
58% of consumers visited a local small business due to a recommendation from a friend or family member.
This was closely followed by walking past the store-front at 57%. Other top reasons were:
- Seeing a social media post - 42%
- Direct mail - 38%
- Outdoor signage, posters, and local ads - 37%
- Online search - 30%
- Local event - 28%
- Local print ads - 27%
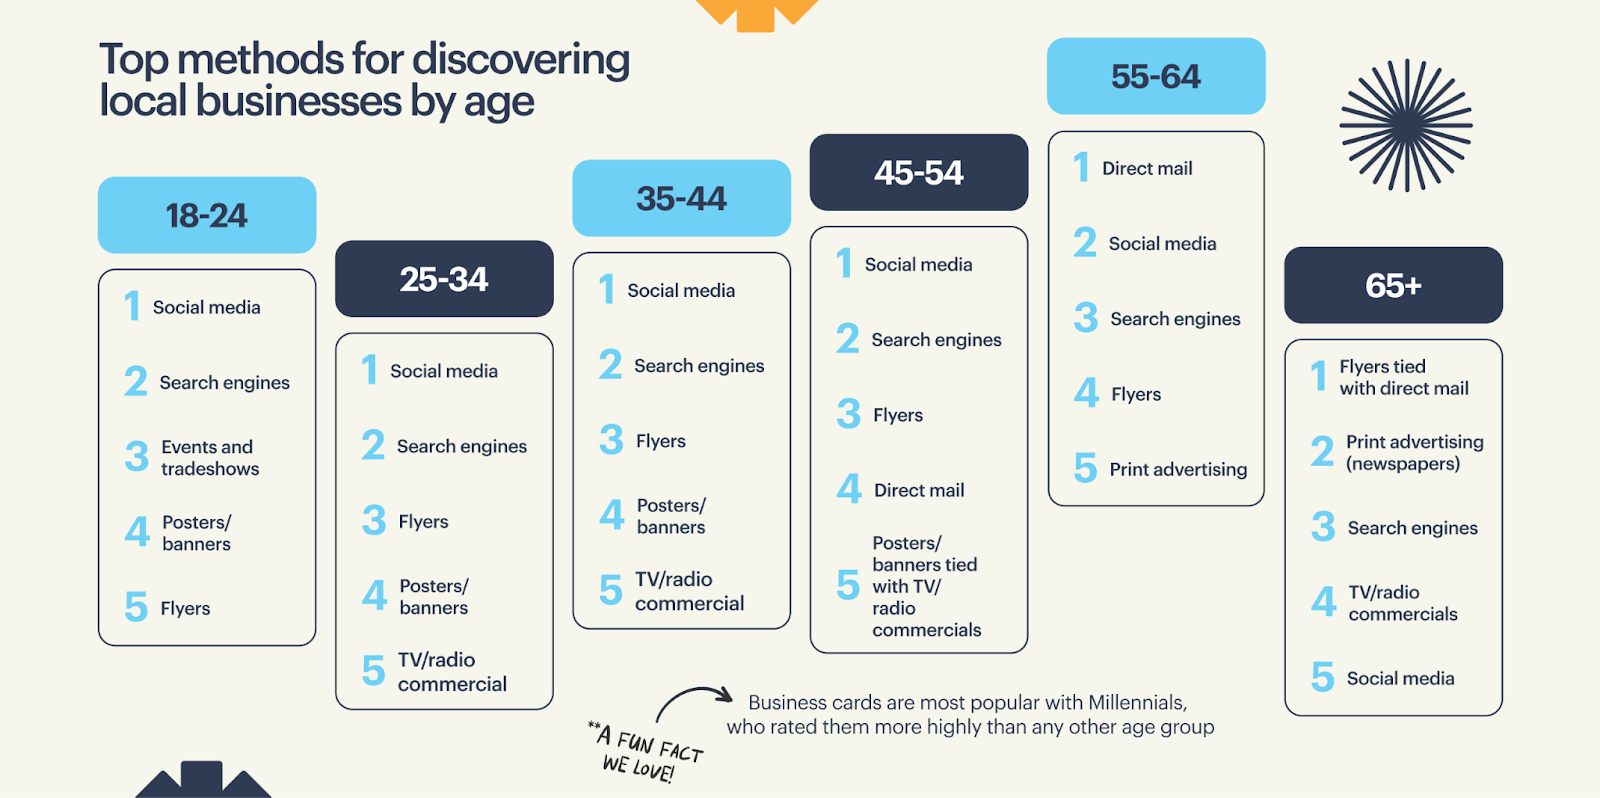
66% of consumers aged 18-24 and 69% of consumers aged 25-34% preferred to learn about small businesses through social media, followed by search engines.
A further 32% of younger consumers discovered new local small businesses at events. Older consumers, aged 55 years and older, preferred to learn about small businesses through direct mail and print advertising.
More than any other age group, Gen Z consumers preferred to support small businesses with close to 50% shopping small up to twice a week.
While 21% actively sought out new small businesses, 42% said they struggled to find small businesses in their area.
Small business marketing statistics
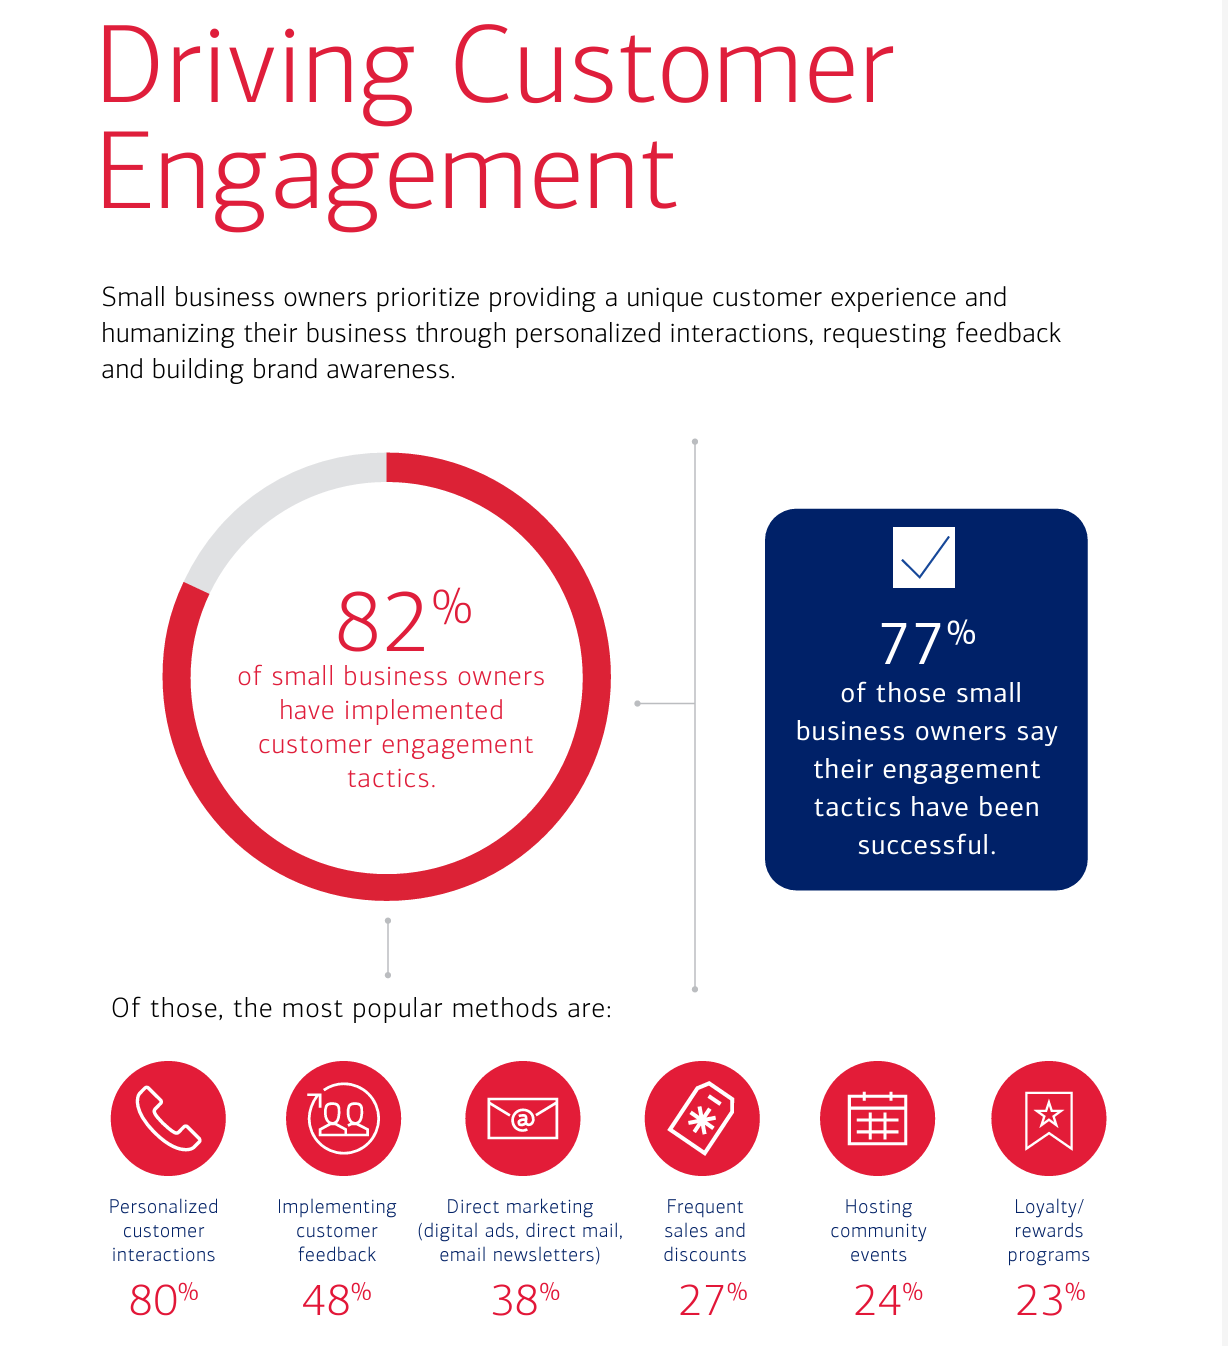
As of 2024, 82% of small business owners implemented customer engagement tactics, with 77% saying these tactics paid off.
The most popular engagement tactic was personalization, with 80% of small businesses using it. Other tactics included:
- Implementing customer feedback - 48%
- Direct marketing - 38%
- Frequent sales and discounts - 27%
- Hosting community events - 24%
- Loyalty rewards programs - 23%
79% of small businesses proactively gathered customer feedback in 2023.
A majority, (49%) monitored online review platforms. This was followed by compiling email feedback (41%) and requesting in-person feedback (40%)
In 2024, 65% of small business owners used social media to interact with customers and promote their business.
At 60% responding to comments and interactions from customers was the most common use of social media.
This was followed by:
- Posting about themselves and employees to humanize the business - 52%
- Posting about upcoming promotions and sales - 43%
- Interacting with other businesses and industry thought leaders - 38%
A 2024 Verizon report found that 48% of small business owners considered brand building as crucial to their success, while 25% thought their businesses already had effective brand awareness.
On the other hand, 16% of small business business owners who considered brand awareness important didn’t know how to build it for their business.
54% of all small businesses use social media to generate leads in 2023.
Additionally, 52% of small businesses found it hard to build customer loyalty. A further 51% of small businesses would invest in more marketing if revenue increased.
A Campaign Monitor study found that small businesses ranked customer acquisition as their top goal for 202425.
Customer retention came in second, followed by increasing the lifetime value LTV of customers. Other priorities included:
- Creating awareness
- Building a loyal fanbase
- Finding more prospects
- Increasing the average order size per customer
According to the same study, 57% of small businesses prioritized marketing and kept their marketing in-house.
21% had at least one employee doing marketing in addition to other tasks, while business owners were responsible for marketing in 15% of small businesses. Only 4.8% of small businesses used an outside agency.
The study also asked small businesses to rank their top strategies for building brand awareness. Social media, email marketing, and video marketing made the top 3.
Other strategies included:
- Content marketing
- Online paid media
- Digital display advertising
- Event marketing
- Influencer marketing
- Print advertising
- Podcast advertising
Social media and email marketing were also the top 2 tactics for gaining new customers.
In third and fourth place were online paid media and event marketing.
Across the board, small businesses planned to double down on the marketing tactics that worked best for them in 2024.
- 78% of small businesses planned to increase spending on digital marketing, followed by social media (73%) and email marketing (57%).
- A majority of small businesses (19%) planned to decrease spending on traditional marketing. This was followed by event marketing (11%) and email marketing (10%).
- On the other hand, 36% of small businesses planned to maintain their spending on traditional marketing, followed by email marketing (33%) and event marketing (33%).
Small businesses identified customer acquisition, increasing prospects, and increasing web traffic as their top 3 marketing challenges for 2024.
This was followed by:
- Increasing social media engagement
- Increasing conversions
- Customer retention
In terms of which channels small businesses used the most, Facebook took the lead at 70%. Email marketing followed closely behind at 64%.
Other top channels included:
- Direct mail - 52%
- Instagram - 48%
- Twitter (now X) - 47%
The top 3 marketing tactics small businesses found most difficult to use were influencer marketing, SEO, and digital paid media marketing.
For regular customer communications, a majority of small businesses (72%) used email. In second place, 60.8% used Facebook.
This was followed by
- Telephone - 56%
- Direct mail - 48%
- Instagram - 40%
The platform that provided the biggest return for small businesses between 2023 and 2024 was email marketing.
Facebook provided the second biggest return, followed by traditional marketing. Other high ROI channels included:
- Direct mail
- Content marketing
- Digital paid media marketing
- SEO marketing
78% of small businesses experimented with new marketing tactics in 2023, balancing digital with traditional marketing to reach new customers.
71% of small businesses said physical marketing tactics such as flyers, banners, and loyalty cards were important for connecting with new and existing customers. They also prioritized:
- Social ads - 60%
- Email marketing - 46%
- SEO - 50%
- Websites - 60%
Small business technology statistics
71% of small businesses adopted digital tools to future-proof their operations in 2024. Notably, 51% conducted business banking via digital channels.
45% also accepted more forms of digital payments. Additionally:
- 37% created and enhanced their social media presence.
- 27% implemented more digital-first marketing strategies.
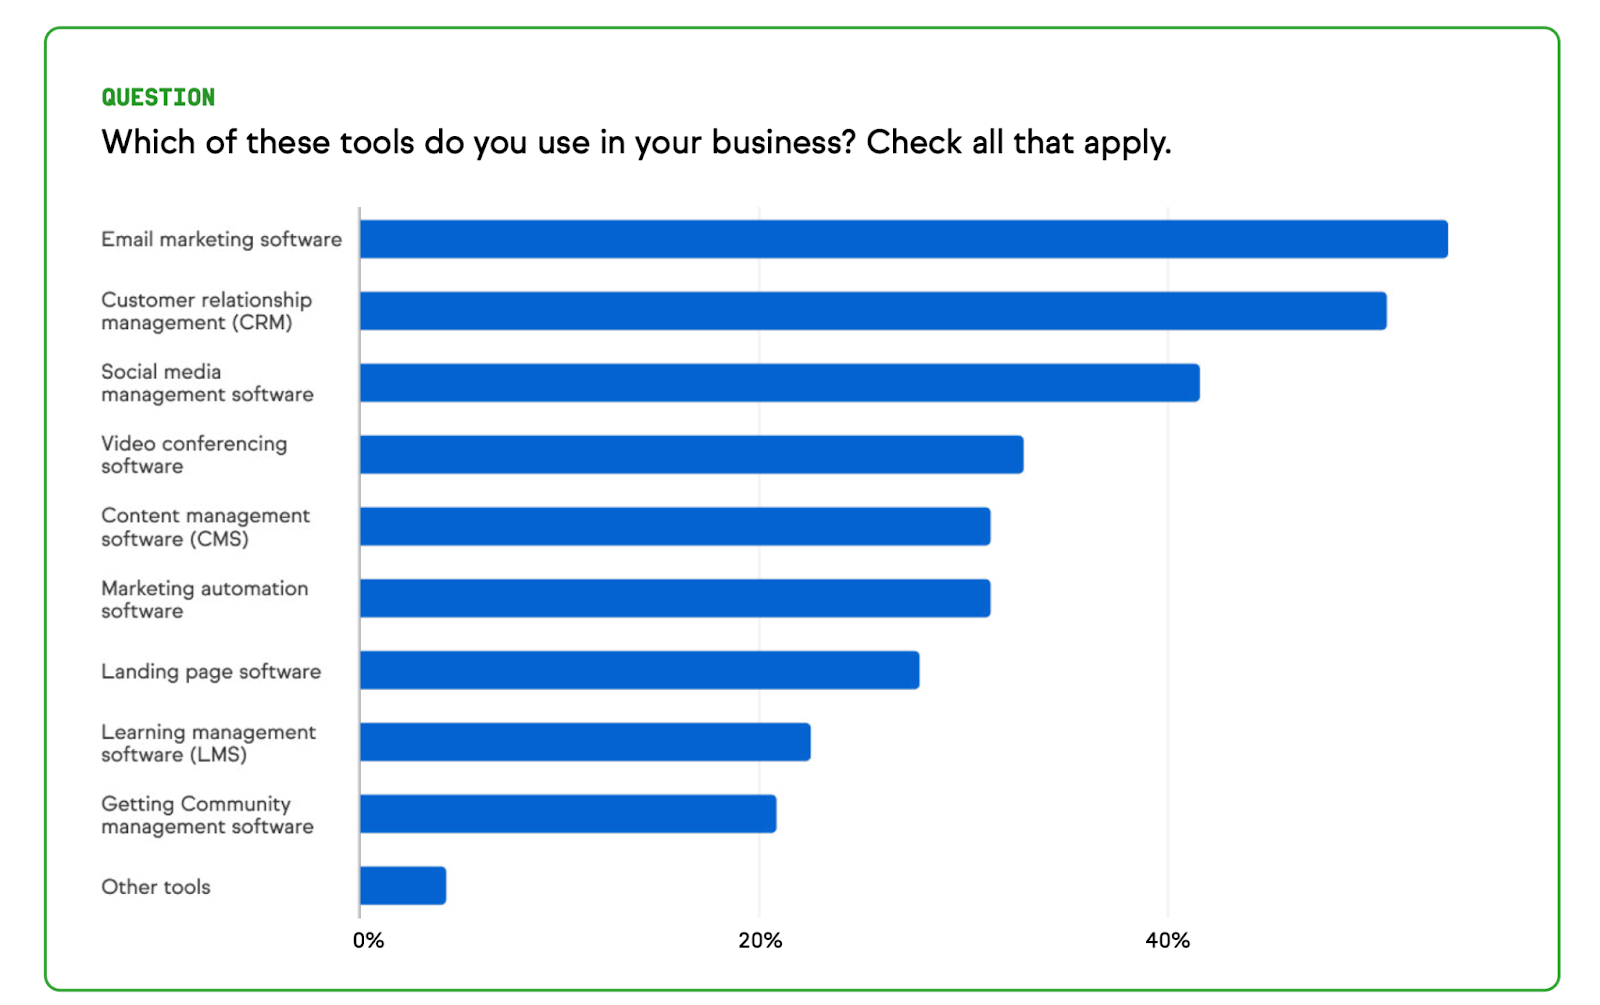
A majority of small businesses (over 50%) leveraged email marketing and CRM tools in 2024.
This was followed by:
- Social media management software - 42%
- Video conferencing software - 35%
- Content management software - 30%
- Marketing automation software - 30%
71% of small businesses that made upgrades to their tech stacks in 2024 said this helped them address key business challenges26.
The upgrades resulted in positive outcomes such as cost savings (66%) and incremental revenue (52%).
Over 52% of successful small businesses planned to increase their software budgets compared to only 40% of underperformers.
Software investments were considered a strategic necessity for enhancing operational efficiency, increasing customer engagement, and ensuring data security.
Small Business AI Statistics
In the US, between 2023 and 2024, 4.6% of all businesses used AI.
The most likely to use AI were businesses with more than 250 employees (6.3%), followed by those with fewer than 5 employees(5%). Over 6% of businesses planned to use AI in the next 6 months.
Meanwhile, 83% of small business owners did not use AI.
Meanwhile, of the 17% that incorporated AI into their operations:
- 21% used writing tools like ChatGPT
- 4% used image generation tools
- 2% used inventory management tools.
37% of small business owners planned to use AI in 2024, a 12% drop from 2023.
- 47% hoped to differentiate themselves from competitors.
- 36% planned to streamline payroll and bookkeeping
- 25% planned to use AI to assist with their hiring efforts.
45% of small businesses said AI helped them save time and focus on their core business.
However, 45% of small businesses expressed concern about the cybersecurity risks of integrating AI into their operations.
Successful small businesses were 2x more likely than underperformers to use AI.
84% of successful small businesses reported that AI had positively impacted their revenue compared to 65% of underperformers.
Small Business Cybersecurity Statistics
50% of all cyberattacks globally target small businesses27.
Over the past decade, 60% of small businesses closed down within six months of falling victim to a data breach or cyberattack. With cybercrime costs set to increase by 5% per year between 2024 and 2026, it’s imperative for small businesses to prioritize cybersecurity.
As of 2024, 60% of small businesses said that cybersecurity threats, including phishing, malware, and ransomware were a top concern.
However, only 25% of small businesses had cyber insurance.
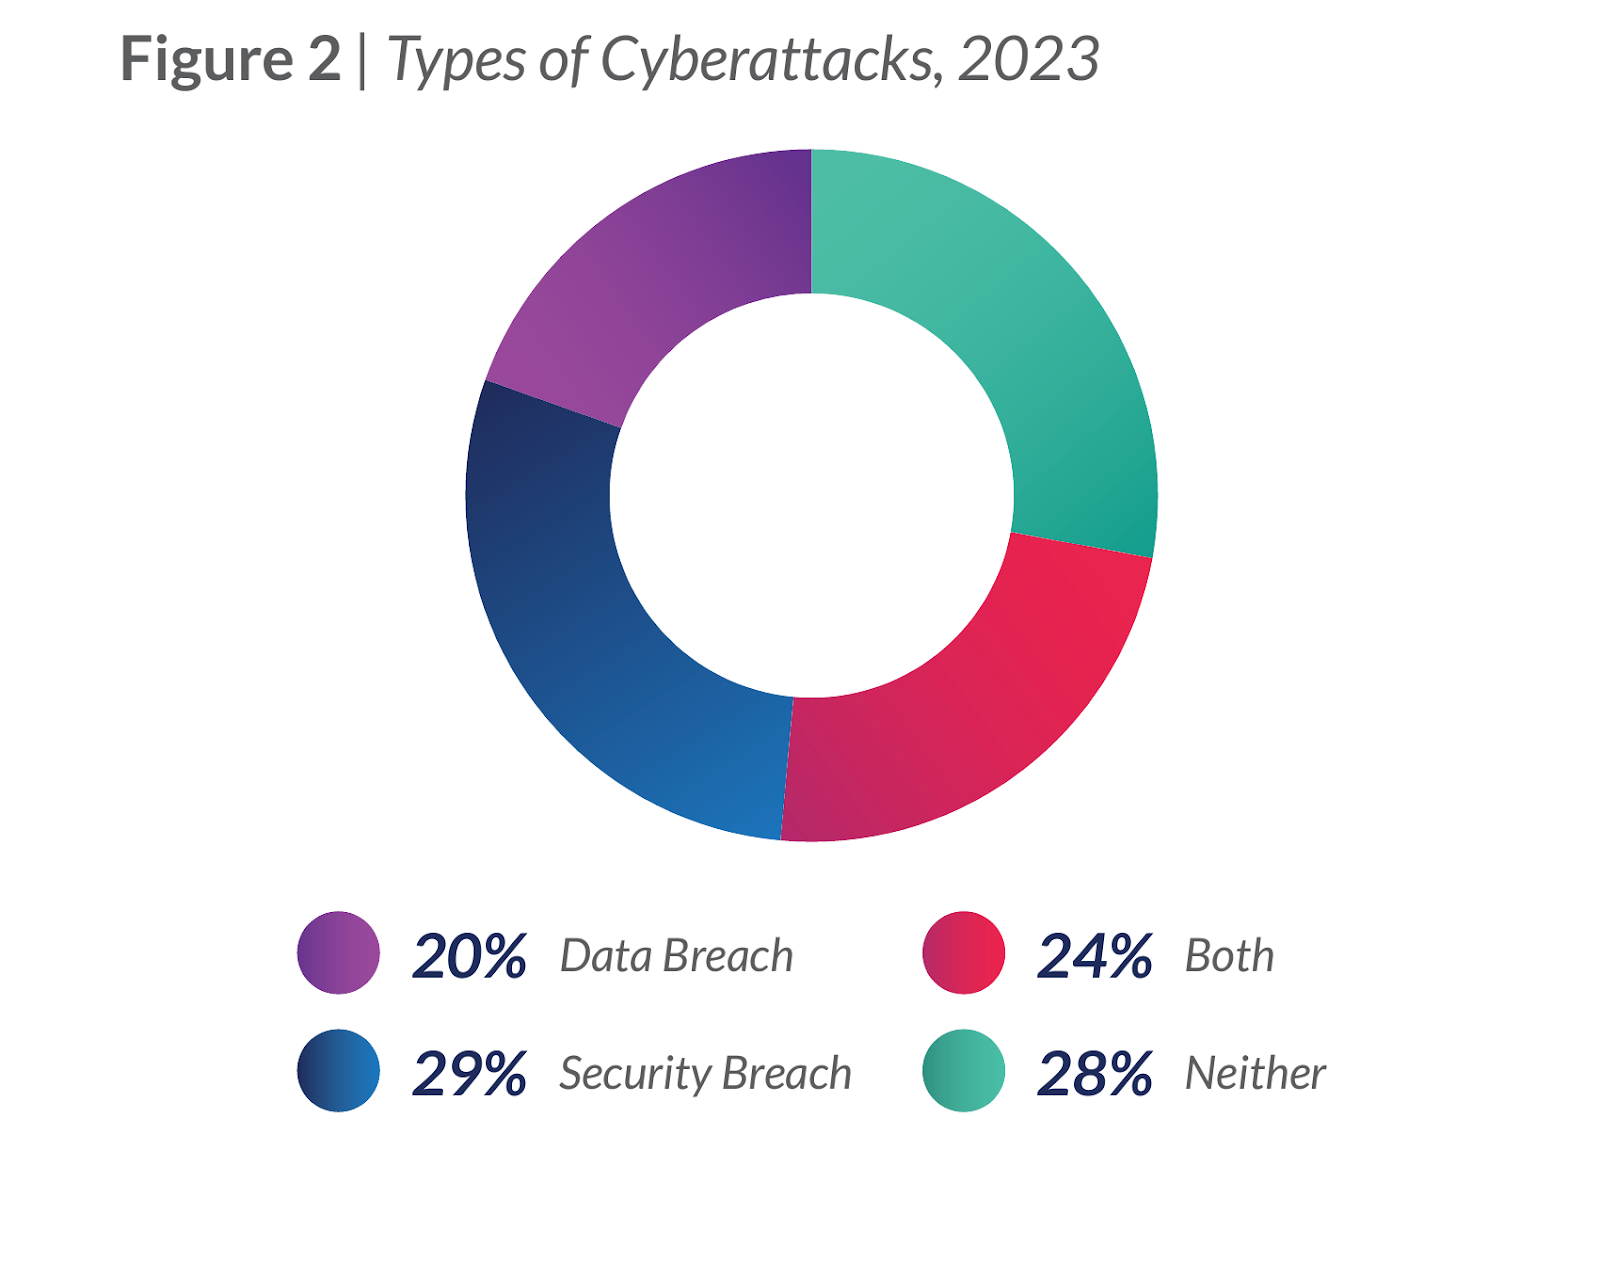
Cyberattacks experienced by small businesses increased by 28% in 202328.
29% were security breaches, while 20% were data breaches. In addition, the top root causes were:
- External attackers - 30%
- Malicious insiders - 30%
- 3rd party vendors - 24%
- Remote workers - 21%
A majority of small businesses (47%) experienced cybercrime losses of less than $250,000, up 4% since 2022.
26% suffered losses of $250,000-$500,000, while 13% suffered losses of $500,000.
50% of small businesses reported taking steps to prevent future breaches in 2023.
- 65% provided new training for staff.
- 54% increased security.
- 53% implemented new security tools.
Small business sustainability statistics
81% of small business owners implemented sustainable business practices in 2024, up from 75% in 2023.
The most common sustainability practices amongst small businesses included:
- Minimizing paper use - 68%
- Establishing more environmentally friendly habits, such as recycling and limiting plastic usage - 57%
- Using hybrid work to reduce transportation needs - 30%
- Working with sustainable vendors and suppliers - 25%
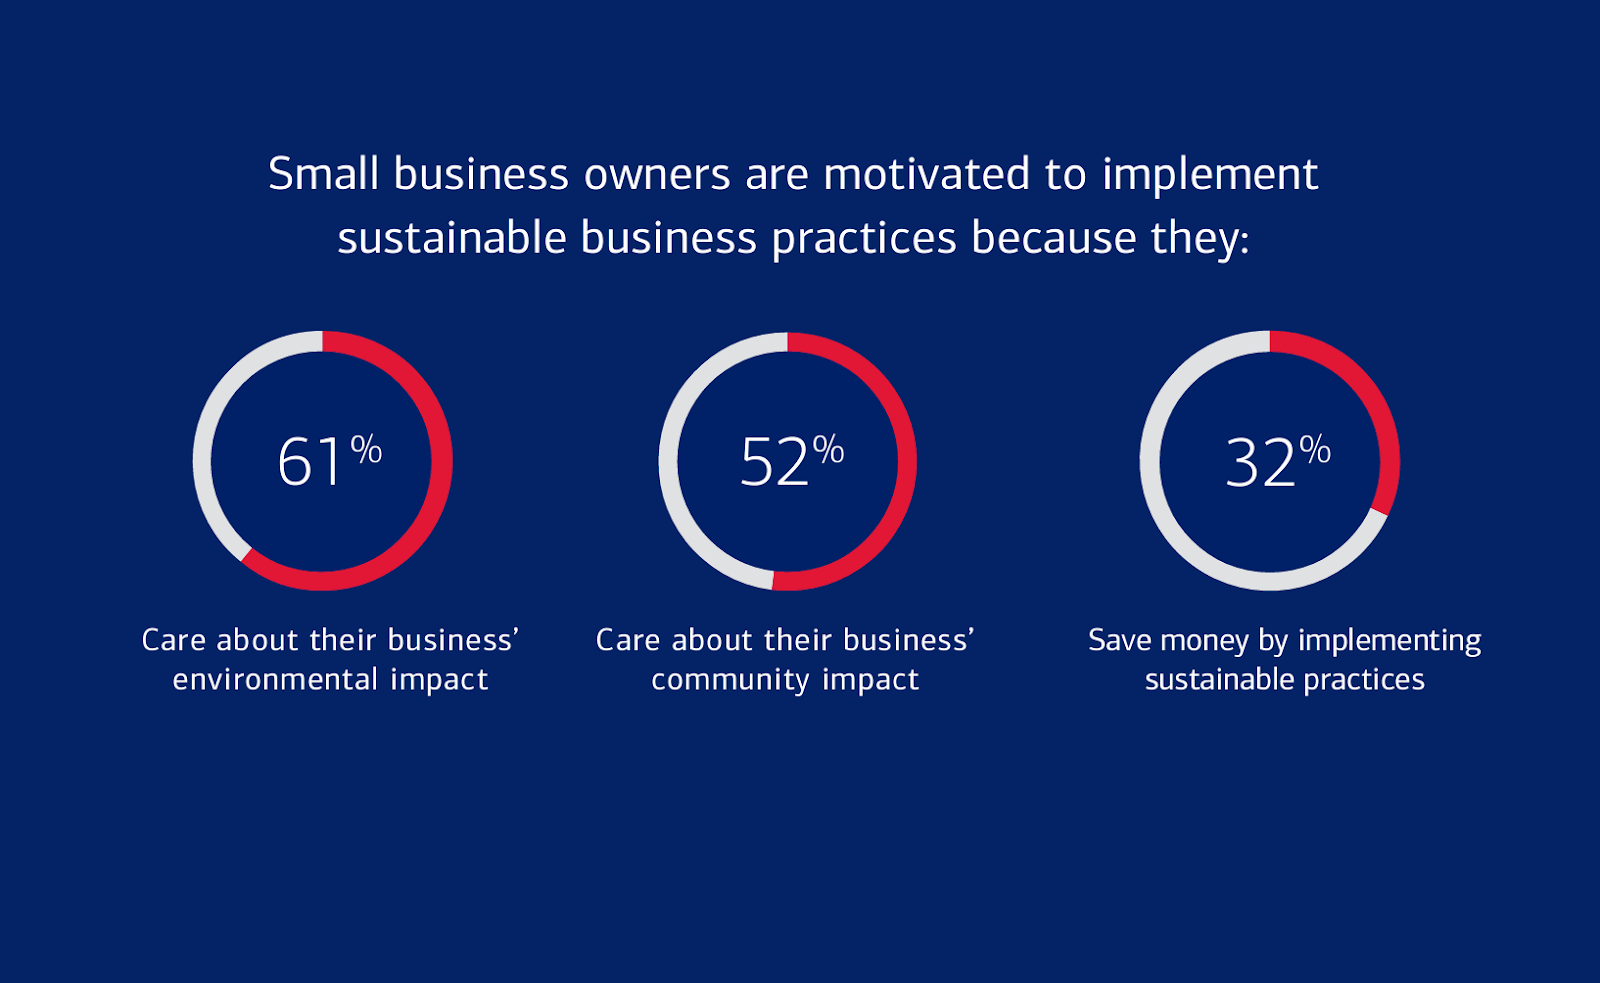
71% of small business owners were committed to implementing sustainable business practices in 2024.
Key reasons included:
- Caring about their business's environmental impact - 61%
- Caring about community impact - 52%
- Saving money - 32%
Additionally, 67% of these small business owners actively measured the success of their efforts through:
- Customer feedback - 54%
- Lower operational expenses - 47%
- Increased sales - 31%
69% of small businesses experienced challenges with implementing sustainable business practices.
The main challenges were:
- Increased costs - 44%
- Customer frustration with higher prices - 20%
- Customer indifference - 18%
Launch your small business with Whop
If you're looking to launch your own small business, you should check out Whop. Whop is a social commerce platform for digital creators. With Whop, you can create almost anything online - from private communities, to online course, ebooks, mentoring, coaching, and more.
Create your own whop hub, add the features you need, and run your business, your way.
Sources