Discover over 100 affiliate marketing statistics covering top niches, average earnings, and other key insights to drive your efforts.
Key takeaways
- SEO is the dominant traffic strategy for 78% of affiliates, with experienced marketers relying on it even more heavily.
- Education and e-learning is the most profitable niche, averaging $15,551 monthly—significantly outpacing other categories.
- Experience dramatically impacts earnings: affiliates with 6-10 years make 2,000% more than beginners, emphasizing long-term commitment.
Currently worth over $18 billion, the affiliate marketing industry is expected to shoot past $30 billion by 2030. This substantial growth presents a wealth of opportunities for affiliates and businesses to not only diversify but increase their revenue streams.
Whether you’re a creator, entrepreneur, or business looking to tap into this thriving space, you’re in the right place. We’ve drawn on industry reports and other trusted sources to bring you 100+ affiliate marketing statistics for 2026.
Read on to discover proven strategies, average earnings, top-performing niches, and more to empower your decision-making.
Affiliate marketing industry statistics
According to Cognitive Research, the global affiliate marketing industry is expected to grow at a compound annual growth rate (CAGR) of 8% to over $31 billion in 20311.
By region:
- North America’s market is expected to grow at a 6.2% CAGR to $11.3 billion in 2031.
- Europe’s affiliate market is expected to grow at a CAGR of 6.5 % to $8.6 billion in 2031.
- The Asia Pacific market is projected to grow at a 10% CAGR to $8.4 billion in 2031.
- South America’s market is expected to grow at a CAGR of 7% to $1.5 billion in 2031.
- The Middle East and Africa market is expected to grow at a CAGR of 7% to $590 million in 2031.
The affiliate marketing industry was worth an estimated $15.7 billion in 2024, up 12% from $14 billion in 2023 and a whopping 441% from $2.9 billion in 20132.
Cognitive Research pegged the affiliate industry’s value higher at over $18.5 billion in 2024.
Additionally, the report revealed that:
- North America had the largest global affiliate market share at $7.4 billion or 40%.
- Europe’s affiliate market was valued at more than $5.5 billion in 2024 and accounted for over 30% of the global market share.
- Asia Pacific had a market share of around 23% and the affiliate industry was valued at $4.3 billion in 2024.
- South America’s affiliate market was worth over $925 million, a 5% share of the global market.
- The Middle East and Africa had a market size of $370 million or a global market share of 2% in 2024.
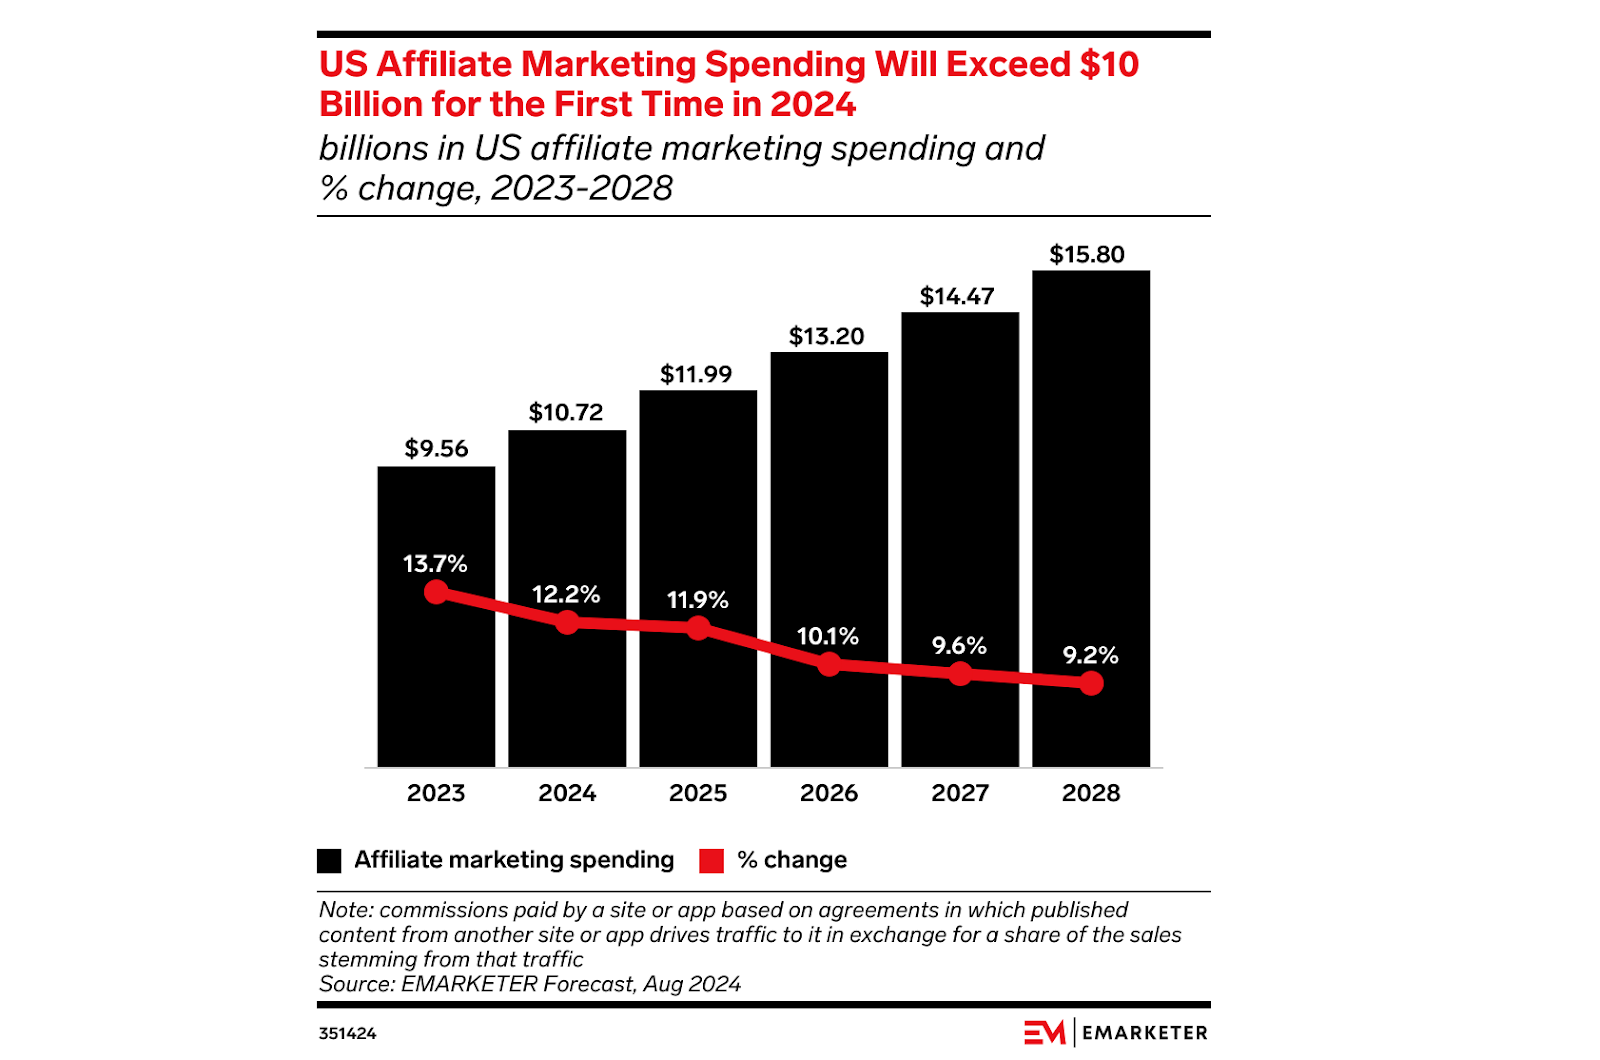
In 2024, affiliate spending in the US alone was over $10.7 billion.
Estimates place spending at close to $12 billion in 2025 and over $15 billion in 2028.
By the end of 2024, affiliate marketing companies had raised more than $1.6 billion in investment across 301 funding rounds3.
This was a 7% increase from $1.5 billion in funding over 232 rounds in 2021.
Globally, there were an estimated 9,600 affiliate-based service providers in 2023.
47% or 4500 of these were based in North America, additionally:
- 24% or 2,300 were based in APAC.
- 20% or 1,900 were based in Europe.
- 9% or 900 were based in Africa.
Between 2020 and 2022, searches for affiliate marketing surged by more than 264%.
In 2017, there were 770,347 searches for the term in the US alone. However, searches dipped by 11% to 683,664 in 2019 before rebounding by 92% to 1.31 million in 2021.
Affiliate marketing network statistics
Over 118,621 companies made up the global affiliate networks industry in 20254.
There were also 65 technologies and 60 companies producing affiliate network technologies.
Amazon Associates was used by over 58% of affiliates in 2024, making it the most popular affiliate network5.
Used by 25% of affiliates, Clickbank was the second most popular affiliate network. In third and fourth place were ShareASale (22%) and CJ (21%) respectively.
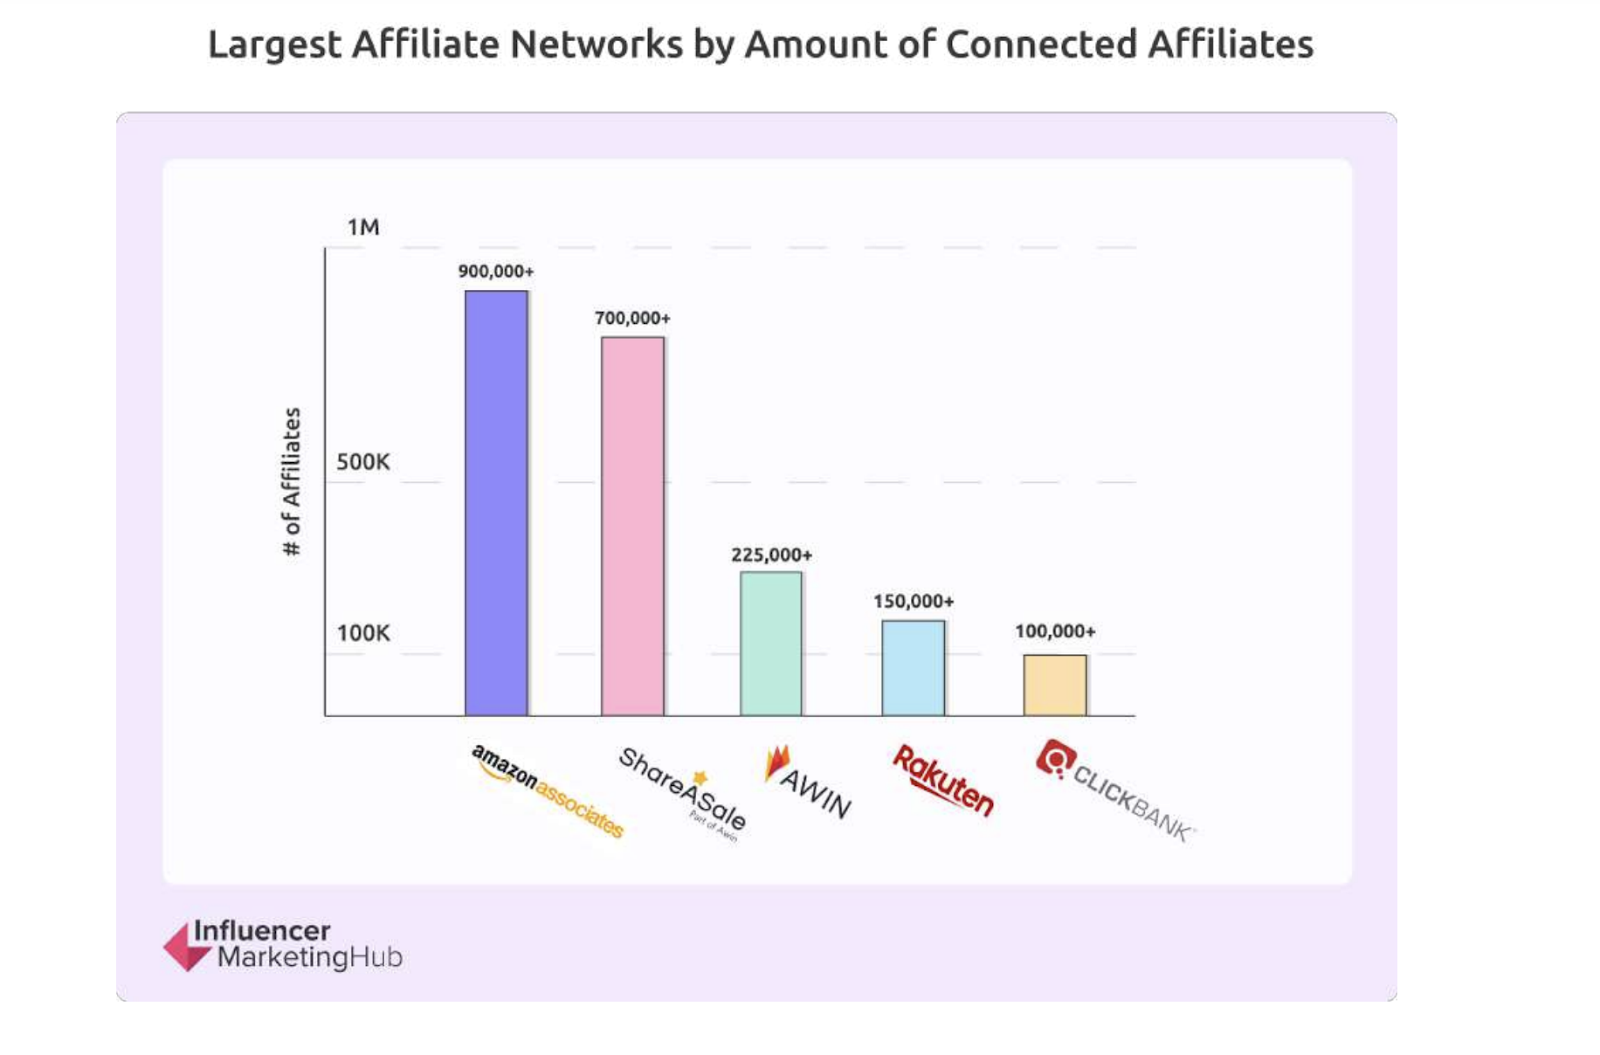
In 2023, over 900,000 affiliates used Amazon’s affiliate marketing program, making it the largest in the world.
This was closely followed by ShareASale with over 700,000 affiliates, and:
- Awin with over 225,000 affiliates.
- Rakuten with over 150,000 affiliates.
- ClickBank with over 100,000 affiliates.
Amazon had a 22% market share in 2023. With a 12% market share, Commission Junction was next in line.
This was followed by:
- A8.net (8.1%)
- AWIN (6%)
- Hotmart (5%)
- GoAffPro (5%)
As the largest affiliate network, Amazon Associates also had the most sites (over 215,129).
AB.net and Commission Junction were in second and third place with 129,409 and 80,063 sites respectively. Other key networks included:
- AWIN with 59,335 sites.
- Hotmart with 53,154 sites.
- GoAffPro with 45,882 sites
- Rakuten Affiliate with 34,116 sites.
- Affiliate Window with 32,324 sites.
68% of affiliate marketers making between $2,500 and $10,000 used the Amazon Associates Network.
Amazon Associates network was also popular among 67% of affiliates making between $100-$500 per month and 63% of those making $500-$2,500.
However, Amazon was not as popular with affiliates making under $100 (55%) and over $10,000 (49%) monthly.
In 2023, 73% of marketers used SaaS platforms instead of affiliate networks to manage their efforts.
This represented a major shift from the use of affiliate network sites for managing and tracking affiliate marketing performance.
Key affiliate statistics
As of 2024, over 77% of affiliates were solopreneurs with no team members.
Around 17% of affiliates had 2-5 team members. Additionally, the average team size was 2.3 people. Overall, around 95% of affiliate marketers worked in teams of 5 or fewer.
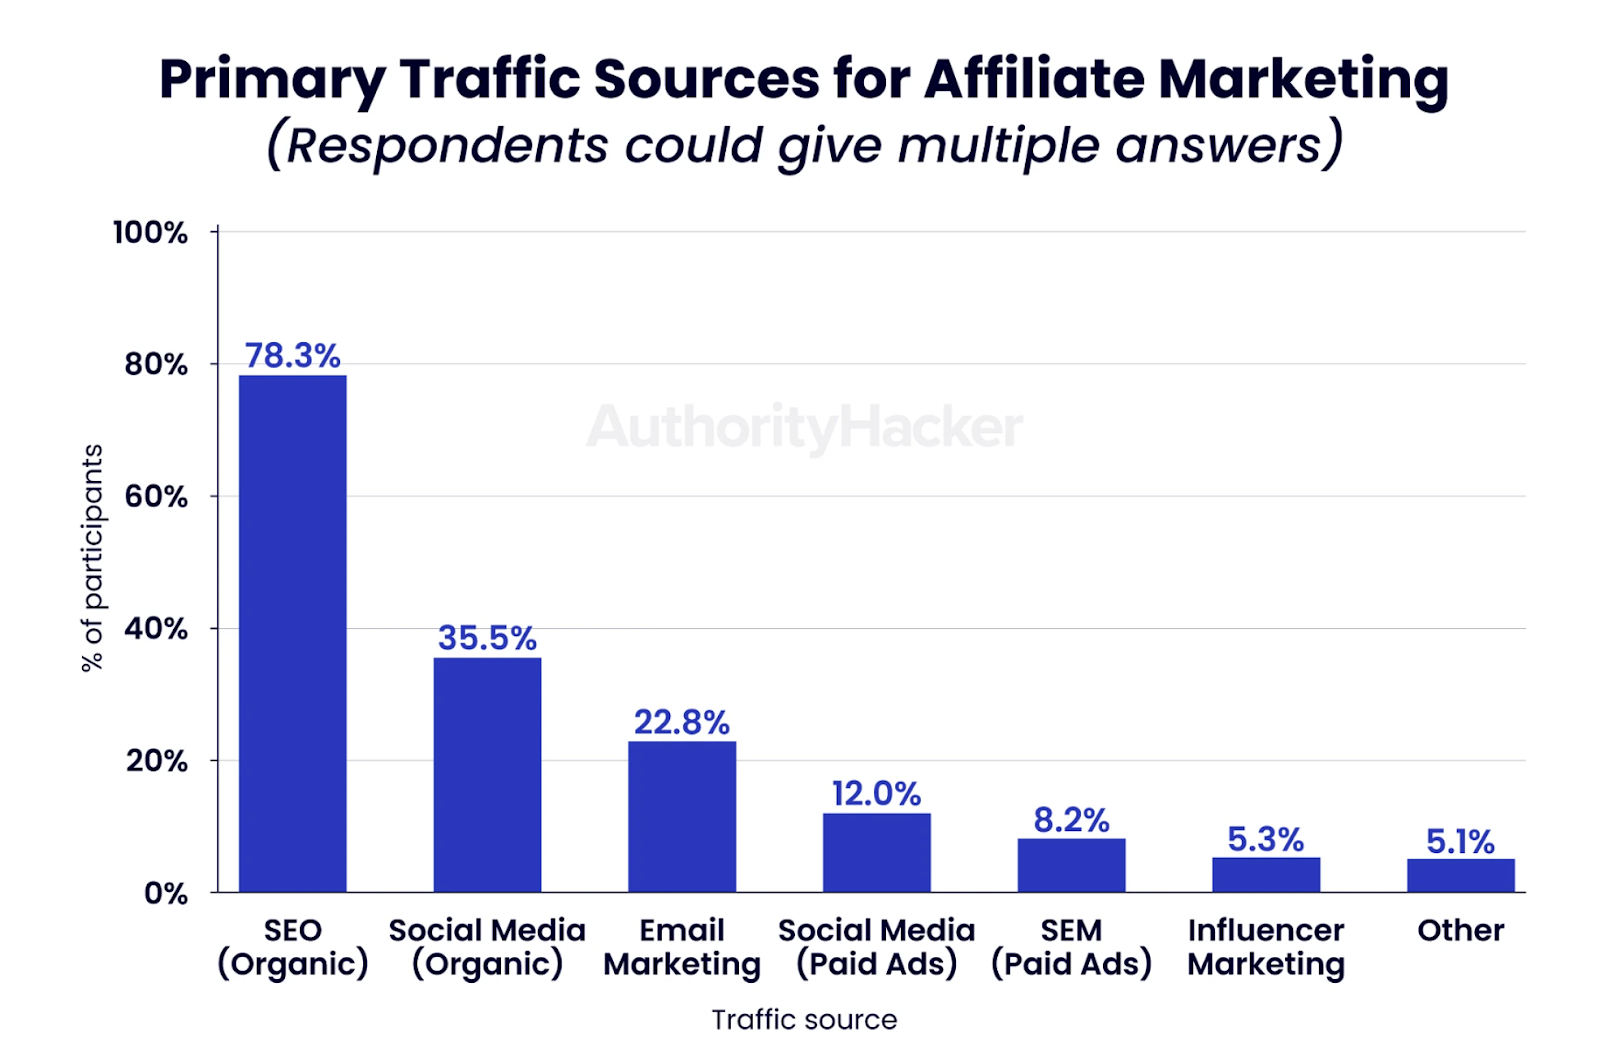
78% of affiliates used organic SEO as a primary traffic source in 2024.
Organic social media came in next at 40%, followed by email marketing (23%), paid social media ads (12%), SEM paid ads (8%), and influencer marketing (5%).
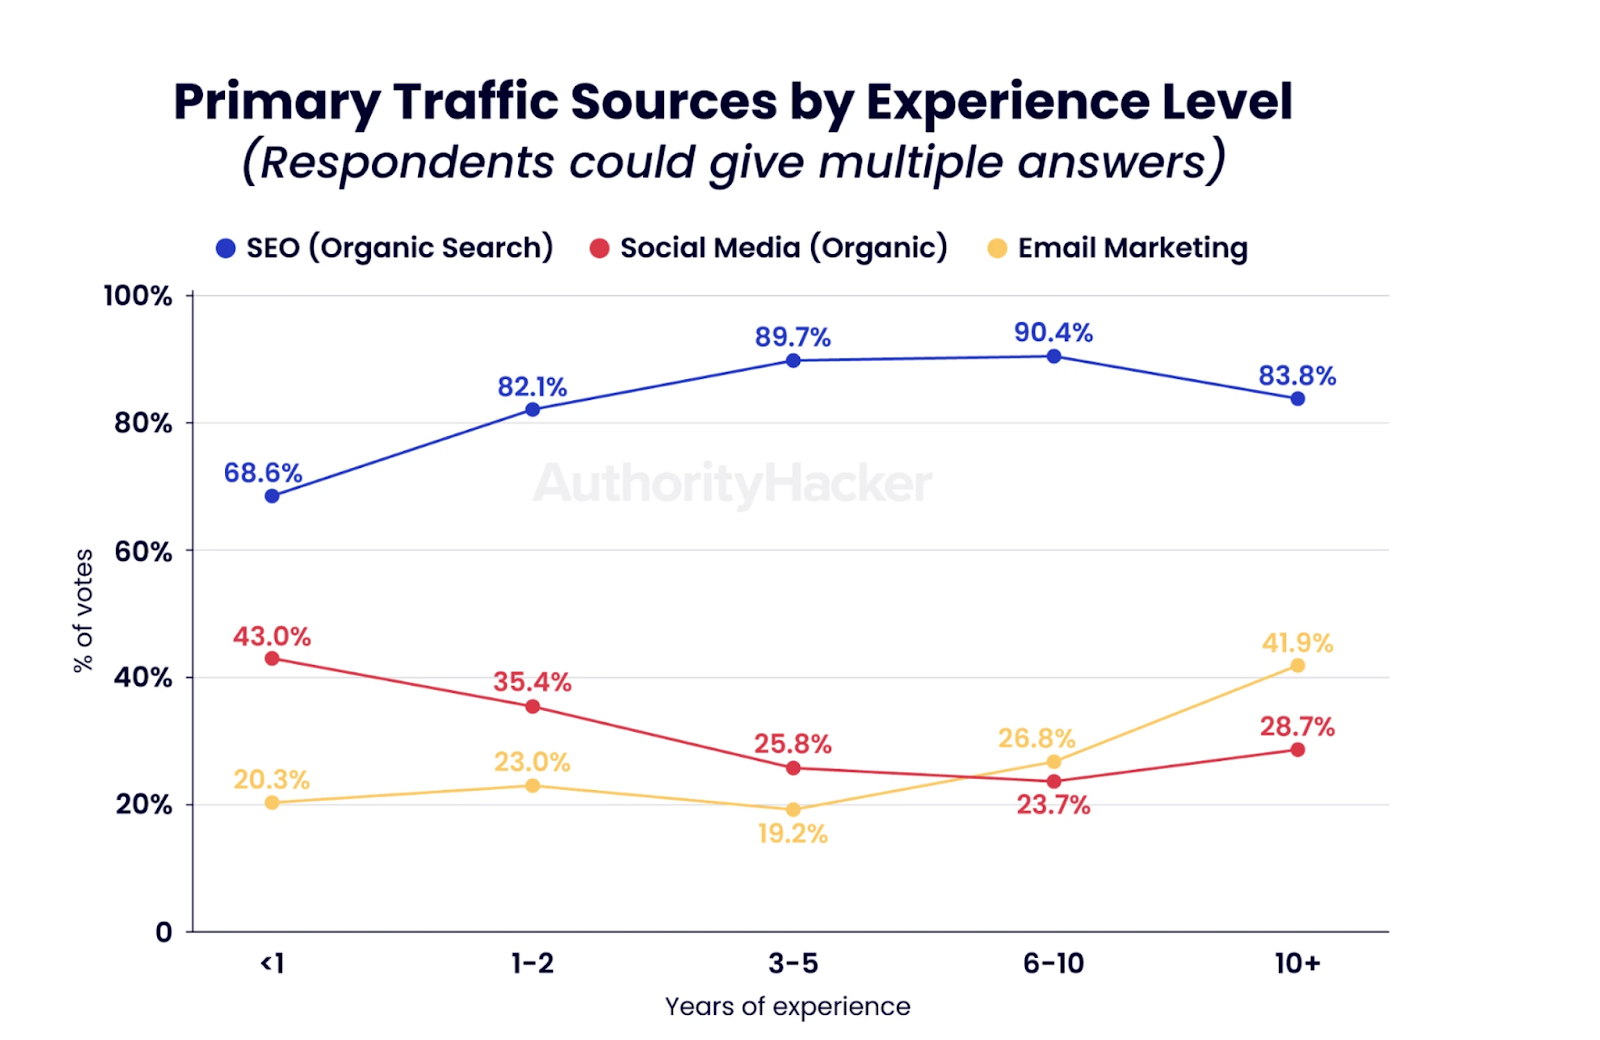
90% of affiliates with 3-10 years of experience used SEO as a primary traffic source.
This was followed by:
- 84% of affiliates with over 10 years of experience.
- 82% of affiliates with 1-2 years of experience.
- 69% of affiliates with less than a year’s experience.
43% of affiliates with under a year’s experience used organic social media as their primary traffic source.
This was followed by:
- 35% of affiliates with 1-2 years of experience.
- 26% of affiliates with 3-5 years of experience.
- 29% of affiliates with over 10 years of experience.
- 24% of affiliates with 6-10 years of experience.
42% of affiliates over 10 years of experience used email marketing as a primary traffic source.
This was followed by:
- 26% of affiliates with 6-10 years of experience.
- 19% of affiliates with 3-5 years of experience.
- 23% of affiliates with 1-2 years of experience.
- 20% of affiliates with less than a year’s experience.
Expert affiliates used email marketing 48% more than beginners.
They also used SEO 12% more than beginners. However, compared to beginners, experts had a 27% lower organic social media usage rate.
Despite social media being the second largest source of traffic, 60% of affiliates using social media to drive traffic had less than 1000 followers.
26% had between 1,000-10,000 followers, while only 9% had between 10,000-50,000 followers.
Affiliates with over 10 years of experience had the highest number of followers (120,000), followed by those with 6-10 years of experience (58,000).
Next, affiliates with 3-5 years of experience had 54,655 subscribers, while those with 1-2 years of experience had around 16,300 subscribers. Affiliates with less than a year’s experience had the least number of subscribers at slightly under 15,900.
In 2024, affiliate creators generated $1.1 billion through affiliate marketing.
Compared to 2021, creators made $530 million, or 93% more from affiliate marketing in 2024.
On Instagram, close to 14% of affiliate influencers operated in the Lifestyle niche in 2021.
- 9% were in the Beauty niche.
- 8% were in the Music niche.
- 7% were in the Photography niche.
- 5% were in the Humor & Happiness niche.
Affiliate creators who had between 50,000-100,000 followers on Instagram led the charge in terms of reach, impressions, and engagement. In fact, they had a 42% higher reach than other creators (even those with over 500,000 followers).
On TikTok, nano and micro affiliate creators had engagement rates up to 8x higher than creators with an audience of over 500,000.
Overall, affiliates with follower counts of 50,000 to 100,000 had the highest conversion rate of clicks to orders at 0.9%.
Meanwhile, affiliates with 100,000 to 200,000 followers drove 5.6x as many sales as those with 200,000. Generally, while creators with up to 200,000 followers excelled at sales, those with larger audiences (500,000+) had higher engagement rates.

High-performing affiliates had an average order size of $100-$150 in 2023.
They also sold an average of 2.5 items per order.
84% of publishers ran an affiliate program in 2023.
Additionally, over 80% of advertisers did so in 2023.
The average monthly website traffic for affiliates was 56,673 visitors. Traffic also varied according to years of experience, for example, affiliates with:
- Under a year of experience had over 13,700 visitors.
- 1-2 years of experience had over 27,200 visitors.
- 3-5 years of experience had over 67,800 visitors.
- 6-10 years of experience had over 108,000 visitors.
- Over 10 years of experience had over 216,000 visitors.
Overall, for every additional year of experience, traffic growth increased by 54%.
Technology was the highest traffic niche with 109,818 monthly visitors.
This was followed by Beauty & Skincare and Food & Nutrition with 92,179 and 77,321 monthly visitors respectively.
AI-driven content creation was the top affiliate marketing trend adopted by 79% of affiliates in 2024.
This was followed by:
- Email marketing/newsletters - 50%
- Social media marketing - 39%
- Video marketing and streaming - 21%
- Chatbot Integrations - 16%
Affiliate earning statistics
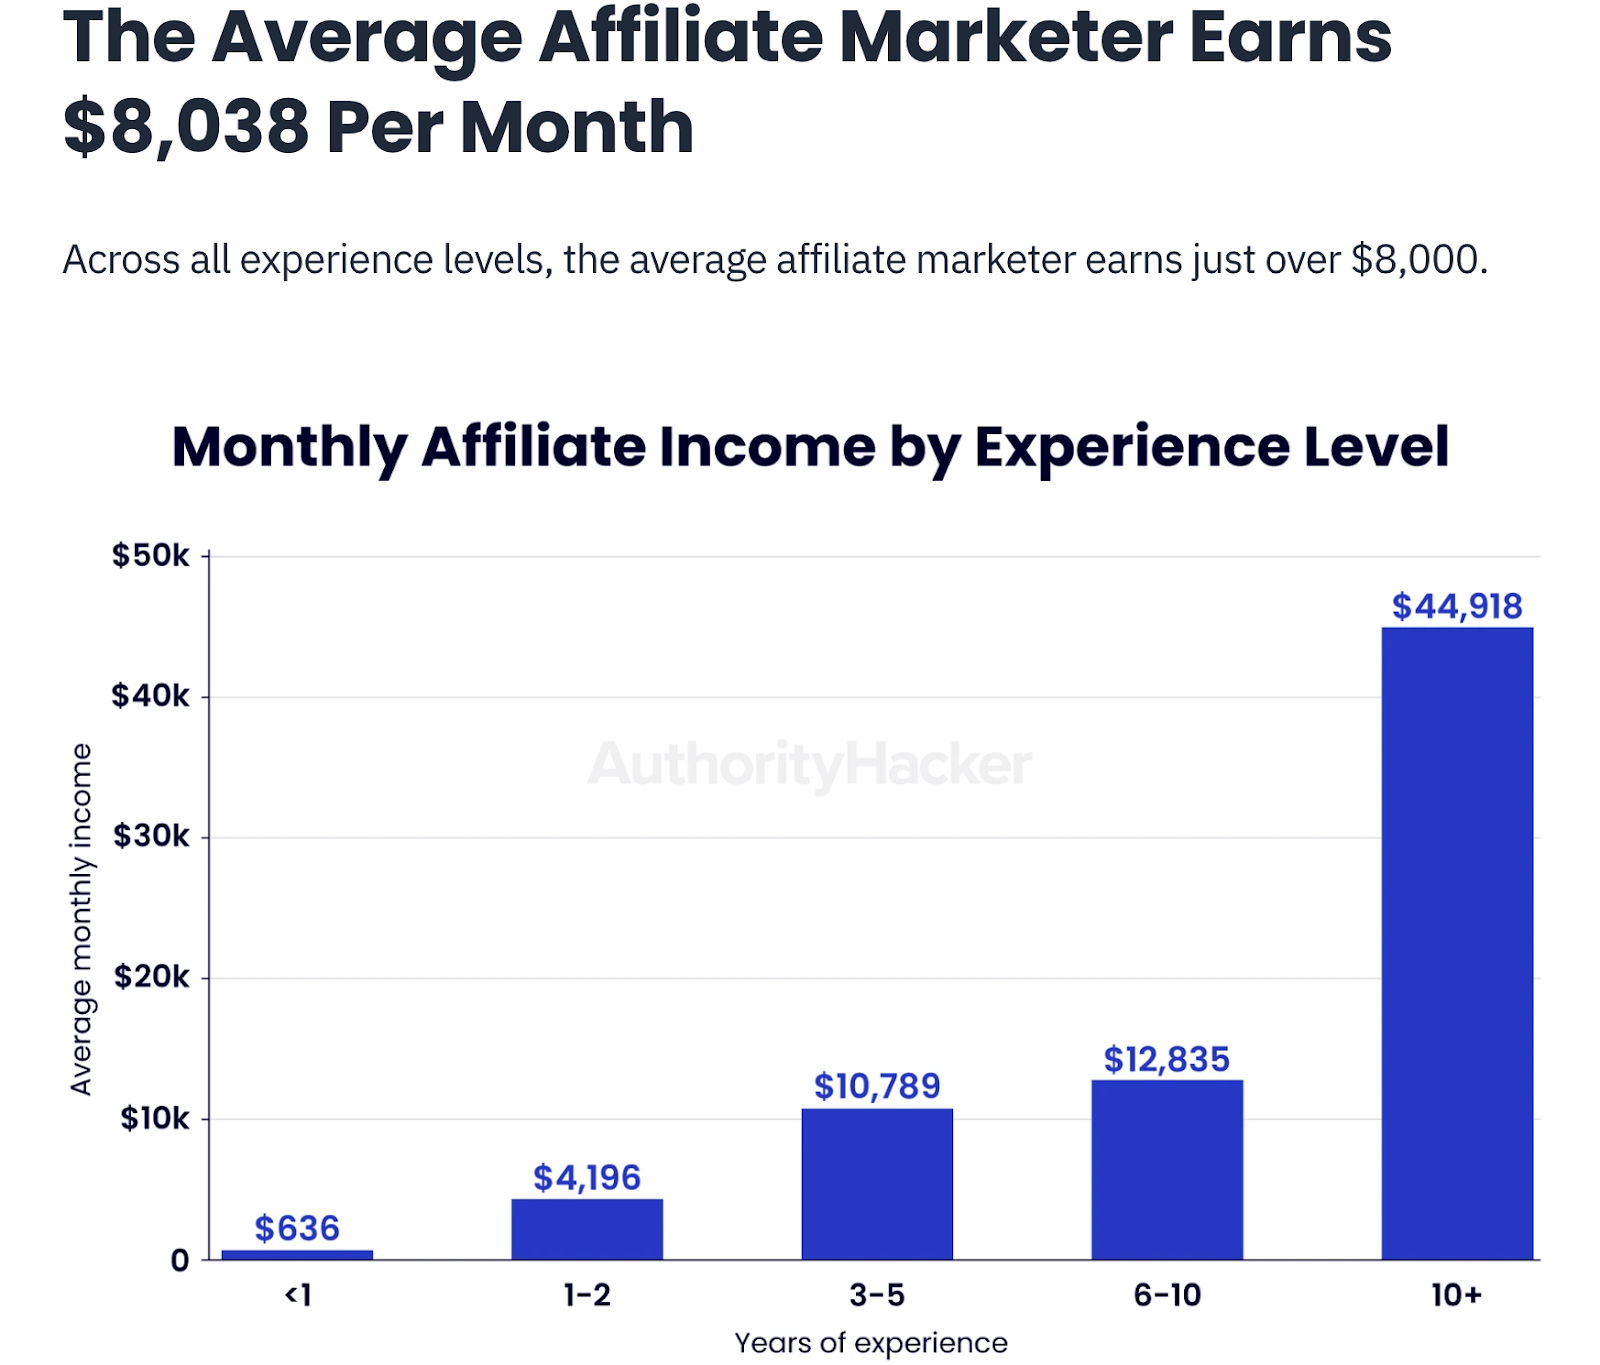
The average affiliate earned around $8,000 per month or just over $96,000 per year in 2024.
Additionally, monthly income varied based on experience. For example, affiliates with:
- Less than 1 year of experience made $636.
- 1-2 years of experience made $4,196 or 560% more than beginners.
- 3-5 years of experience made $10,789 or 1,600% more than beginners.
- 6-10 years of experience made $12,835 or 2,000% more than beginners.
Affiliates making over 6-figures diversified their traffic sources 22% more than average.
Paid ads and email marketing were their main diversification channels.
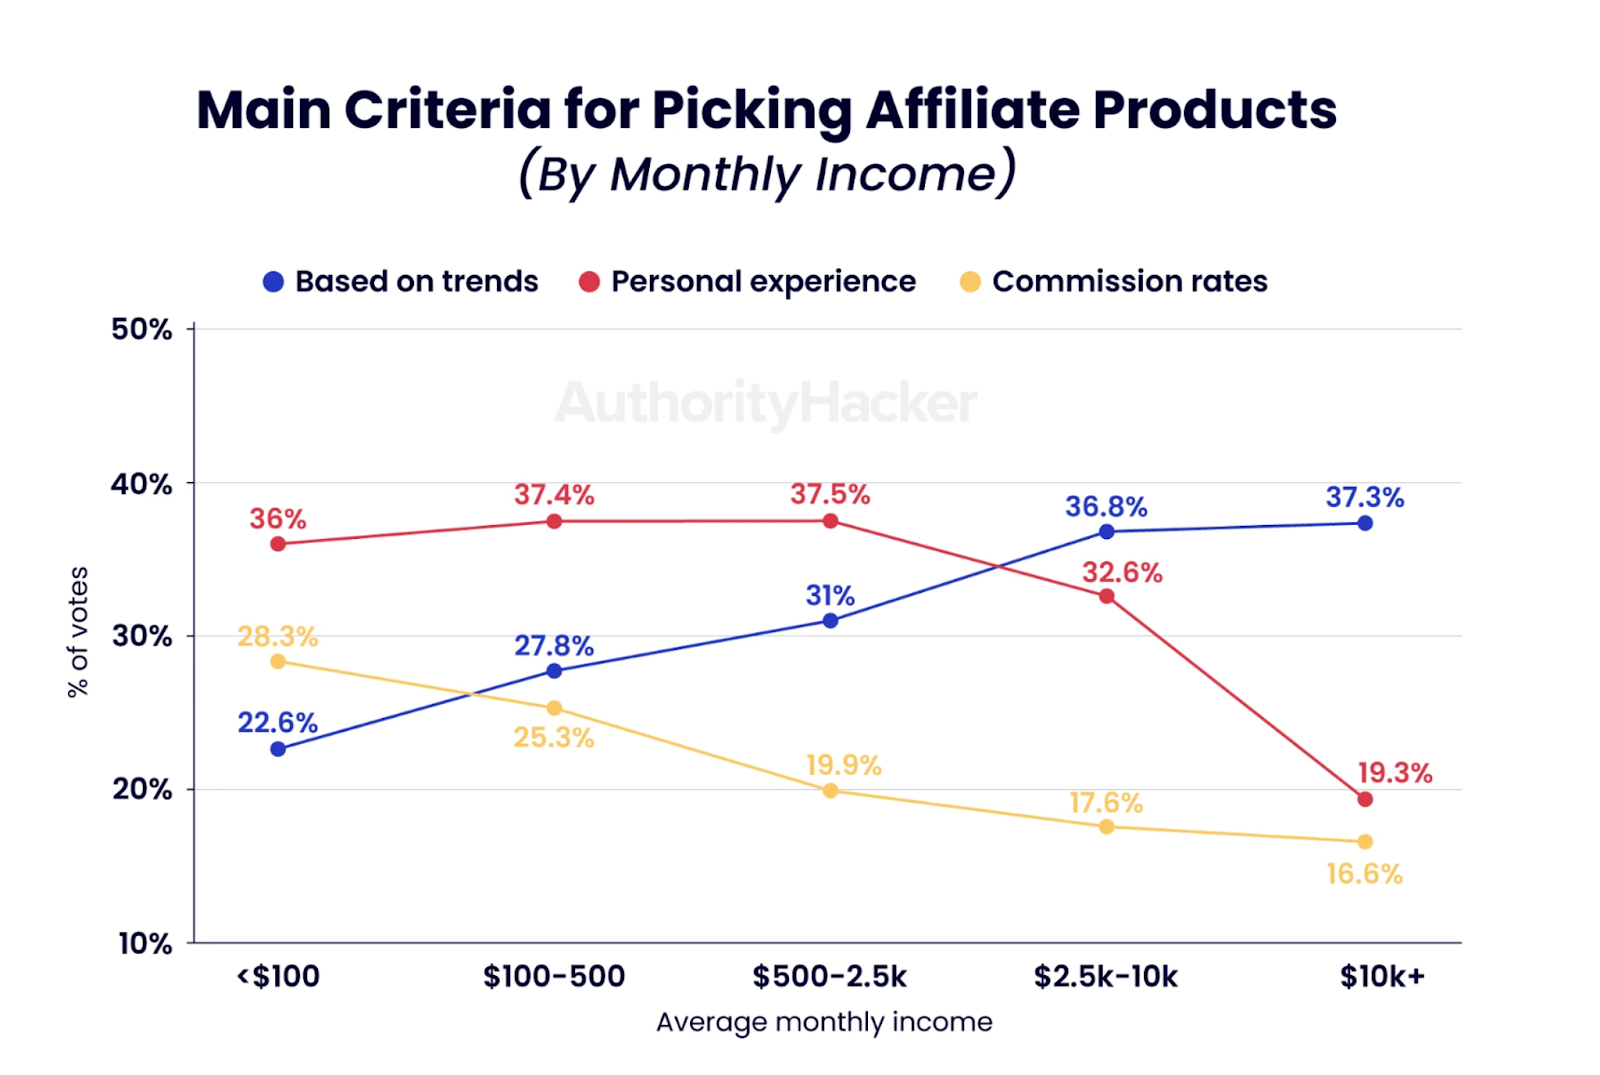
Affiliates who chose products based on market research made 48% more than those relying on commissions or personal experience.
While a majority of affiliates (36%) earning less than $100 monthly picked affiliate products based on personal experience, 74% of those earning from $2,500 to $10,000+ did so based on trends. High earners were least likely to pick products based on personal experience (19%) and commission rates (17%).
Affiliates who earned over $500,000 per month had over 716,000 subscribers, while those earning:
- $250,000-$500,000 had 300,000 subscribers.
- $100,000-$250,000 had 171,000 subscribers.
- $50,000-$100,000 had over 149,000 subscribers.
- $10,000-$50,000 had over 64,000 subscribers.
- $2,500- $10,000 had around 55,000 subscribers.
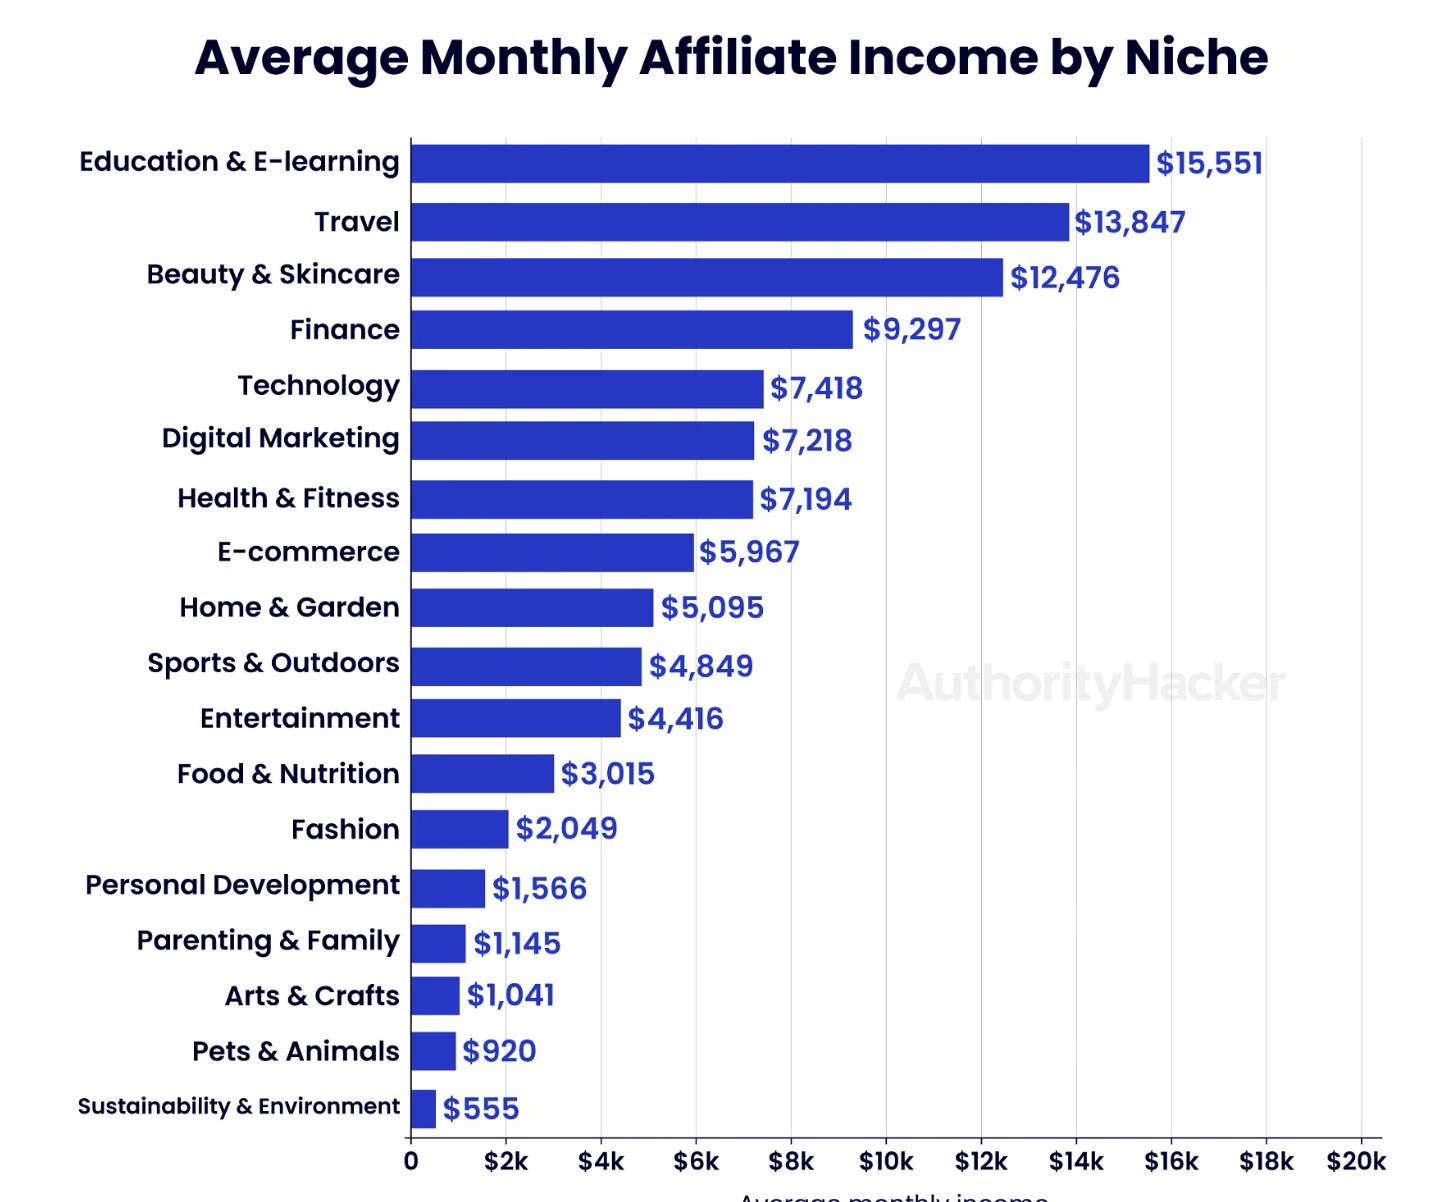
Education and E-learning, which brought in an average of $15,551 per month, was the most profitable affiliate niche in 2024.
In second place was Travel with an average monthly affiliate income of $13.847. This was followed by Beauty & Skincare ($12,476) and Finance ($9,297).
Other profitable affiliate niches within the $5,000 - $8,000 range included:
- Digital Marketing - $7,218 per month.
- Health & Fitness - $7,194 per month.
- Ecommerce - $5,967 per month.
- Home & Garden - $5,095 per month.
Education & E-learning had an average revenue per 1000 visitors (RPM) of $274, while Digital Marketing had an RPM of $236 in 2024.
Entertainment was next with an RPM of $203, followed by Travel ($196), Health & Fitness ($159), and ecommerce ($156).
In 2024, top-earning affiliates promoted high-value products. Notably, those earning between $250,000-$500,000 per month earned over $11,250 from a single commission.
The largest single commission for affiliates earning:
- Over $500,000 per month was $8,627.
- $100,000-$250,000 per month was $8,102.
- $50,000-$100,000 per month was $6,277.
- $10,000-$50,000 per month was $3,364.
- $2,500-$10,000 per month was $2,327.
- $500-$2,000 per month was $739.
- $100-$500 per month was $486.
- Less than $100 per month was $92.
According to Partnerize’s US Retail Affiliate Marketing Sales Index, variable commission rates stood at 6.5% in July 2024, among the highest in 20246.
This also represented a 3% increase year-over-year.
On the other hand, by niche, the average largest single commission reported was $1,743 in the Beauty & Skincare category.
This was followed by:
- $1,494 in the Finance niche.
- $1,354 in the Gaming niche.
- $1,035 in the ecommerce niche.
- $914 in the Travel niche.

The average affiliate website revenue was $149.76 per 1000 visitors.
Additionally, affiliate websites earning $10,000 or more per month made 358% more per visitor than average.
82% of high-earning websites monetized with both affiliate marketing and display ads.
Affiliate marketing made more than ads in 94% of niches. It also generated 2x as much as ads in most niches.
More affiliate team members were related to increased earnings. For example, affiliates making between $100-$2,500 per month had an average team size of 2.
Meanwhile, those making $2,500 to $10,000 had an average of 3 team members. This was followed by:
- $10,000-$50,000 with 7 team members.
- $50,000-$100,000 with 7 team members.
- $100,000-$250,000 with 11 team members.
- $250,000-$500,000 with 21 team members.
- $500,000+ with 22 team members.
For affiliates on social media, higher follower accounts correlated with higher revenue. For instance, affiliates with over 220,000 subscribers generated over $10,000 in monthly income.
Affiliate marketers with over 50,000 subscribers made $2,500-$10,000 per month and those with 46,000 subscribers made $500-$2,500. Meanwhile, those with 3,000 to 15,000 subscribers made $100-$500.
SaaS was also one of the most lucrative categories for affiliates, attracting commissions ranging between 20% and 70%.
This was followed by commission rates of:
- 35%-40% for Finance
- 20% for Business
- 15%-30% for eLearning
- 10%-30% for Health & Beauty
- 13%-20% for Tech
- 13% for Fashion
- 12% for Arts
Around 23% of affiliates built an email list and used email marketing in 2024.
On average, these affiliates earned significantly more than those who did not. For example, those using email marketing made $12,007 or 67% more than those who didn’t use email
marketing ($7,213).
76% of affiliates found time-sensitive promotions had little to no impact on their revenue.
Meanwhile, over 23% said time-sensitive promotions had a moderate to significant impact on their revenue.
As of 2024, 66% of affiliates earning over $10,000 monthly took affiliate marketing courses.
Furthermore, beginner affiliates who took affiliate marketing courses and had less than 3 years of experience made 58% more than those who didn’t ($3,447 vs. $2,186).
35% of affiliates networked with other affiliate marketers.
In fact, top earners were 1.5x more likely to network with fellow affiliates. Furthermore, affiliates earning over $10,000 monthly were 7x more likely to attend in-person conferences.
Affiliate marketing usage statistics
In 2024, 77% of businesses made use of affiliate marketing.
Of these businesses, 33% planned to increase their affiliate marketing budgets significantly, while 29% planned to increase them moderately.
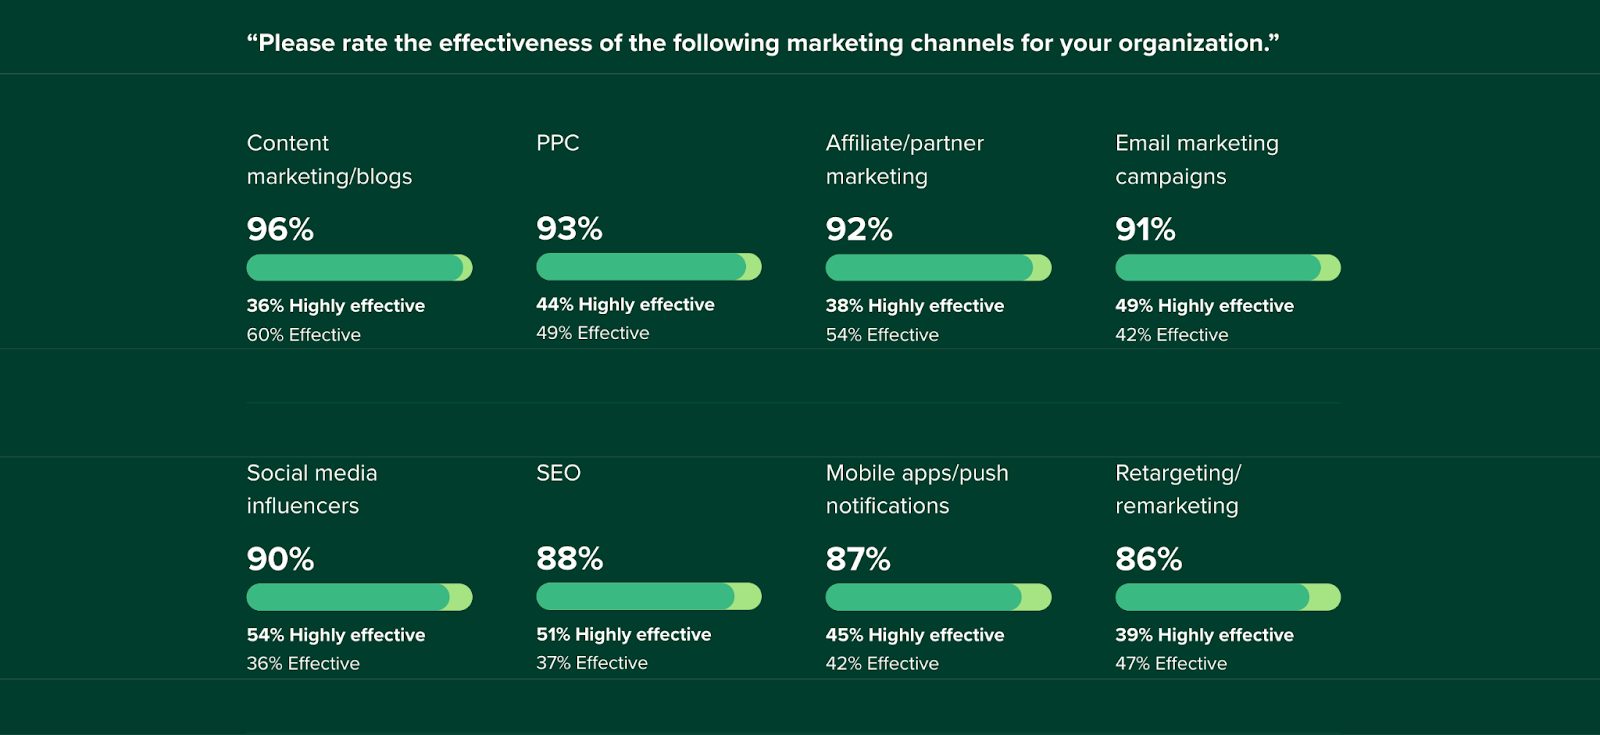
92% of marketers considered affiliate marketing an effective channel7.
This was just behind content marketing and blogs which were considered effective by 96% of marketers, and Pay-Per-Click (PPC) ads (93% of marketers).
Other effective channels included:
- Email marketing campaigns - 91%
- Social media influencers - 90%
- SEO - 88%
When marketers partnered with affiliates, they generated 46% more affiliate-based sales8.
For categories like health and beauty this shot up to 178%.
Marketers allocated around 7% of their marketing budgets to affiliate marketing in 2024.
This was compared to 54% for social media influencers, 48% for email marketing campaigns, and 42% for social media advertising.
Affiliate marketing moved beyond being a ‘last click channel’ in 2024, with 58% of businesses using it to aid consideration and 56% using it to build awareness9.
This was compared to 50% for acquisition and conversion and 32% for post-sale retention and loyalty.
83% of marketers that used affiliate marketing targeted consumers during the discovery and awareness stage in 2024.
This was followed by:
- 79% during the conversion or purchase stage.
- 79% to encourage ongoing customer engagement.
Affiliate marketing also aligned with key business objectives such as:
- Leveraging emerging technologies - 22%
- Increasing customer retention - 22%
- Enhancing new customer acquisition - 21%
Compared to other channels, marketers believed that affiliate marketing had several unique strengths such as:
- New innovative partners - 28%
- Providing clear, incremental value - 28%
- Being simple to manage - 27%
- Transparency, flexibility, and reliability - 26%
Brands agreed that affiliate marketing helped them the most with brand awareness (58%).
This was followed by new customer acquisition (50%) and sales volume (50%).
60% said that affiliate partners helped drive and optimize their website traffic.
35% said affiliate partners helped boost customer loyalty.
For the type of publisher model that was crucial to their affiliate marketing activities, 49% of businesses selected the social, influencer, and creator model.
This was followed by the ecommerce/retailer model (47%), review websites (44%) and paid search affiliates (41%).
The above ties in with 2023 findings that the most common type of affiliate partnerships brands engaged in was with influencers and creators (40%)10.
This was followed by media houses (39%), price comparison (36%), and bloggers (35%). In other findings, the figure was higher, with up to 59% of brands stating that they worked with influencers for their affiliate campaigns.
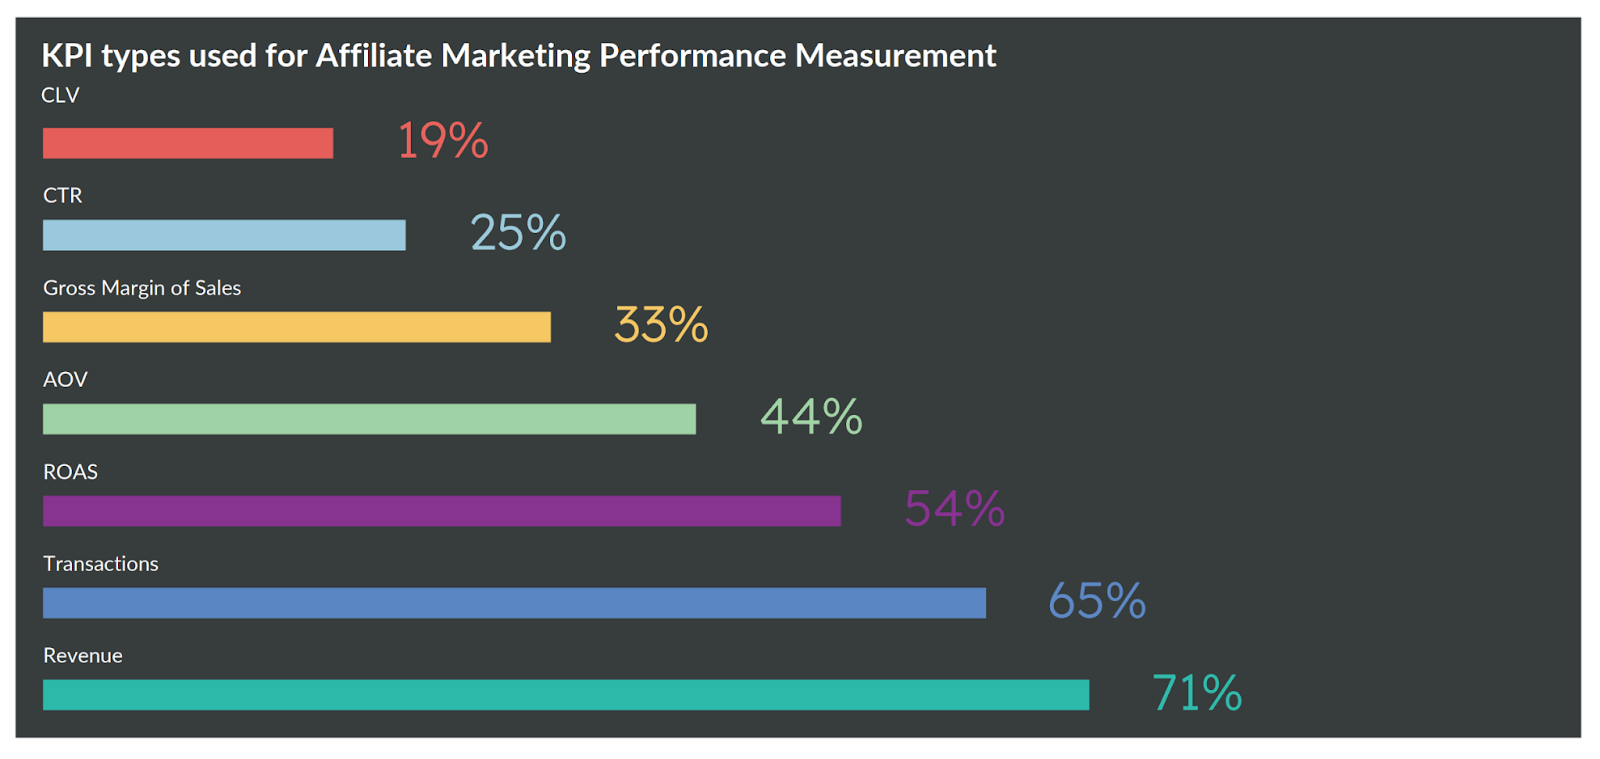
Revenue (71%) and transaction counts (65%) were the most common KPIs of affiliate performance in 2024.
Return on ad spend (ROAS) and average order value (AOV) were also popular and used by 54% and 44% of brands, respectively.
At 49%, website traffic, engagement, and page views were additional measures businesses used to measure the success of their affiliate marketing activities.
Next, was new customer acquisition at 47%, online revenue at 46%, and brand visibility at 42%.
50% of marketers at larger companies considered having an affiliate agency to create a strategy as very important.
On the other hand, smaller companies were more likely to rate having full control of their affiliate marketing as important (53% vs. 44%) and the resulting cost benefit of an in-house strategy (55% vs.44%).
When asked what would drive increased investment in affiliate marketing, marketers cited advanced tracking and reporting tools (18%).
In second place was access to more influential or better-matched affiliates (17%). This was followed by tailored strategic guidance, also at 17%.
In 2023, 49% of companies engaged in affiliate marketing used flat-rate payments.
This was compared to 42% of companies that paid commissions as a percentage of sales.
Affiliate marketing attribution statistics
77% of consumers used multiple devices throughout their purchase path in 202511.
As such, cross-device attribution models that ensure fair credit distribution will be a priority in 2025.
For their affiliate marketing campaigns, 44% of brands used first-click attribution, making it the most popular attribution method.
(Attribution refers to giving credit to the partners involved in a customer’s journey up to making a purchase. In this case, first-click attributes 100% of the value to the first click).
Following closely behind was last-click attribution, with 36% of brands using the model. In 2025, 35% of affiliate sales involved multiple touchpoints, highlighting the limitations of last-click attribution.
On the other hand, multi-touch and multi-channel models which were better suited to modern marketing campaigns, were used by 25% and 18% of brands, respectively.
54% of marketers used third-party solutions to track the performance of their affiliate marketing efforts12.
Meanwhile, 38% still relied on affiliate network measurement.
59% of brands had difficulty measuring how their affiliate marketing campaigns affected other marketing channels.
Another key challenge was measuring cross-device journeys (59%), followed by measuring any activity beyond the last click.
Affiliate marketing revenue statistics
As of 2025, influencers drove over 30% of affiliate program revenue.
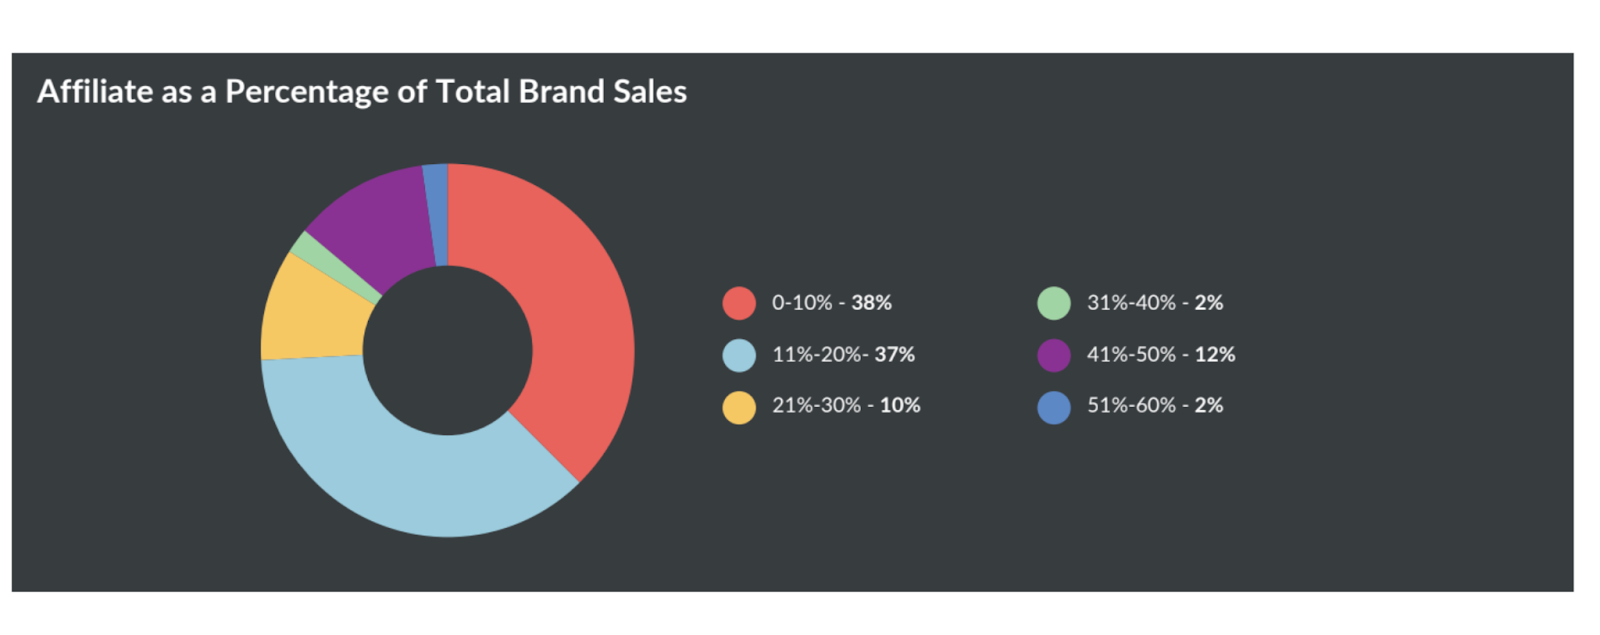
In other findings, 38% of brands and marketers reported that affiliate marketing drove up to 10% of total company revenue. Meanwhile, 37% reported that affiliate marketing accounted for 11%-20% of revenue and 12% reported that it contributed between 41%-50%. On the upper end,10% said affiliate marketing drove 21%-30% of revenue.
When asked to rate the total business value of affiliate partner types across all stages of the customer journey on a scale of 1-10, content came out on top with a rating of 8.2.
This was followed by:
- Paid Search - 6.7
- Cashback & Loyalty - 6.5
- Influencers - 6.2
- Paid Media/Buyers - 6.2
- Email - 6.1
Cashback & Loyalty (70%) and Content Publishers (65%) topped the revenue potential list across various publisher classes.
This was followed by Coupons & Deals (58%), Paid Search (55%) and Paid Search (55%).
As of July 2024, gross revenue generated by US retail brands through affiliate marketing promotions decreased by 13% from 2023.
The negative growth rate in revenue was directly due to a 12% decrease in clicks and a 3% decrease in conversions from 2023. This was despite AOV increasing by 2%.
By vertical, Accessories & Jewelry saw the most revenue growth at 56% from 2023.
This was followed by:
- Clothing & Apparel - 26%
- Health & Beauty - 15%
On the other hand, Computers & Electronics had a negative growth rate of 40%, Food & Drink had a negative growth rate of 25% and Gifts & Flowers had a negative growth rate of 14%.
As of July 2024, the share of affiliate marketing revenue from mobile was 41%.
This was a 6% increase from 2023.
The percentage of revenue acquired from new customers was 50%, a 2% increase from 2023.
Over 66% of this revenue came from Buy Now Pay Later (BNPL) affiliate partners. This was followed by content partners (58%) and coupon partners (48%).
By category:
- Revenue growth in the content partner category fell by 24% between July 2023 and July 2024.
- Revenue growth in the publisher category fell by 8% over the same period.
In 2023, Retail was the affiliate marketing niche with the highest revenue percentage at 44%.
Telecom & Media followed at 25%, along with Travel & Leisure at 15% and others at 15%.
Affiliate marketing engagement statistics
Over 50% of consumers were aware of affiliate marketing in 202413.
Over 54% of consumers encountered affiliate ads on social media, 54% saw them on online websites and 44% saw affiliate ads on YouTube.
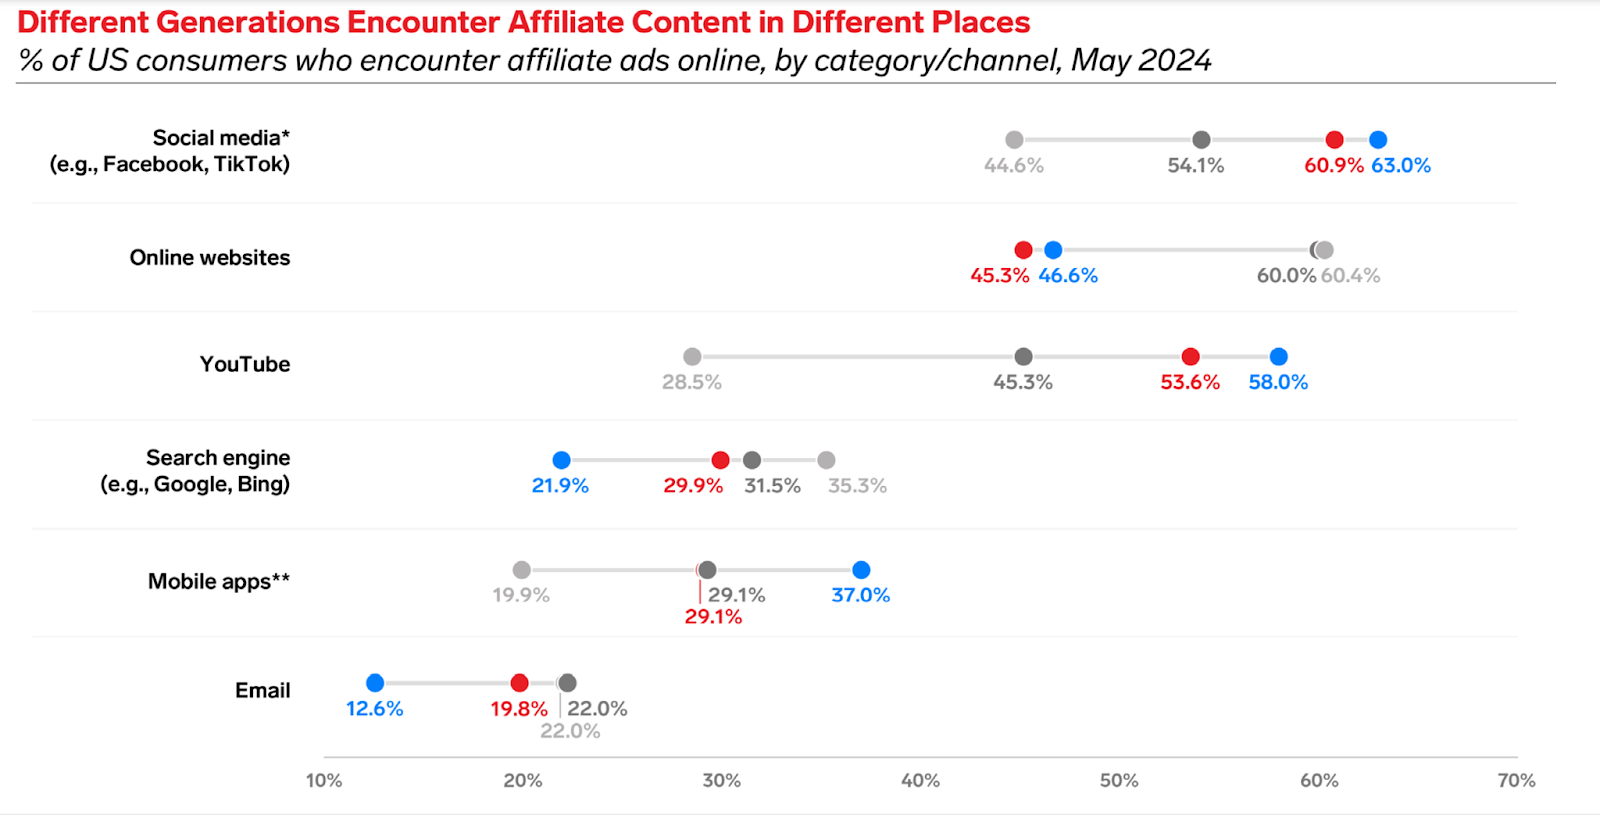
In 2024, consumers encountered the most affiliate content on social media, with over 63% of Gen Zers (ages 15-26) stating they had seen affiliate ads there14.
This was followed by:
- 61% of Millennials (ages 27-42).
- 54% of Gen X (ages 43-58).
- 45% of Baby Boomers (ages 59-77).
89% of consumers found affiliate sites providing expert reviews, comparisons, and shopping guides trustworthy.
They also found popular magazines (86%) and influencer recommendations (73%) trustworthy.
With affiliate ads, 66% of consumers mostly noticed videos with links to products and services.
This was followed by exclusive coupons and discount codes (58%) and text links embedded within articles and blog posts (47%). Additionally, 80% of consumers rated these types of affiliate ads as the least intrusive.
39% of Gen Z consumers were moderately influenced by affiliate ads.
On the other hand, this was the case for 35% of Millennials, 25% of Gen X consumers, and 16% of Baby Boomers.
More consumers than ever turned to social channels (39%) influencers (38%) and popular magazines (34%) for shopping inspiration in 2024.
This represented a significant shift away from search engines like Google (24%) or retail marketplaces like Amazon (21%) for inspiration.
For stages of the buying process such as research and consideration, consumers consulted the following affiliate marketing channels:
- Social media (Facebook, Instagram, TikTok, YouTube, etc.)
- Influencers
- Review websites
- Online Expert reviews
- Popular online magazines (Forbes, MensHealth, Vogue, etc.)
- Price comparison websites
- Shopping networks
Close to 50% of consumers admitted that creator content influenced them to make a purchase on social media.
This was way ahead of media content (10%) and retailers’ content (35%).
71% of consumers were likely to conduct moderate to heavy research from affiliate sources when purchasing electronics and appliances.
This was followed by travel products (69%), insurance products (68%), financial products (65%) and health or wellness products (65%).
Additionally, 76% of consumers spent time researching products worth over $500.
Meanwhile, 71% spent time researching service contracts and subscription commitments, and the same percentage spent time researching products worth $100-$500.
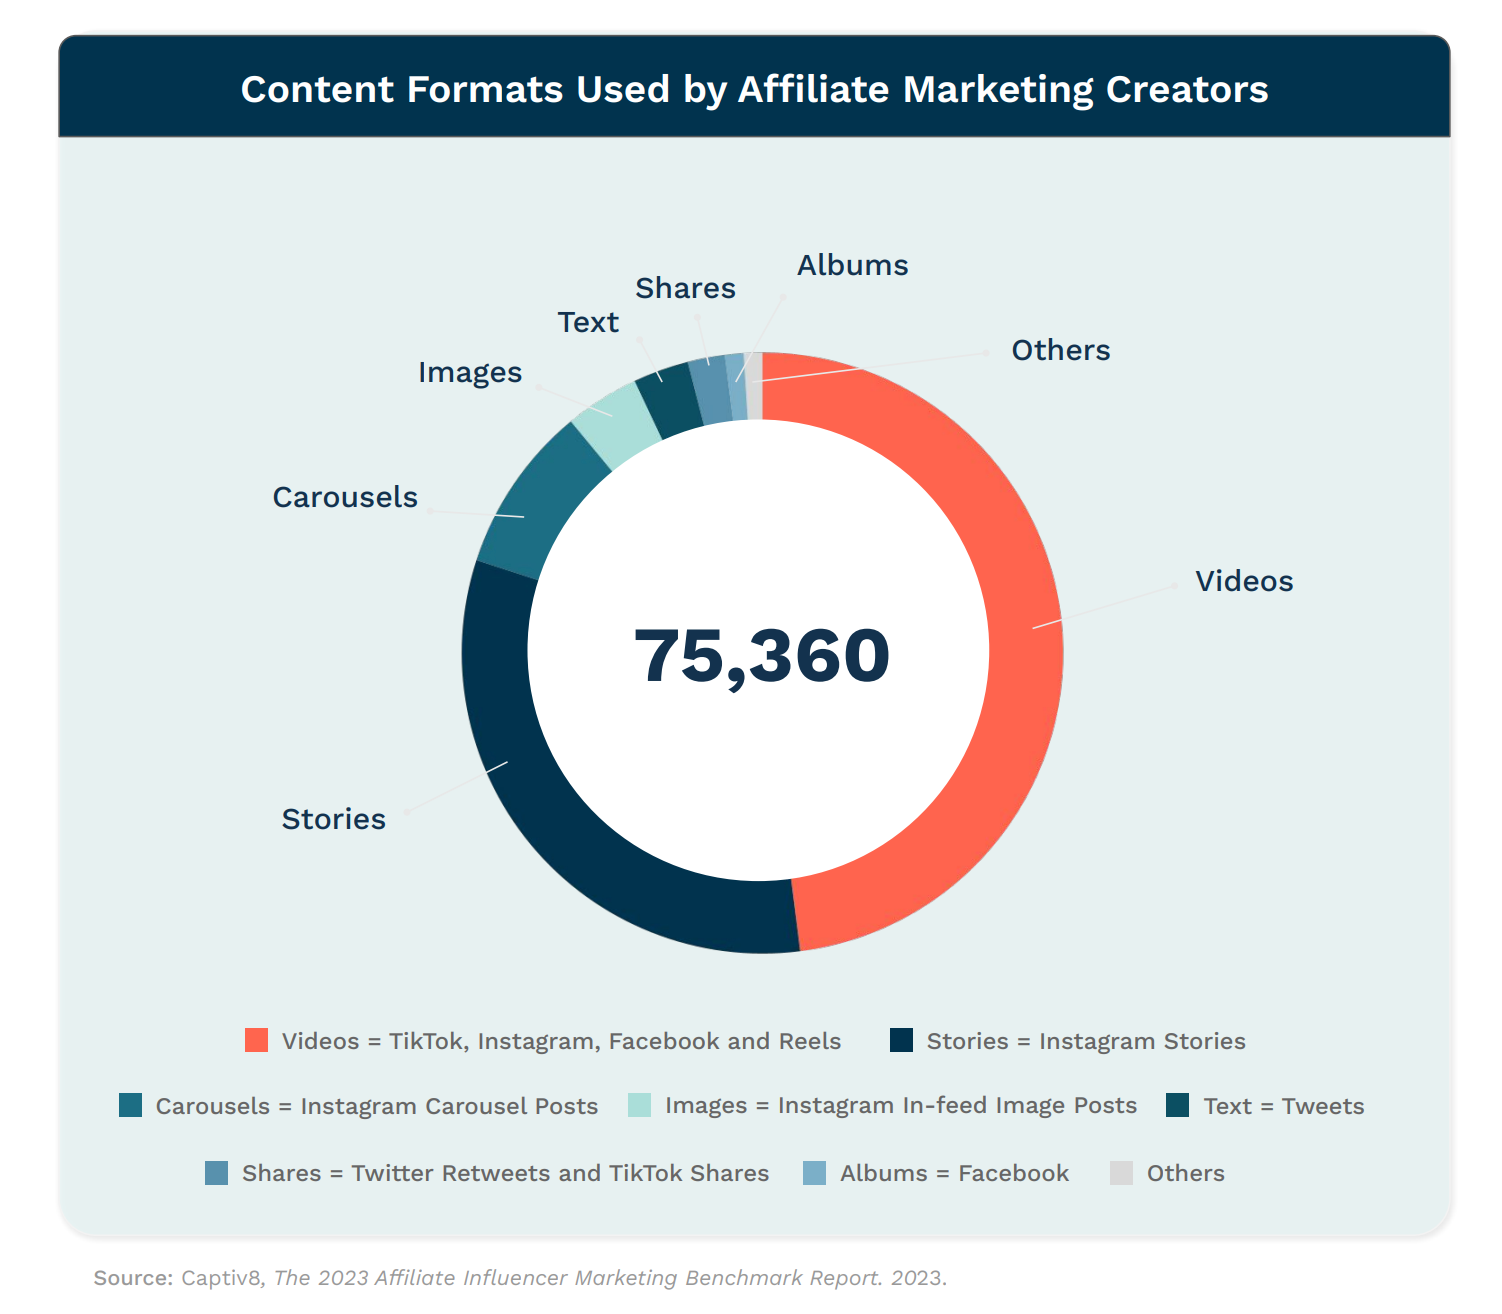
Video content was the top pick for connecting with audiences, with short-form videos accounting for over 50% of all affiliate posts across social platforms15.
Next in line were Instagram Stories, making up 27% of all affiliate posts along with Instagram Carousels (11%).
While the different content types on Instagram had an average view rate of under 50%, in-feed videos had the highest view rate (110%).
This means they were viewed 2.5x more than other Instagram content types. Meanwhile, Reels had a reach rate up to 15x higher than in-feed video.
TikTok ranked #1 in terms of view rate, at up to 42% higher than other platforms.
Engagement on TikTok was also up to 27x higher than on YouTube and 2.6x higher than on Instagram. However, compared to video content on TikTok and Instagram, YouTube’s longer-form content had more staying power and accounted for up to 94% of video search results on Google.
Affiliate marketing challenges statistics
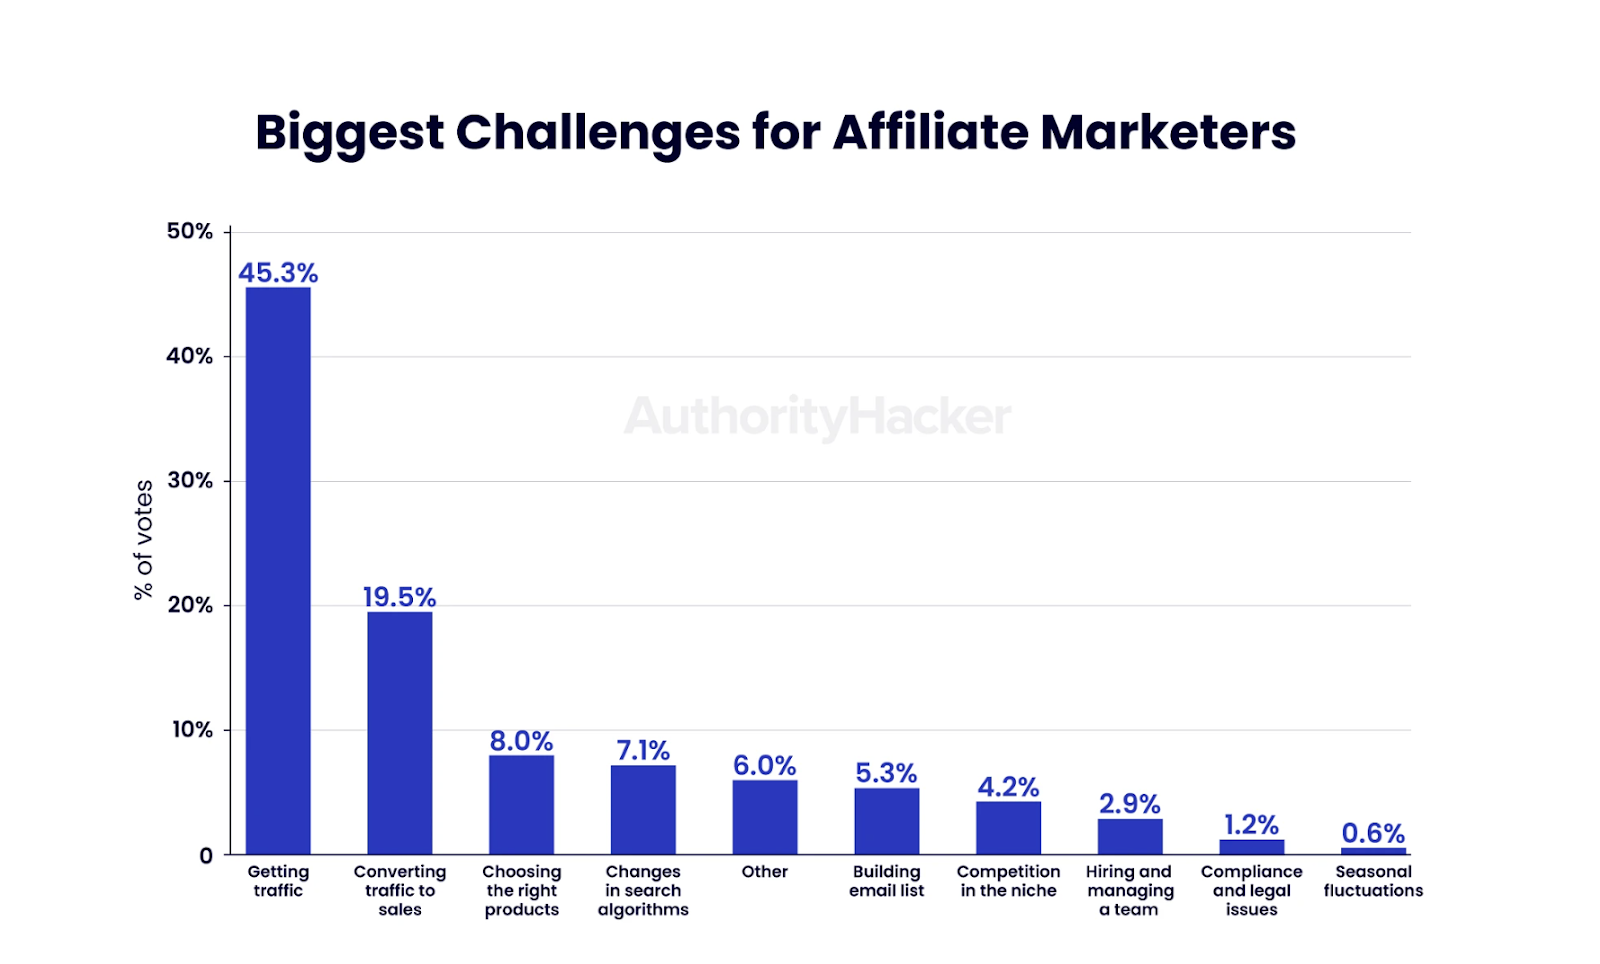
Over 45% of affiliate marketers in 2024 stated that getting traffic was their biggest challenge.
This was followed by converting traffic to sales at 20% and choosing the right products at 8%. Other key challenges included:
- Changes in search algorithms - 7%
- Other - 6%
- Building an email list - 5%
- Competition - 4%
- Hiring and managing a team - 3%
Breaking it down by experience level, getting traffic was a challenge for:
- 51% of affiliate marketers with less than a year’s experience.
- 45% of affiliate marketers with 1-2 years of experience.
- 41% of affiliate marketers with 3-5 years of experience.
- 33% of affiliate marketers with 6-10 years of experience.
- 32% of affiliate marketers with over 10 years of experience.
Similarly, by experience level, converting traffic to sales was a challenge for:
- 18% of affiliate marketers with less than a year’s experience.
- 26% of affiliate marketers with 1-2 years of experience.
- 18% of affiliate marketers with 3-5 years of experience.
- 18% of affiliate marketers with 6-10 years of experience.
- 14% of affiliate marketers with over 10 years of experience.
For high-earning affiliate marketers (6+ figures per year), getting traffic remained a challenge for over 17%. However, these top earners faced other diverse challenges such as:
- Hiring and managing a team - 17%
- Changes in search algorithms - 15%
- Compliance and legal issues - 4%
- Seasonal fluctuations - 3%
25% of affiliates were negatively affected by search algorithm updates throughout 2024.
However, high earners who were more meticulous with their content strategies saw 2x more positive impacts from the algorithm updates.
48% of affiliates who lost traffic due to algorithm updates changed their content strategies.
Other common changes included:
- Diversifying the products and services promoted - 19%
- Expanding to new platforms or channels - 13%
- Investing in paid advertising - 10%
- Collaborating with other marketers or brands - 4%
31% of affiliate marketers earning 6+ figures considered giving up at some point in 2024.
By experience level:
- 53% of affiliate marketers with 1-2 years of experience felt like giving up.
- 52% of affiliate marketers with 6-10 years of experience felt the same way.
- 52% of affiliate marketers under a year’s experience felt the same way.
- Only 47% of affiliate marketers with over 10 years of experience also felt the same way.
Despite this, over 83% of affiliate marketers were optimistic about the future of affiliate marketing.
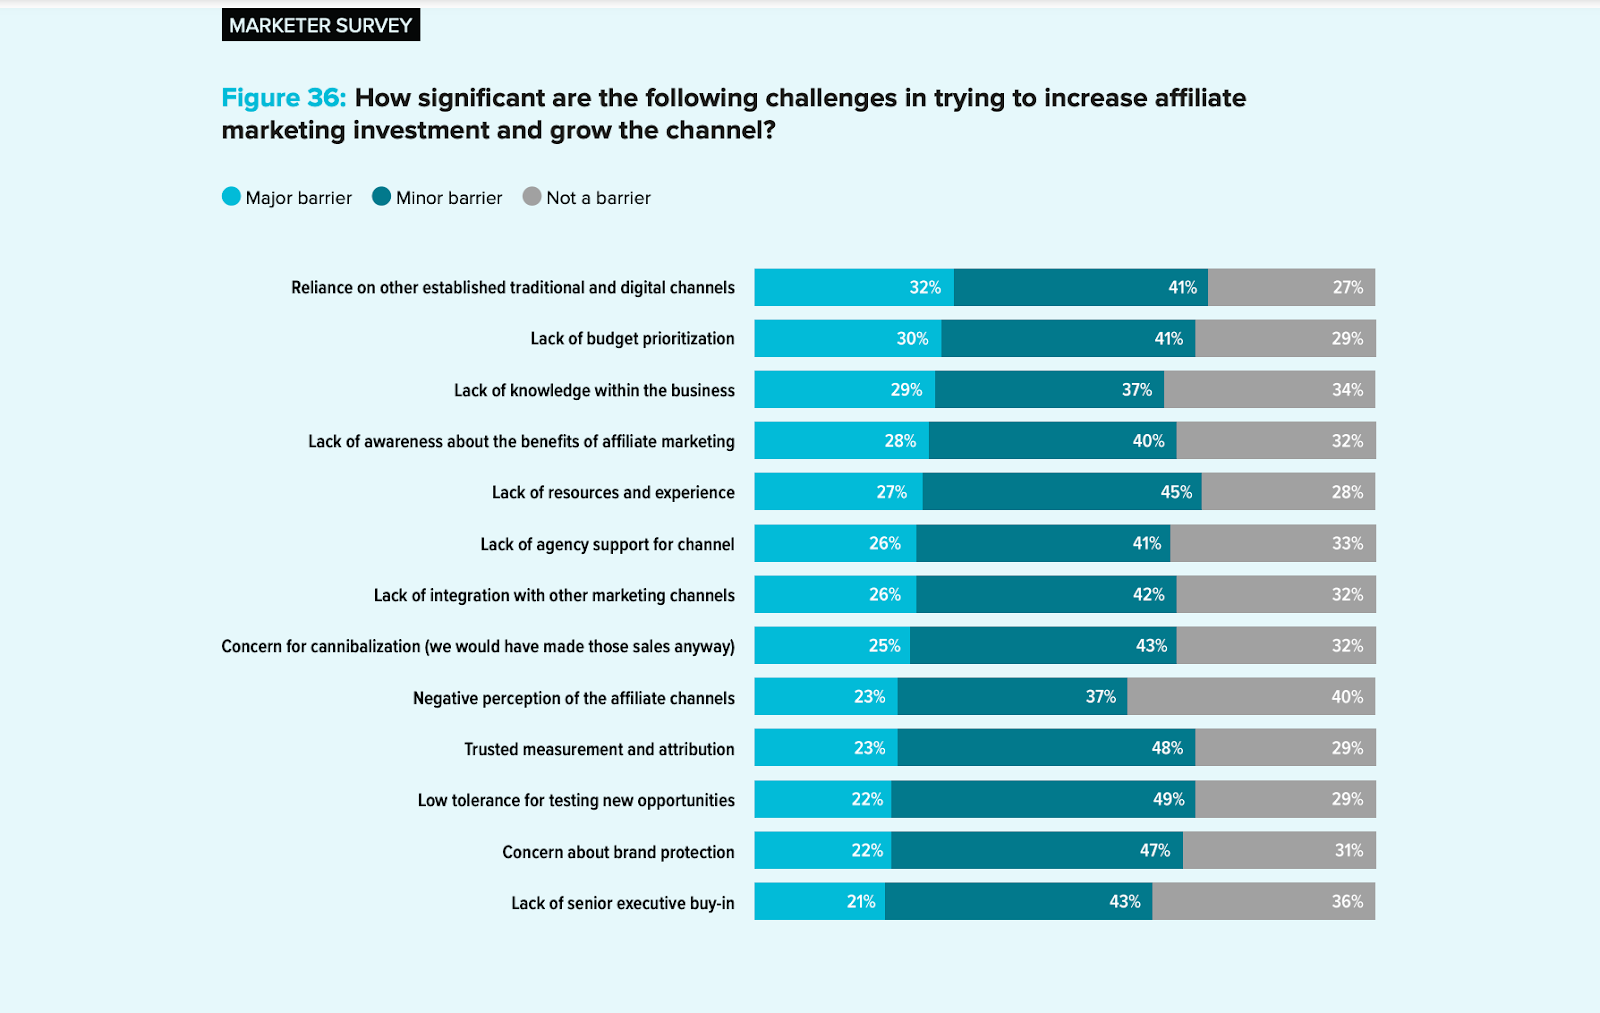
32% of marketers pointed out that affiliate marketing’s reliance on other established traditional and digital channels was a major barrier to growth and investment.
This was followed by budget challenges (30%) and a lack of awareness about the benefits of affiliate marketing.
In terms of the key challenges businesses encountered with affiliate marketing, relationship management took the lead at 68%16.
This was followed by other challenges such as:
- Ensuring affiliates consistently represented the brand - 66%
- Safeguarding against fake leads and dishonest affiliate practices - 66%
- Establishing fair, sustainable commission rates - 46%
- Ensuring sales and leads were accurately tracked and attributed - 46%
67% of marketers in 2023 stated that affiliate marketing fraud was a concern.
In fact, 31% admitted they had experienced affiliate marketing fraud.
Affiliate marketing fraud statistics
As per a 2025 report, an estimated 25% of leads generated through affiliate marketing campaigns were fake or of poor quality17.
The same report revealed that:
- Bots accounted for 25$ of all affiliate traffic, leading to fake clicks and transactions.
- Sub-ID manipulation or fraud accounted for 18% to 12% of affiliate fraud incidents.
- Mobile affiliate fraud rates were up to 50% higher compared to desktop because of vulnerabilities in mobile tracking.
- Cookie stuffing schemes affected 5%-10% of affiliate marketing transactions and artificially attributed sales to affiliates.
In 2022, 17% of traffic from affiliate marketing programs was fake, costing the industry over $3.4 billion18.
This was up significantly from 2020 when close to 10% of traffic was fake and cost the industry over $1.4 billion in losses.
Become an affiliate expert with Whop
If there's one thing to take away from these affiliate marketing statistics, it's that affiliate marketing courses can help you make more money (58% more!) as an affiliate marketer.
Whop is home to thousands of affiliate marketing courses and communities that will help you become a better affiliate marketer. Just head to Whop and search for affiliate marketing whops.
Plus, Whop has an affiliate program where you can earn up to 30% of Whop's revenue for life. Check out how it all works by joining Whop Affiliates.
Sources