Discover over 120 Facebook Statistics covering users, engagement, advertising, revenue, and more.
Key takeaways
- Facebook remains the dominant social platform with 3 billion users and 60.8% global market share in 2024.
- Facebook Reels drive 3x more views than other video content, with audio-enhanced Reels boosting CTR by 35%.
- Facebook Marketplace leads social commerce with 1.2 billion users, outpacing Amazon and eBay in monthly visits.
Over the last 20 years, Facebook has revolutionized how people connect, explore their interests, and discover information. With over 3 billion users in 2024, it remains the social media platform to beat.
Whether you’re a creator, business owner, or entrepreneur, we’ve put together a wealth of insights to power your Facebook strategy in 2026.
Read on to find over 120 Facebook statistics covering engagement, users, advertising, revenue, and more.
Facebook Growth Statistics
Launched in February 2004 by Mark Zuckerberg and his classmates, Facebook made waves and hit over 1 million registered users1 in its first year.
With key features such as News Feed, Facebook Ads, and the famous like button driving up engagement, the social network grew 349x, hitting 350 million users in 2008.
In May 2012, Facebook Inc. (Facebook’s parent company) went public, raising $16 billion2 and debuting with a market cap of $104 billion.
At the time, Facebook Inc’s IPO was the largest tech IPO for a US company. That year, the social network also became the first online service of its kind to reach the significant milestone of over a billion users3.
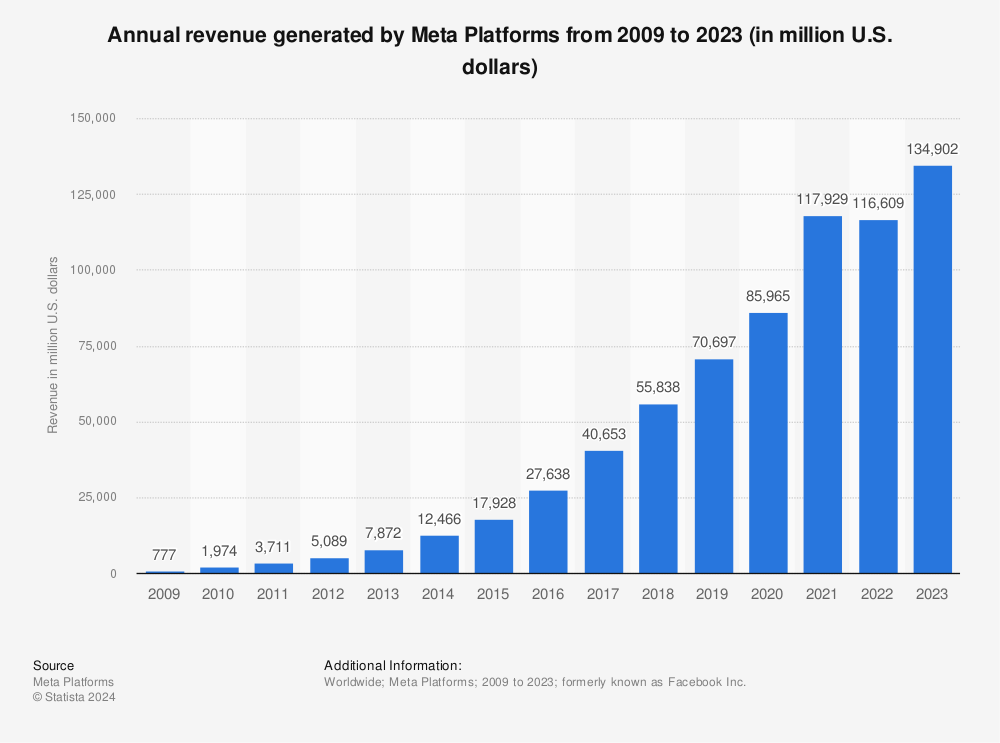
By 2018, Facebook had grown to over 2.3 billion users, and the company generated over $55 billion in revenue.
In addition, over 90% of Facebook’s ad sales came from mobile4.
At the end of 2021, Facebook's monthly active user base had grown to over 2.8 billion users, or nearly 40% of the world’s population.
- Growth was fueled by key features such as reactions, Facebook Marketplace, Facebook Dating, Facebook News, and Facebook Shops.
- Meanwhile, the social network’s parent company, Facebook Inc. hit a market cap peak of over $1 trillion in 20215.
- This milestone was driven primarily by Facebook’s mobile app and the company’s acquisition of Instagram and WhatsApp.
- To reflect its growth and ambitions beyond social media, Facebook Inc. rebranded to Meta that year, creating a Family of Apps comprising Facebook, Instagram, Whatsapp, and Messenger6.
By August 2024, Facebook had a 60.8% share of the global social media market7.
Additionally:
- Facebook’s algorithm had undergone over 100 updates since its inception in 2004.
- Facebook’s global operations were powered by 32 data centers in 40 different countries.
- Facebook was available in 100 different languages.
Facebook User Statistics
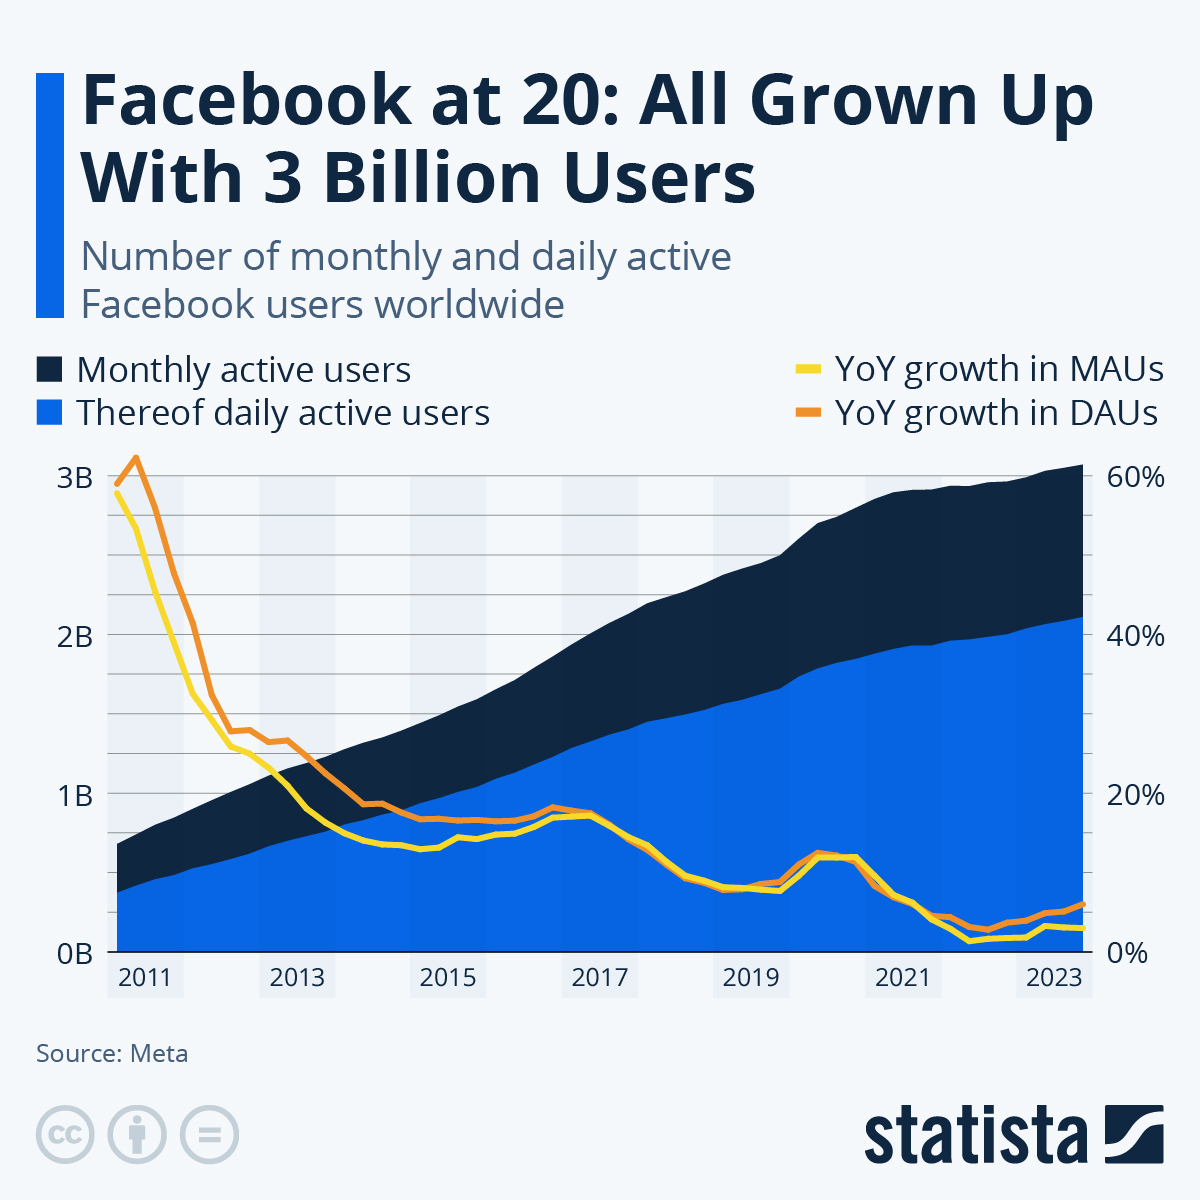
As of July 2024, Facebook had 3.07 billion global active users8.
Over the years, Facebook has seen a steady rise in global monthly active users:
- 4.1% from 2.95 billion users in 20239
- 5.5% from 2.91 billion users in 202210
- 12% from 2.74 billion users in 202111
Facebook had 2.11 billion daily active users (DAUs) in December 2023, an increase of 6% year-over-year12.
Globally the percentage of DAUs to MAUs for the period was 69%.
- In 2022, Facebook had 2 billion DAUs, while the percentage of DAUs to MAUs was 67%.
- In 2021, Facebook had 1.93 billion DAUs, while the percentage of DAUs to MAUs was 66%.
As of July 2024, 57% of Facebook users were male and 43% were female. Additionally, the majority (30.8%) of Facebook users were between the ages of 25-44.
Meanwhile:
- 22.6% of users were between the ages of 18-24.
- 20.2% of users were between the ages of 35-44.
- 12.2% of users were between the ages of 45-54.
- 7.9% of users were between the ages of 55-64.
- 6.3% of users were above the age of 65.
With over 378 million users, the country with the most Facebook users as of April 2024 was India. This was up 2.2% from 369.9 million users year-over-year13.
- The US came in second with over 198 million users, an increase of 6.5% from 186 million users in 2023.
- In third place was Indonesia with over 119 million users, an increase of 11.9% from 135 million users in 2023.
Table: Facebook Statistics by Country
| Rank | Country | Facebook Users in Millions |
|---|---|---|
| 1 | India | 378 |
| 2 | United States | 194 |
| 3 | Indonesia | 119 |
| 4 | Brazil | 113 |
| 5 | Mexico | 92 |
| 6 | Philippines | 89 |
| 7 | Vietnam | 75 |
| 8 | Bangladesh | 67 |
Facebook Revenue Statistics
As of June 2023, Facebook contributed to over 98% of Meta’s platform revenue14.
In 2022 and 2021, the company generated over 97% of its revenue from ad revenue.
Facebook generated $40 billion in revenue in 2023, up 24% from $32.2 billion in 2022 and 19% from $33.7 billion in 2021.
- The US and Canada generated $18.6 billion or 47% of Facebook’s revenue in 2023, up 21% from 15.4 billion in 2022.
- Europe generated $9.4 billion or 24% of Facebook’s revenue in 2023, up 34% from $7 billion in 2022.
- Asia-Pacific generated $7.5 billion or 19% of Facebook revenue in 2023, up 25% from $6 billion in 2022.
Facebook’s average revenue per user (ARPU) for 2023 was $13.12, up 21% from $10.86 in 2022 and 13% from $11.57 in 2021.
- At $68.44, the US and Canada had the highest ARPU in 2023, up 16% from $58.77 in 2022 and 13% from $60.57 in 2021.
- At $23.14, Europe had the second-highest ARPU in 2023, up 34% from $17.29 in 2022 and 18% from $19.68 in 2021.
- At $5.52, Asia-Pacific had the third-highest ARPU in 2023, up 20% from $4.61 in 2022 and 13% from $4.89 in 2021.
Reflecting the seasonal nature of Facebook’s revenue, the company’s revenue increased by an average of 17% between the third and fourth quarters of 2023, 2022, and 2021.
This was compared to revenue for the first quarters of 2023, 2022, and 2021, which fell by 11%, 17%, and 7% respectively.
Facebook Feature Statistics
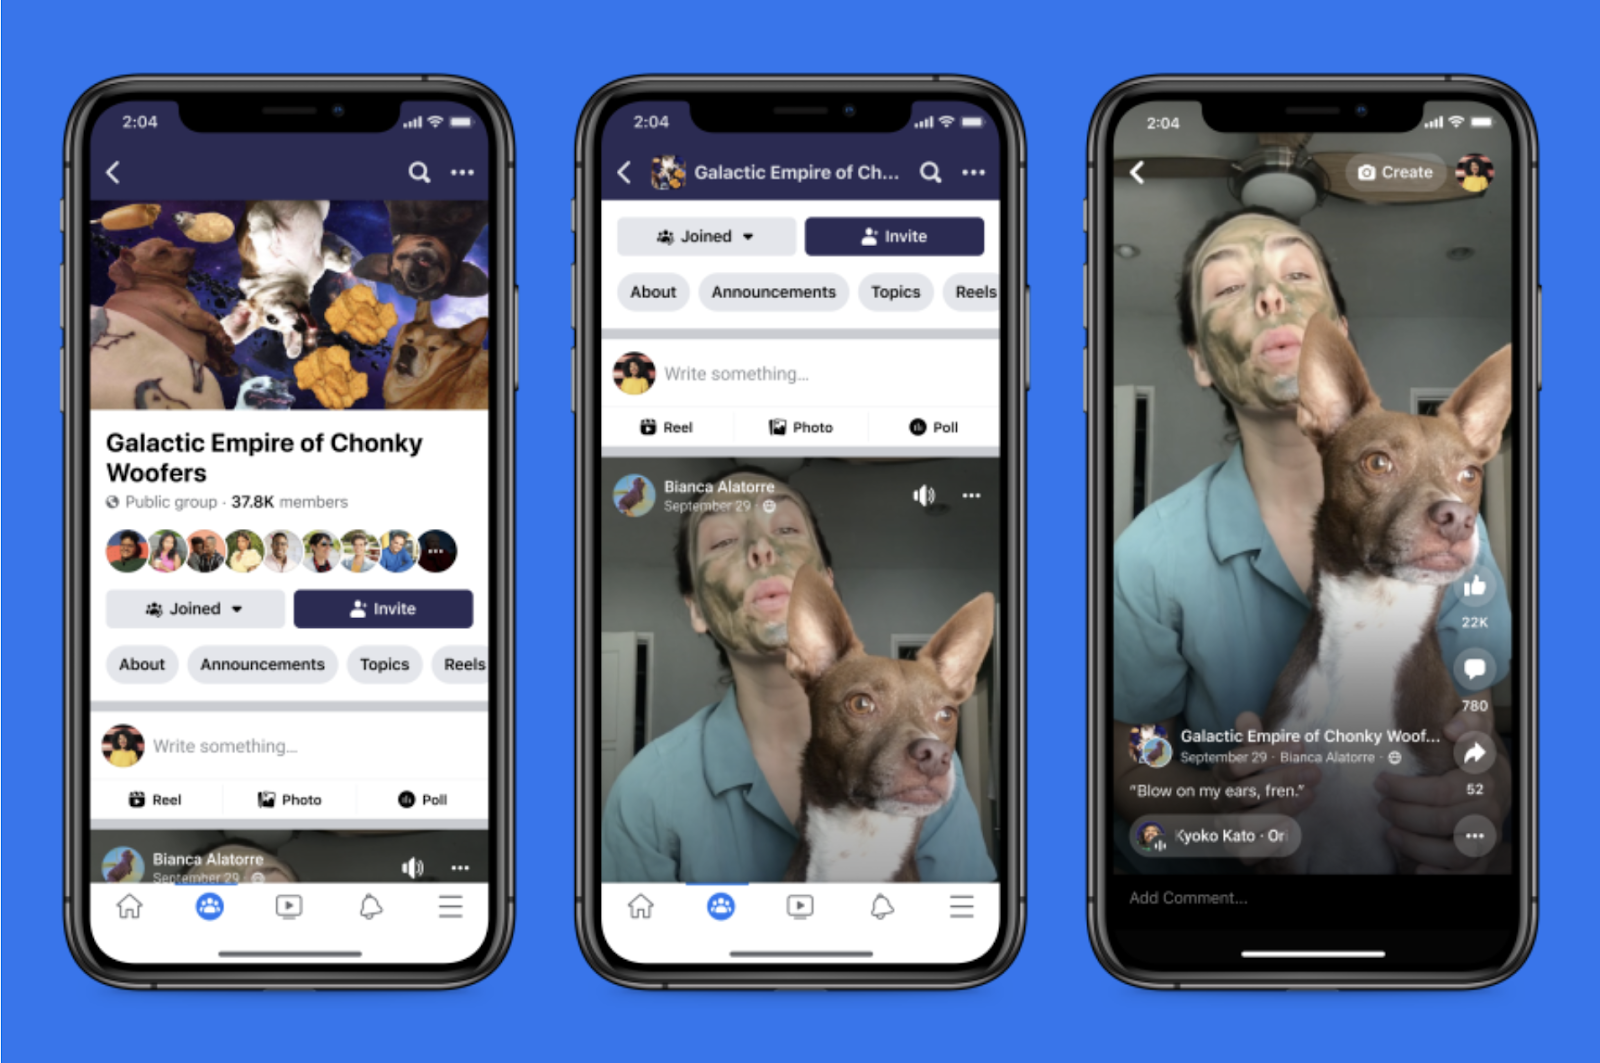
As of 2024, Facebook boasts key features like Feed, Reels, Stories, Groups, and Marketplace.
Facebook Groups Statistics
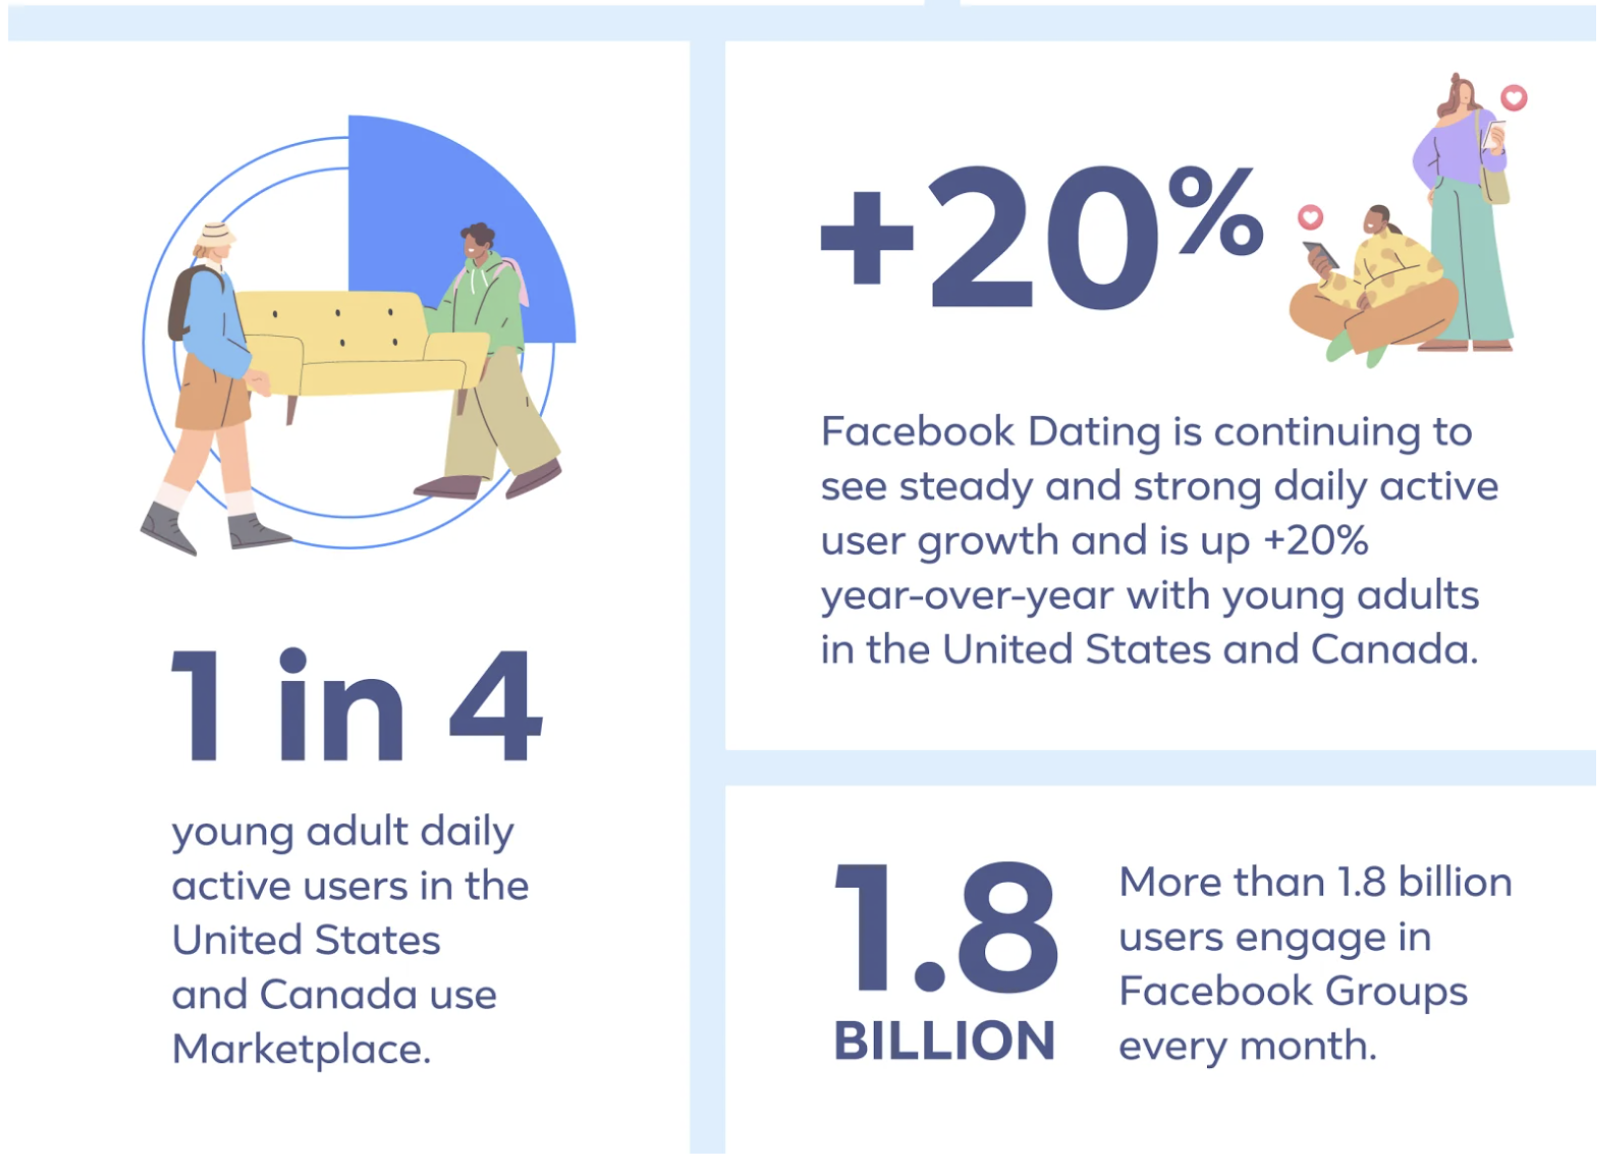
Over 1.8 billion people used Facebook Groups every month in 202415.
- In 2020, Facebook spent an estimated $10 million to run a 60-second commercial during Super Bowl LIV to promote Facebook Groups16.
- Between 2017 and 2024, Facebook Groups saw a 1,700% increase in usage and relevance.
- In 2017, there were 100 million Facebook users in groups they found meaningful. By 2019, this had increased to over 400 million.
In 2022, the average Facebook user was a member of at least 15 active groups.
That year:
- There were more than 100 million group joins per day17.
- That year, engagement via community chats also increased by 50%18.
- Managing these groups were over 70 million active admins and moderators19.
Facebook Messenger Statistics
As of July 2024, Facebook Messenger had 1 billion users, making it the third most popular messaging app in the world after WhatsApp and WeChat20.
Overall, the app’s user base has remained relatively constant since 2022, dipping slightly between quarters.
Facebook Messenger was downloaded 4 million times in July 2024.
According to Facebook, over 140 billion messages were sent on the app daily. The app also generated a total of $6,000 in revenue over the same period.
Over 50% of all Facebook Messenger users were between the ages of 18 and 34 in 2024.
Additionally, more men (19%) used the app compared to 15% of women.
Active Facebook Messenger users spent an average of 3 hours and 32 minutes per month on the app in 2024.
Usage was highest in Saudi Arabia where users spent close to 10 hours per month on the app.
Facebook Reels Statistics
As of 2024, Facebook reels were reshared 2 billion times per day21.
This was 2x higher than the first six months of 2023.
In Q1 2024, Facebook accounts with over 50,000 followers had an engagement rate of 2.18% on their Reels22.
In comparison, accounts with up to 10,000 followers had an engagement rate of 1.76% while accounts with less than 2000 followers had an engagement rate of 1.55%.
Facebook reels gained an average of 215 interactions in 2024.
This was slightly up from 214.77 interactions in 2023.
The most popular time content creators posted reels was 6 pm, with an average of over 60,000 Reels published on Facebook at that time23.
However, a 2024 study found that the highest average of Reels views were in the late hours of the day, particularly midnight. Facebook reels published at that time received 12,300 views on average.
Facebook reels drove 3x more views than other Facebook video content in 202324.
According to Facebook’s internal research, Reels with audio saw a 35% higher CTR than other types of video content on the platform.
In terms of positive brand outcomes, Reels:
- Increased ad recall by 54%
- Increased purchase intent by 93%
- Increased purchase intent among Gen Z by 145%
Facebook Stories Statistics
As of 2024, over 500 million people used Stories daily and 1 billion stories were shared daily across the Facebook family of apps25.
- 73% of users in the US agreed that stories allowed them to experience new things.
- 65% said stories helped them feel closer and more up-to-date with friends.
- 57% said stories made them feel part of a larger community.
- 62% said they planned to use stories even more in the future.
Over 4 million advertisers used Story ads monthly26.
Facebook Stories drove cost-efficient brand lift on par with Facebook feed and Instagram Stories. After seeing a product/service in a story 58% of Facebook users browsed the brand's website to get more information, 50% visited websites where they could purchase it and 31% visited a shop to have a look.
In terms of what Facebook users were most interested in seeing from brands in Stories:
52% said they wanted Stories that were quick and easy to understand.
50% wanted to be introduced to new products, while 46% wanted Stories offering tips or advice.
Facebook Marketplace Statistics
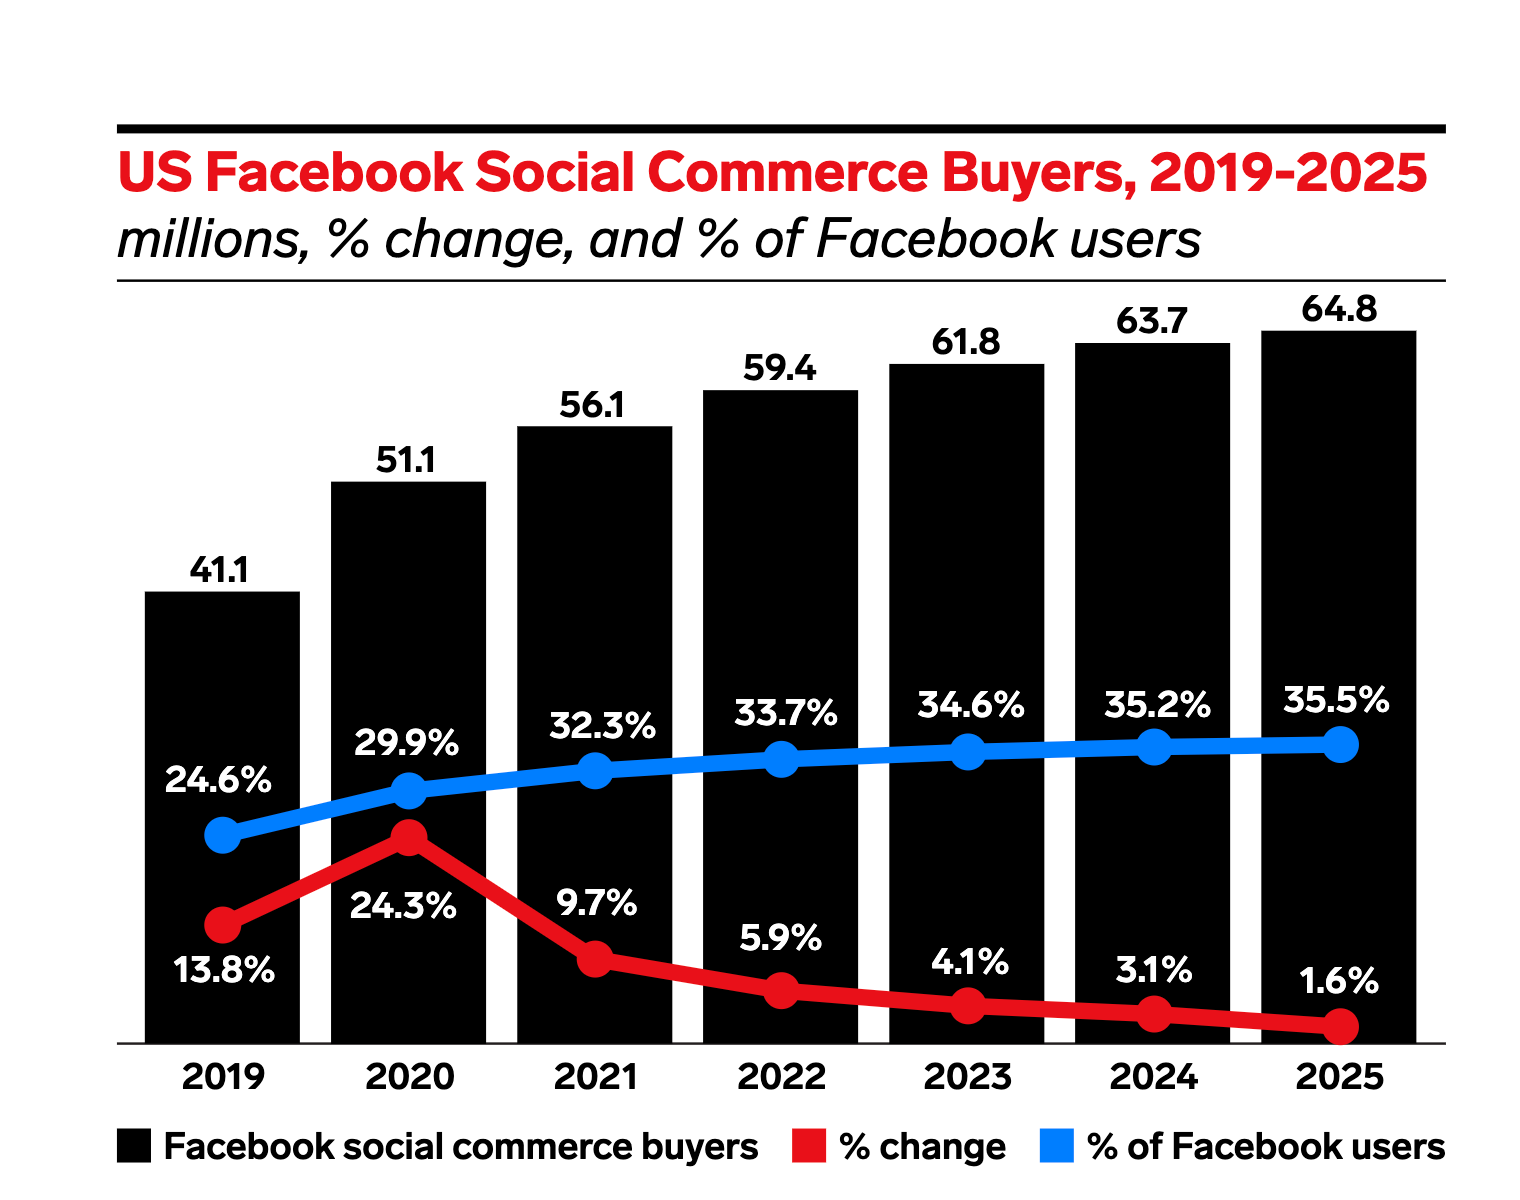
In 2024, 37% or over 64 million Facebook users in the US used the platform for social commerce27.
Facebook was second to TikTok (40.8%) but ahead of Instagram (35.0%) in terms of social buyer penetration in 2024.
Facebook Marketplace was projected to reach $30 billion in annual revenue by 2024.
$26 billion in gross revenue was made on Facebook Marketplace in 2022, up 48% from revenue generated in 2021.
Facebook Marketplace had over 1.2 billion users and 800 million monthly visits as of 202428.
This was ahead of ecommerce giants such as Amazon with 310 monthly users and eBay with 132 million users.
Over 60% of Facebook Marketplace users were female in 2024.
Additionally, the 25-34 age group used Facebook Marketplace most frequently and accounted for 34% of the platform’s user base.
33% of people around the world, and up to 55% of people in the US used Facebook Marketplace as their default local buy and sell source in 202429.
27% of consumers selected Facebook as the social platform they were most likely to purchase on.
49% of consumers used Facebook to find local businesses in 2024.
This made Facebook the top social media platform for discovering local businesses and
the third most popular business information source behind Google Search (72%) and Google Maps (51%).
In 2022, over 100 million businesses actively used Facebook Marketplace30.
Additionally, the platform had over 250 million active sellers.
70% of Facebook Marketplace transactions took place between users located within 60 miles of each other.
The top categories of items sold on Facebook Marketplace were clothing, home goods, and furniture.
Facebook Engagement Statistics
There were over 5 billion social media users in 2024 or 62.3% of the world’s population, up 5.6% or 266 million from 2023.
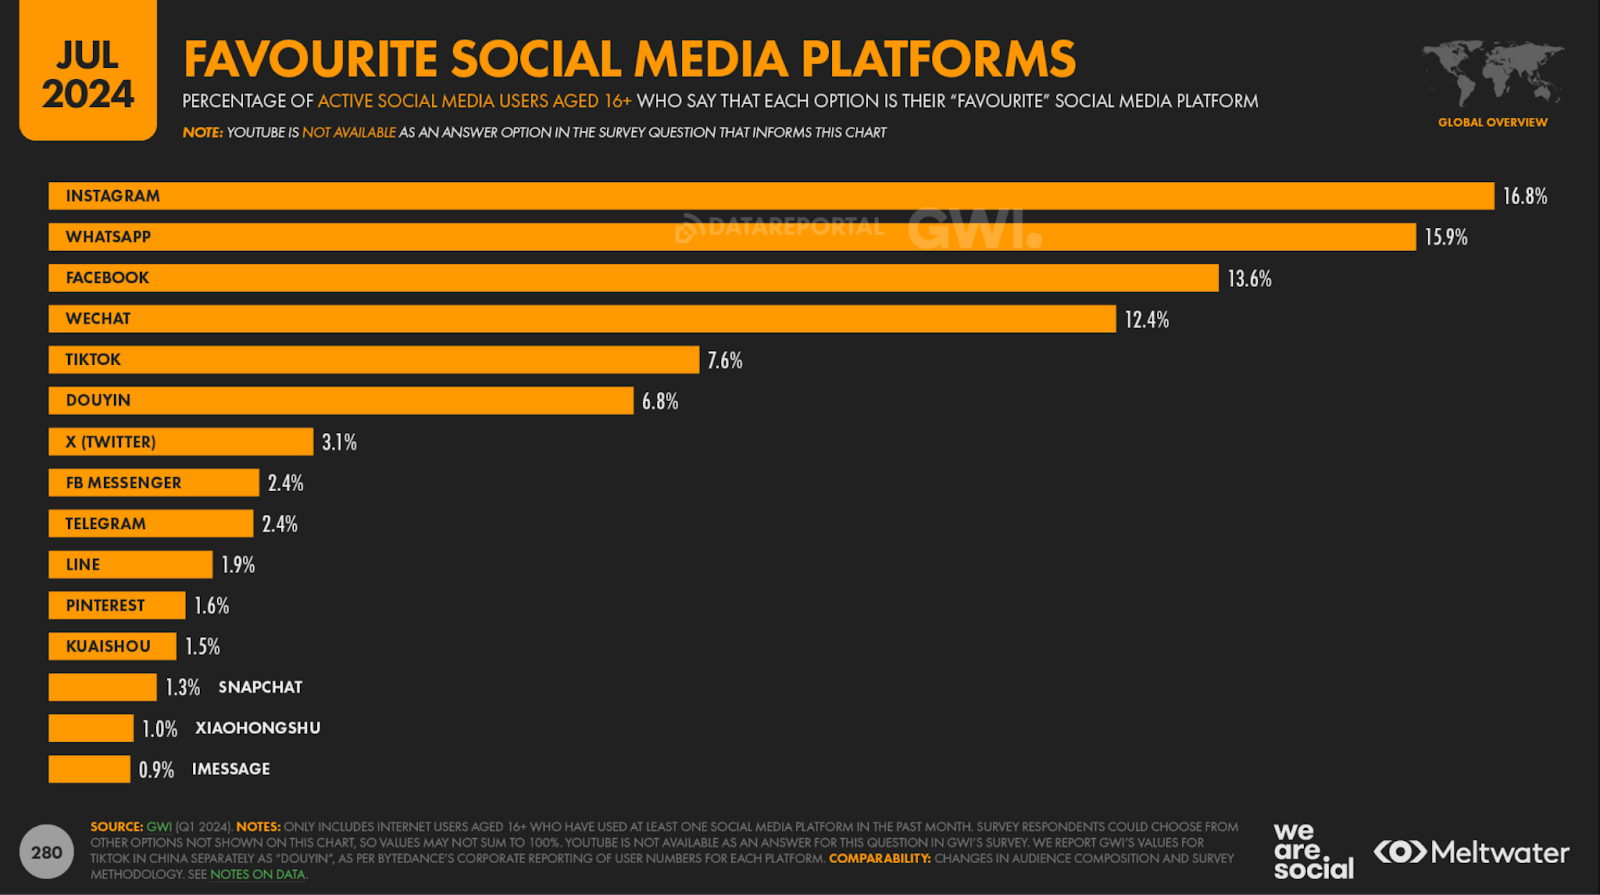
Of all active social media users aged 16 and above, 13.6% considered Facebook their favorite social media platform.
This placed Facebook in third place slightly behind Instagram and WhatsApp which were considered the top favorite social media platform by 16.8% and 15.9% of social media users, respectively.
Facebook was also the world’s third most-visited website, with over 15.6 billion average monthly visits.
In the three months between 1 April and 30 June 2024:
- 1.37 billion were unique monthly visits.
- The average time per visit was 10 minutes and 31 seconds.
- Users visited an average of 10 pages per visit.
Facebook had a 3.4% share of traffic to the world’s top 10,000 websites.
This was just behind leader Google with a share of 18.3% and YouTube with 7%.
Between March and June 2024, the mobile Facebook app achieved the following rankings:
- Second for total time spent, just behind YouTube.
- Third for most downloads just behind TikTok and Instagram.
- Fifth in terms of monthly active users.
Facebook placed sixth in terms of top Google searches between April and July 2024.
This was behind:
- #1 - Google
- #2 - Youtube
- #3 - Weather
- #4 - Web
Between March 2024 and June 2024, Facebook’s mobile app ranked third in terms of active users.
This was just behind YouTube with an active user index of 100 and WhatsApp with an index of 84.9.
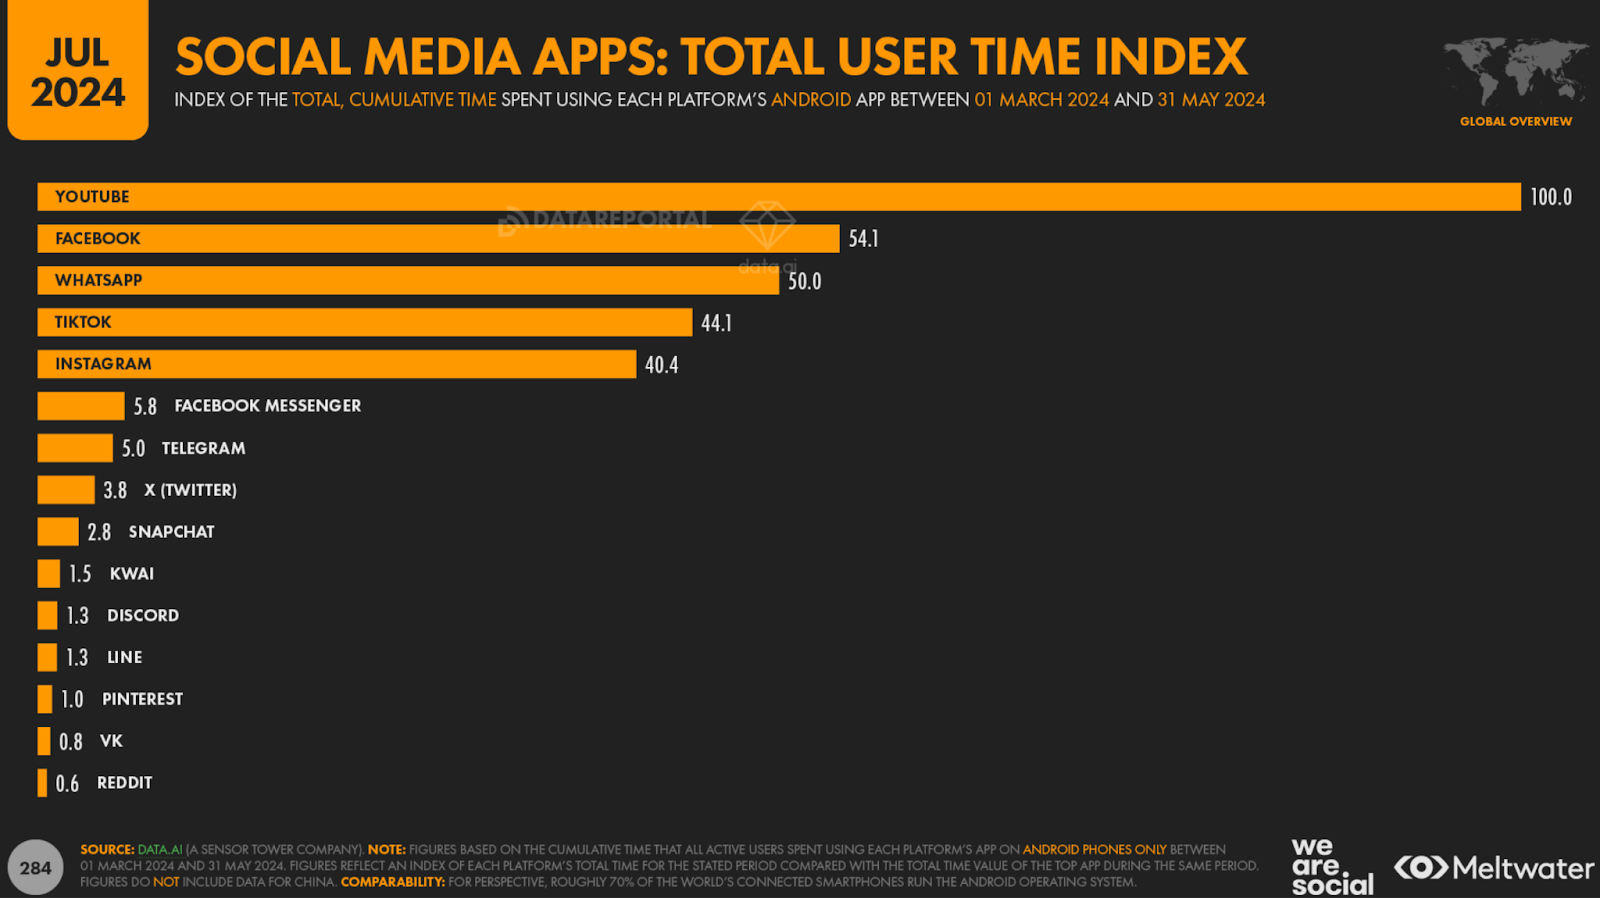
During the same period, Facebook’s app had a total time user index of 54.1, placing it second in terms of total cumulative time spent by users.
This was just behind YouTube with an index of 100.
72% of active Facebook users used the app primarily for messaging friends and family in 2024.
Additionally:
- 63.2% used the app to post or share photos or videos.
- 58% used the app to keep up with news and current events.
- 55% used the app to look for funny or entertaining content.
- 53% used the app to follow or research brands and products.
A further 53% of active social media users aged 16 to 64 used Facebook for researching products and brands.
This was just behind Instagram which was used by 63% of social media users.
As of July 2024, an average of 1.75 page posts per day were made on Facebook.
- 42.9% of these posts were link posts.
- 34.3% were photo posts.
- 19.3% were video posts.
- 3.5% were status posts.
The Facebook page post engagement rate for all Facebook post types was 0.05% in 2024.
Photo posts had a slightly higher engagement rate of 0.09%.
Meanwhile:
- Video posts had an engagement rate of 0.06%
- Status posts had an engagement rate of 0.04%
- Link posts had an engagement rate of 0.02%
The Facebook page post engagement rate as a percentage of total page followers was highest for video posts (0.30%).
This was followed by:
- Reels at 0.26%
- Photo posts at 0.24%
- Album posts at 0.22%
- Status posts at 0.12%
- Link posts at 0.06%
The Facebook page post engagement rate as a percentage of post reach was highest for status posts (12.25%).
This was followed by:
- Reels at 10.45%%
- Link posts at 6.7%
- Album posts at 5.6%
- Photo posts at 5.15%
- Video posts at 4.25%
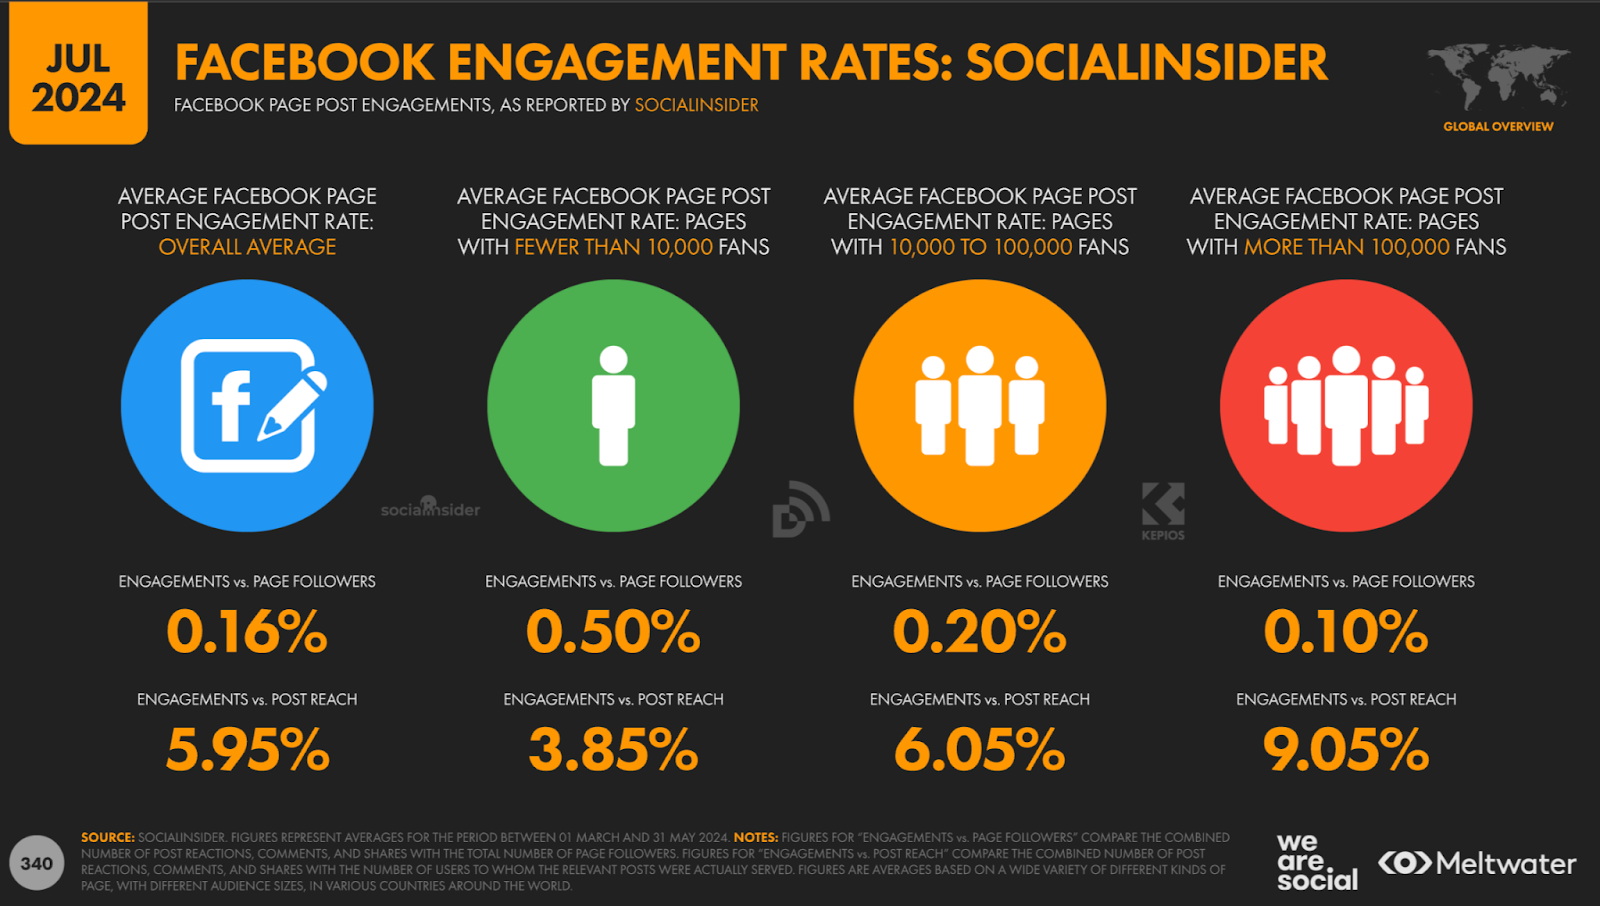
The average Facebook page post engagement rate for pages with fewer than 10,000 fans was 0.51%.
Pages with 10,000-100,000 fans had an engagement rate of 0.18% while those with more than 100,000 fans had an engagement rate of 0.03%.
As of July 2024, the Facebook page with the most followers was the Facebook App with 189 million followers.
This was followed by:
- Cristiano Ronaldo - 170 million followers
- Samsung - 162 million followers
- Mr Bean - 141 million followers
- 5-minute Crafts - 126 million followers
Over 2 billion users watched videos each month in 202431.
Additionally, Facebook users spent 50% of their time watching videos on Facebook.
According to Meta, in Q2 2024, 59.3% of views in the US came from posts shared by people’s friends, joined groups and pages they followed32.
Of the remaining 40.7% of Feed content views in the US, 29.6% came from in-Feed recommendations or unconnected posts. The remaining 11.2% came from less common products like Events.
The same data revealed that over 96% of views in the US during the same period did not include a link to a source outside of Facebook.
The 3.3% of posts that included a link typically came from a page a person followed.
As of July 2024, the average Facebook user opened the app around 31 times each month.
This placed Facebook in fifth place in terms of average monthly sessions, behind:
- Whatsapp - 912 sessions
- Instagram - 348 sessions
- Line - 327 sessions
- TikTok- 311 sessions
Facebook users also spent an average of 18 hours and 45 minutes on the app between March and June 2024.
Facebook ranked third in terms of time spent per user, trailing TikTok (31 hours and 43 minutes) and YouTube (28 hours and 41 minutes).
The Facebook mobile app was downloaded a total of 7 million times in July 202433.
The data showed that the app generated $5 million in revenue over the same period.
Facebook was the second most popular social media site in the US, with over 68% of adults saying they used the app in 202334.
YouTube was the most widely used social media site with 83% of US adults reporting that they regularly used it.
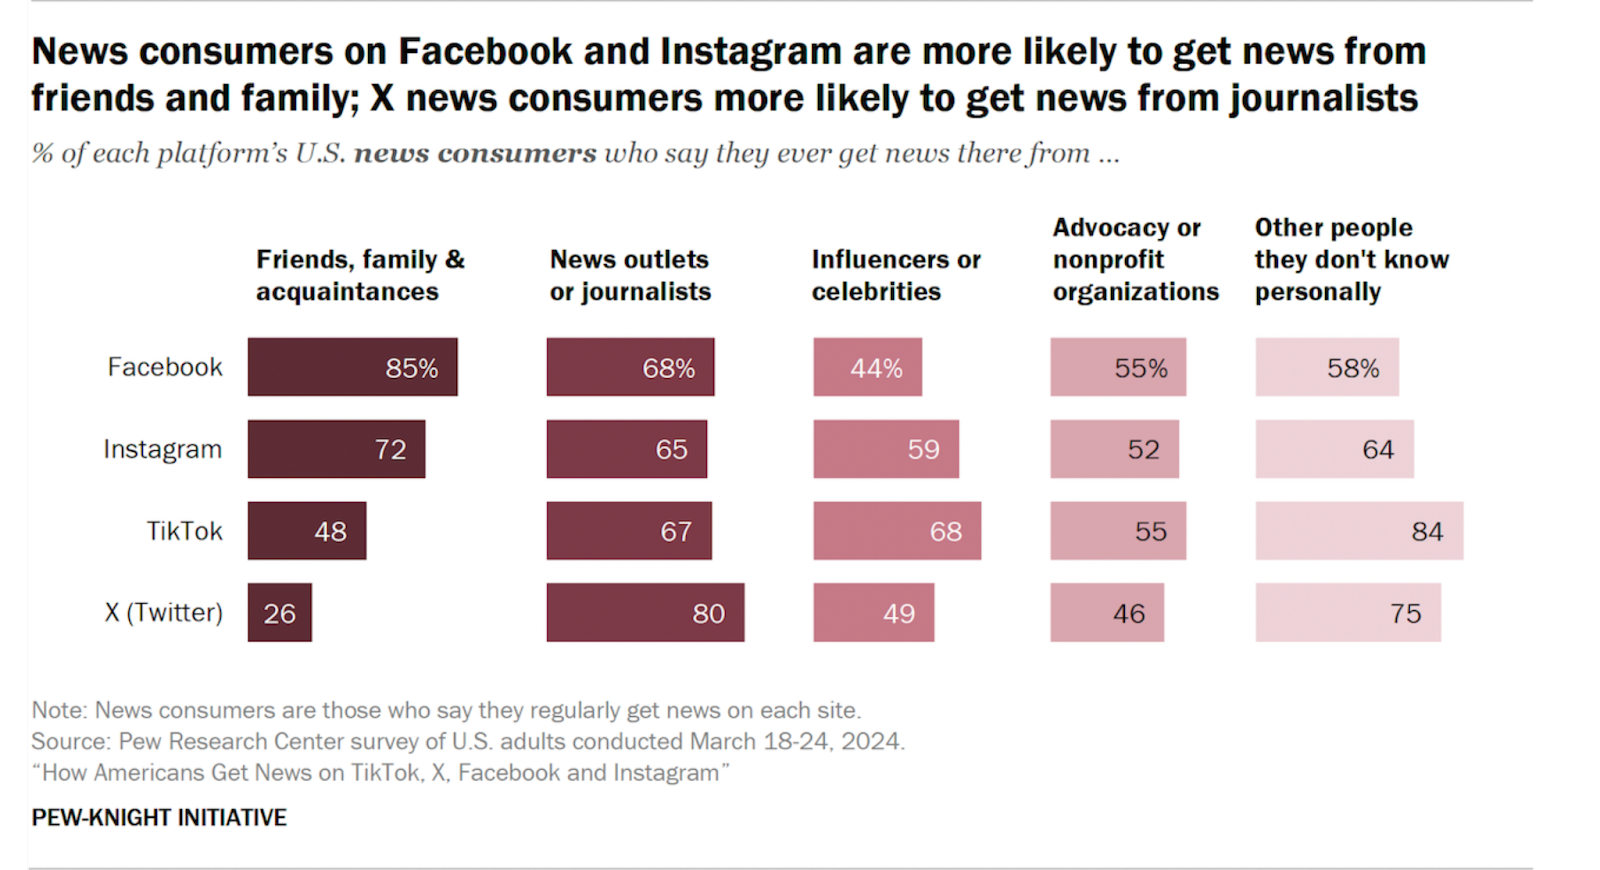
In 2023, Facebook was the most widely used news source for Americans, with 30% of adults saying they regularly got their news from the platform.
- 85% of news consumers on Facebook got their news from friends, family, and acquaintances.
- 68% got their news from news outlets or journalists.
- 55% got their news from advocacy or non-profit organizations.
- 44% got their news from influencers or celebrities.
Based on 2022 Facebook Data, every month, a typical Facebook user:
- Liked a median of 11 Facebook posts35
- Left a median of 5 comments on Facebook posts.
- Reshared 1 post.
- Clicked or tapped on a median of 12 Facebook ads or sponsored posts.
81.8% of Facebook mobile users accessed the platform via an app on an Android device in 2021.
14.8% of Facebook mobile users accessed the platform on an Apple iOS device while 3.4% accessed the platform via a mobile web browser.
Facebook Advertising Statistics
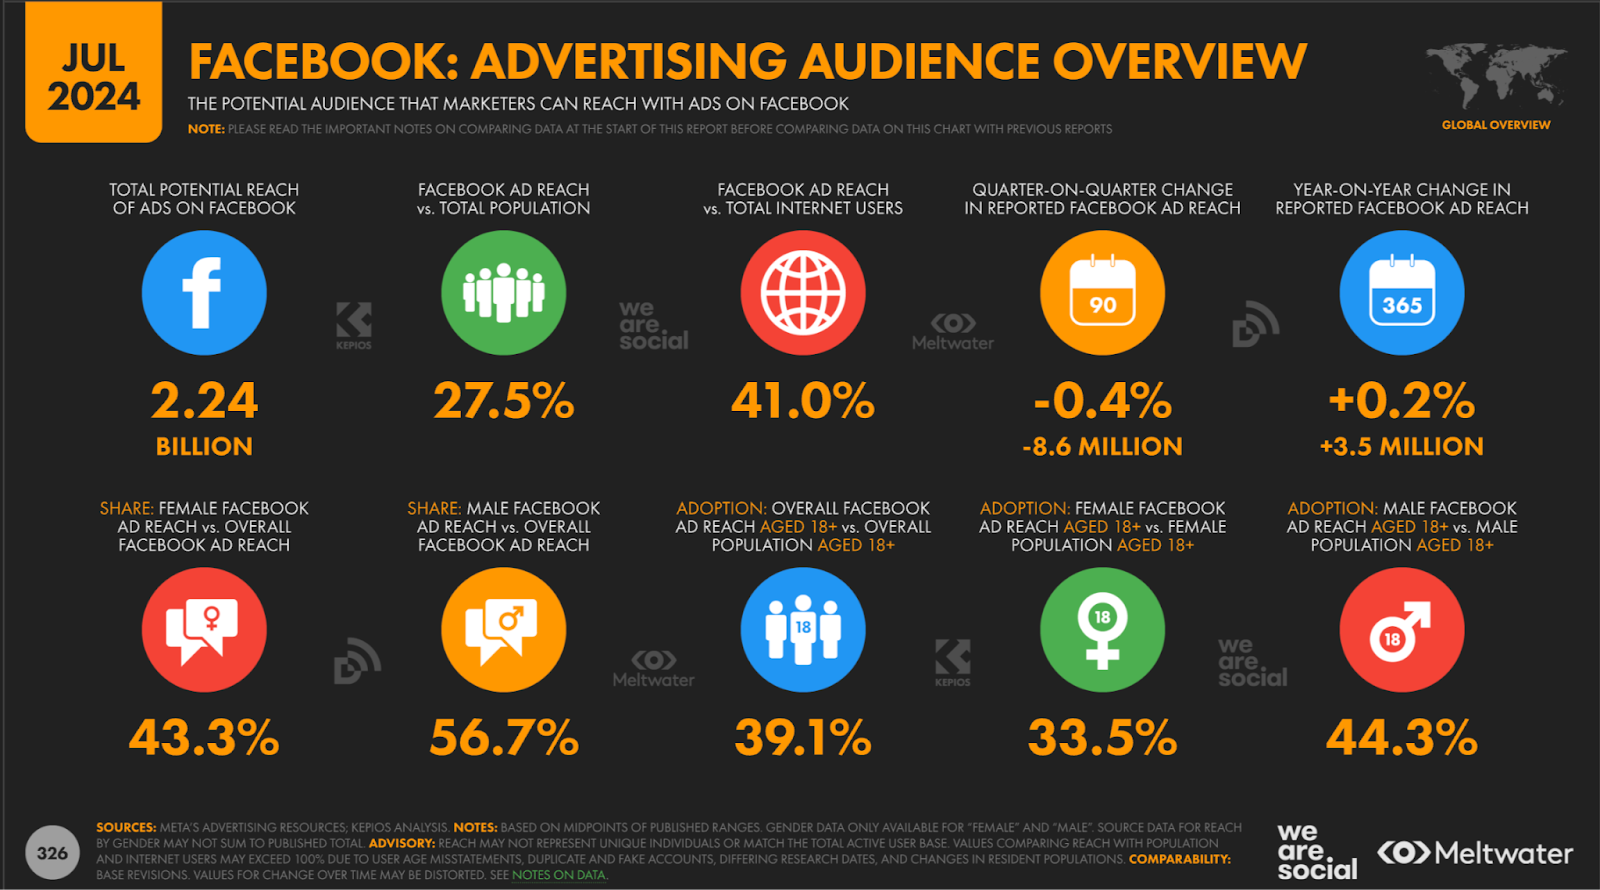
Facebook had a potential ad reach of 2.24 billion, with over 10 million advertisers actively using its ad services36.
This placed Facebook ahead of other top social media platforms such as:
- YouTube with a potential ad reach of 2.17 billion.
- TikTok with a potential ad reach of 1.60 billion.
- Instagram with a potential ad reach of 1.60 billion.
- LinkedIn with a potential ad reach of 1.10 billion.
Facebook’s overall ad reach vs the overall population of internet users aged 18 and over was 39%.
Male Facebook ad reach for the same age group was 44% while female Facebook ad reach was 34%.
As of July 2024, only 0.6% of active social media users were unique to Facebook. A majority of Facebook users (77.6%) were also Instagram users.
Other platforms used by Facebook users were:
- Youtube - 73.4%
- Whatsapp - 72.9%
- TikTok - 52.1%
In terms of whether Facebook ads are worth it, most businesses in a 2024 study by Wordstrem stated that their Facebook ad results had improved year-over-year37.
Meanwhile, according to Meta, AI-powered Facebook ad targeting resulted in 68% lower costs per purchase. It also reduced the cost per conversion by an average of 17% and decreased the cost per acquisition by 26%.
The click-through rate for Facebook ad traffic campaigns increased from 0.9% in 2023 to 1.51% in 2024 in 9 out of 19 industries.
The industries with the highest CTR were Arts and Entertainment at 2.55%, Real estate at 2.45% and Restaurants and Food at 2.29%.
The average cost per click for Facebook ad traffic campaigns across all industries was $0.83.
This was much lower than the average cost per click of $4.22 for Google ads. Additionally, the industries with the lowest cost per click were Travel at $0.43, Arts & Entertainment at $0.44, and Restaurants & Food at $0.52.
For lead gen campaigns, the click-through rate across all industries was 2.5%.
The industries that saw the best CTRs were Travel at 6.62%, Art & Entertainment at 3.7%, and Real Estate at 3.7%.
The average cost per click for lead generation campaigns across all industries was $1.92.
The industries with the lowest CPC were Arts and Entertainment at $0.87, Travel at $0.96, and Sports & Recreation at $1.11.
In terms of conversions, the conversion rate for Facebook ad lead generation campaigns across industries was 8.25%.
The industries with the highest conversion rates were Dentists & Dental Services at 11.34%, Industrial & Commercial at 10.13% and Arts & Entertainment at 9.77%
The average cost per lead for lead generation campaigns across industries was $23.10.
The industries with the lowest cost per lead were Real Estate at $12.43, Arts & Entertainment at $13.46, and Sports & Recreation at $15.33.
Vertical video with audio Reels ads drove 110% higher conversion rates38.
Running partnership ads on Reels resulted in a 25% higher CTR, 20% higher conversion rates, and 22% higher playthroughs.
The average CPM for ads targeting women was $6.01 and $4.92 for men in 202439.
The CPM for both genders remained relatively consistent throughout the week with a dip on Fridays ($8.35 for women and $5.70 for men) and a peak on Saturdays ($11.16 for women and $6.56 for men).
In terms of monthly variations, January was the most cost-effective month for advertising with a CPM of $10.16 for women and a CPM of $7.27 for men.
On the other hand, November had the highest CPM values at $15.52 and $10.35 for women and men, respectively.
Facebook Business Statistics
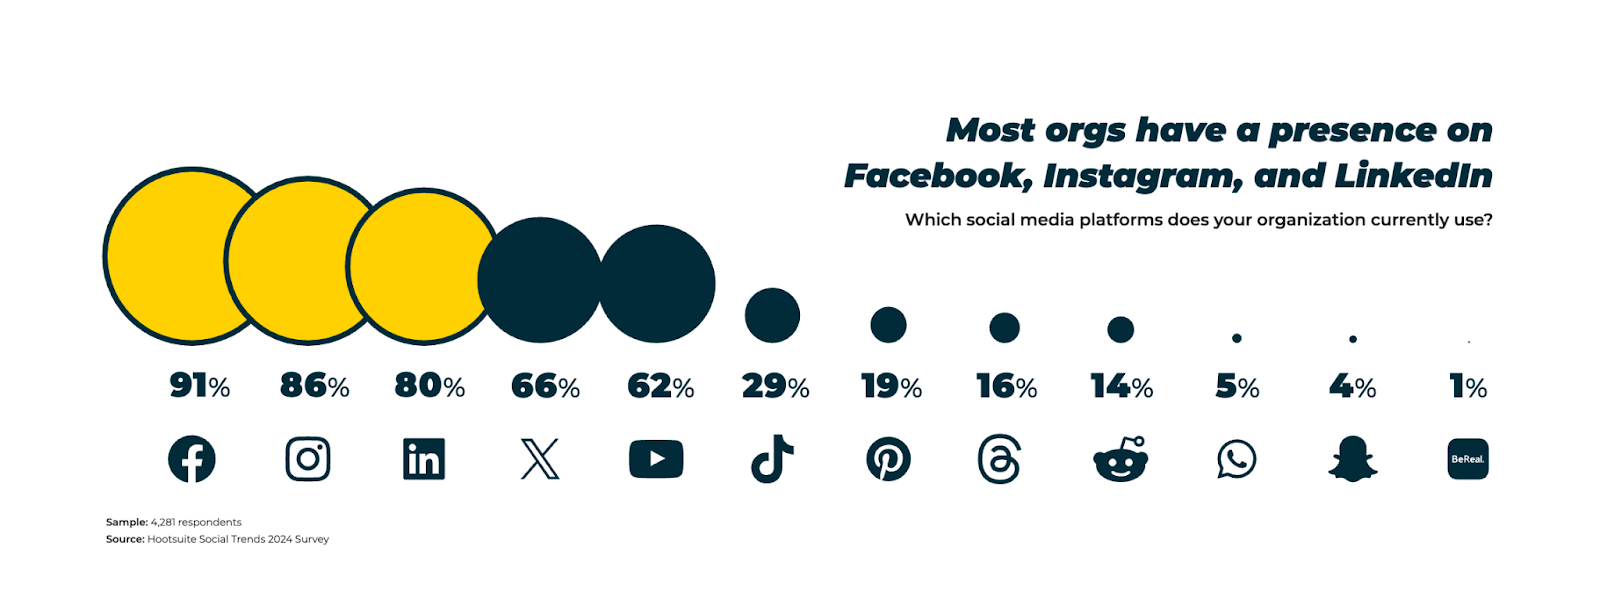
In 2024, 91% of businesses had a presence on Facebook40.
Businesses posted on Facebook an average of 4.69 times a week across all verticals. Leading media brands posted an average of 64.4 posts per week.
In 2024, 57% of marketers named Facebook as their top marketing channel41.
22% of social media marketers stated that Facebook had the second-highest ROI in 202442.
This was just behind YouTube (25%) and just ahead of Instagram 21% and TikTok (14%). Additionally, 18% of marketers believed that Facebook offered brands the biggest opportunity to grow their audience in 2024, up from 17% in 2023.
26% of marketers ranked Facebook as the social media advertising platform with the second-best audience targeting tools.
Consequently, 22% of social media marketers planned to invest in Facebook.
89% of social media marketers used Facebook to promote their business43.
Facebook was the top social media platform used by both B2B and B2C brands. For B2B brands, in particular, Facebook had the highest ROI.
Facebook Influencer Statistics
71.5% of influencers in the US were expected to use Facebook in 202444.
Additionally, spending on influencer campaigns on Facebook was expected to hit $1 billion for the year.
Facebook campaigns that incorporated influencers were 85% more likely to drive consumers to add products to their shopping carts45.
- 84% of global consumers said they would purchase, try, or recommend a product based on influencer content.
- 60% of global consumers said they’d follow a brand or service after seeing it promoted by an influencer that shared their values and interests.
Influencers posted an average of 3.9 times per week on Facebook in 202346.
While influencers made fewer posts than businesses and brands on average, they garnered the highest level of engagement across all verticals.
The average engagement rate of influencer posts on Facebook was 0.16% in 2023.
This was the highest engagement rate ahead of image posts (0.1%) and brand posts (0.06%)
Facebook Safety Statistics
As of 2024, over 62% of Facebook users encountered scams weekly47.
Some of the most popular scams included:
- Fake prizes and giveaways
- Charity scams
- Marketplace scams
- Facebook phishing scams
- Facebook spoofing
In the first 6 months of 2024, Facebook removed 758 pieces of spam content48.
In 2023, over 3 billion pieces of spam content were removed from Facebook.
In Q2 2024, fake accounts represented 3% of worldwide monthly active users, and Facebook took action on over 1.8 billion of them.
Meanwhile, for 2023, fake accounts represented 4% of worldwide monthly active users, and Facebook took action on over 2.6 billion of them.
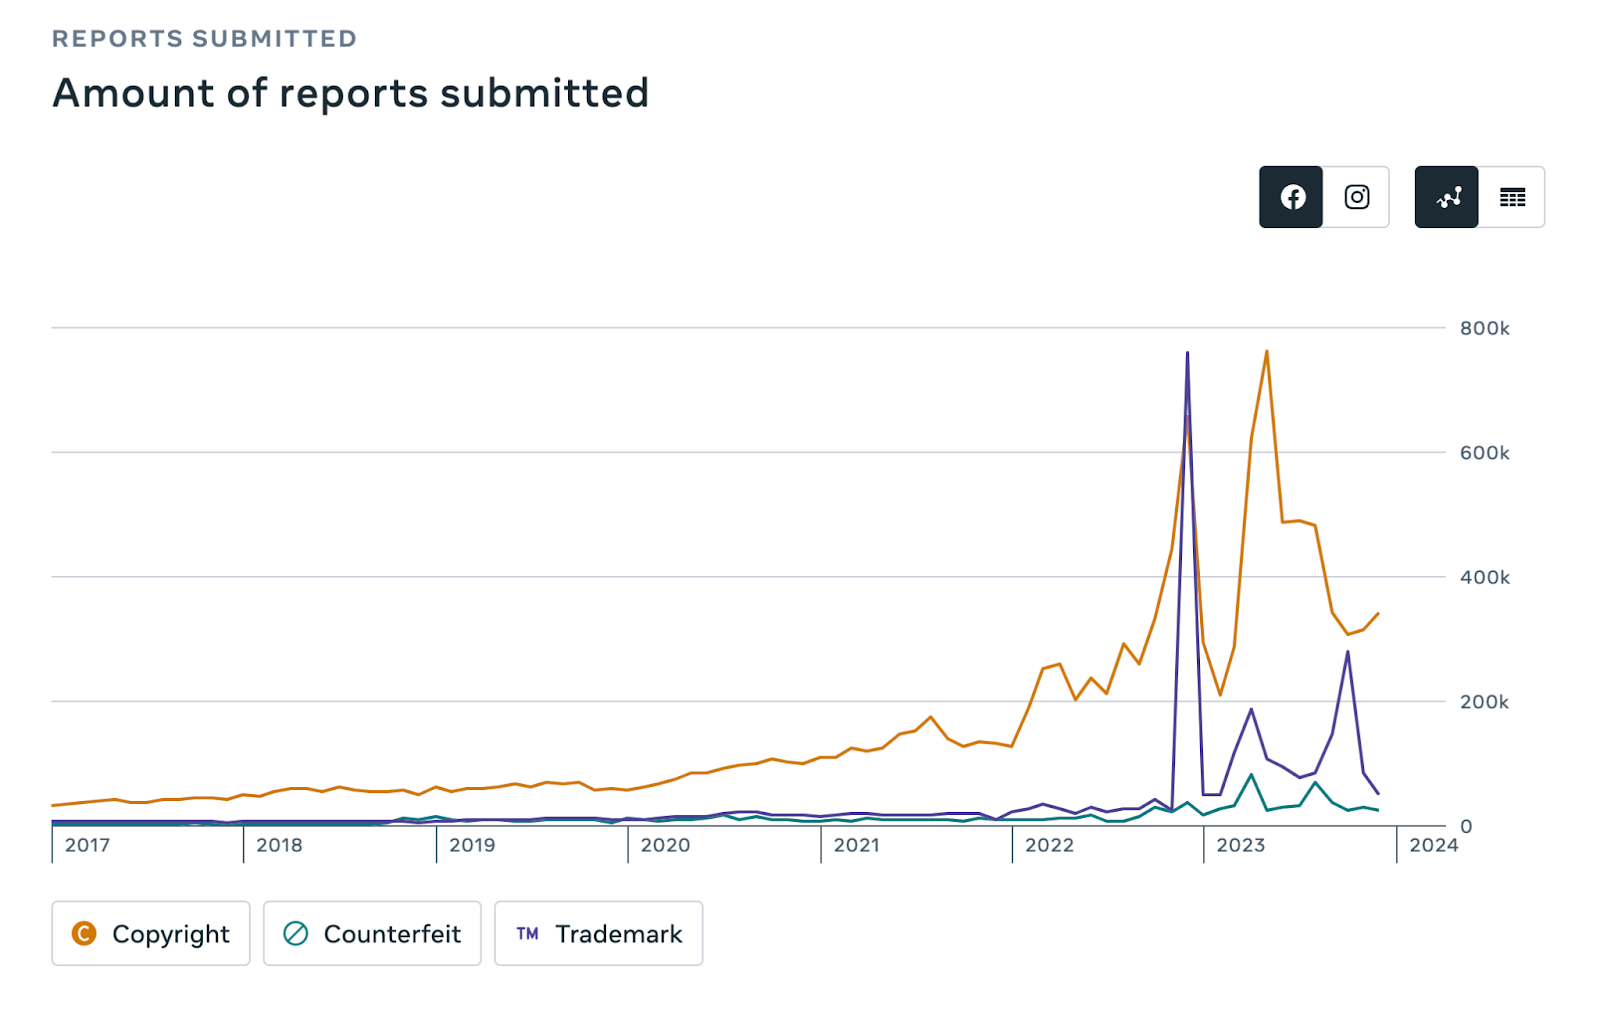
In 2023, Facebook received over 1.33 million trademark violation reports49.
The platform removed an average of 67% of all reported trademark violations.
Close to 5 million copyright infringement reports were made in 2023.
Facebook removed an average of 79% of all reported content.
Over 436,000 counterfeit IP reports were made in 2023.
Facebook removed an average of 85% of all reported counterfeit IP content.
A 2023 study found that up to 34% of Facebook Marketplace ads were scams, costing consumers an estimated $79 million50.
The items most commonly associated with scams on the platform were:
- Vehicle Parts - 21%
- Phones - 7%
- Shoes and Clothing - 7%
- Game consoles and accessories - 7%
- Concert and festival tickets - 6%
Future of Facebook Statistics
Young adult app usage in the US and Canada has seen growth over five consecutive quarters, reaching its highest levels in 202451.
- 25% of this demographic now uses Marketplace.
- Over 20% of this age group now uses Facebook Dating.
With over 40 million young adults (18-29) in the US and Canada using Facebook daily, Facebook plans to expand its AI capabilities and have the world’s best recommendation technology by the end of 2026.
Facebook plans to make improvements to its video experience.
With private video-sharing increasing by 80% year-over-year, Facebook plans to focus on upgrading its video-sharing capabilities.
In the 18 months leading up to May 2024, Facebook’s Professional Mode surpassed over 100 million daily active users.
With the creator economy expected to surpass $156.4 billion by 2030, Facebook is making it easier for anyone to become a creator and earn money through Professional Mode.
Make Money With Facebook and Whop

Facebook is a great way to meet paying customers, but doesn't provide great monetization options. If you try to monetize your Facebook group or page with in-built monetization methods you will be very limited as to what you can monetize and how you can make money with it. You will need a large number of followers, a huge amount of engagement, and you may even be prevented from making money by your location. So instead of relying purely on Facebook to make money you should also use Whop.
Whop can be used with your Facebook group or page. While Facebook will act as the home for your community, Whop will act as your business hub. With Whop, you can make and sell online courses, sell ebooks, paywall content, ask for donations, sell subscriptions, and more.
For all of this you are only charged a 2.7% + $0.30 transaction fee - no monthly payments. Plus, Whop takes care of your payments so you can focus on your community.
Start making money with Facebook and Whop today.
Sources
References
- WeForum
- CNBC
- Statista
- SEC
- CNBC
- CNBC
- GS StatCounter
- Data Reportal
- Data Reportal
- Data Reportal
- Data Reportal
- SEC
- Statista
- Statista
- CNBC
- Oberlo
- Statista
- Statista
- Emplifi
- eMarketer
- Yahoo
- Hootsuite
- Scoop
- Meta
- Meta
- Sensor Tower
- Pew Research
- Data Reportal
- WordStream
- Lebesgue
- Hootsuite
- Hubspot
- Hubspot
- Statista
- eMarketer
- Identity Guard
- Meta
- Meta
- Sky News