Explore over 150 Influencer Marketing Statistics for 2026. We cover influencers, consumer behavior, key strategies and more to help guide your efforts.
Key takeaways
- Nano influencers deliver the highest engagement rates (4.39%), making them cost-effective partners for brands seeking authentic connections.
- Consumer trust drives results: 86% of consumers made influencer-inspired purchases, with genuine reviews being the top motivator.
- TikTok dominates influencer strategy with 89% planning to use it, while brands should prioritize value alignment over follower count.
Influencer Marketing, which leverages the power of influential creators to promote products and services, has emerged as one of the most effective forms of online marketing. Since 2019, the industry has tripled in size, surpassing $24 billion in value.
With projections pointing towards continued growth, understanding key influencer marketing trends and strategies is essential for making informed decisions.
That’s why we’ve consulted a range of sources to deliver over 150 influencer marketing statistics for 2026.
Keep reading to discover all you need to know about the influencer marketing industry, influencers, consumer sentiments and more.
Influencer marketing industry statistics
By 2032, the global influencer marketing industry is set to hit $200 billion, representing a CAGR of 28.6% over 8 years1.
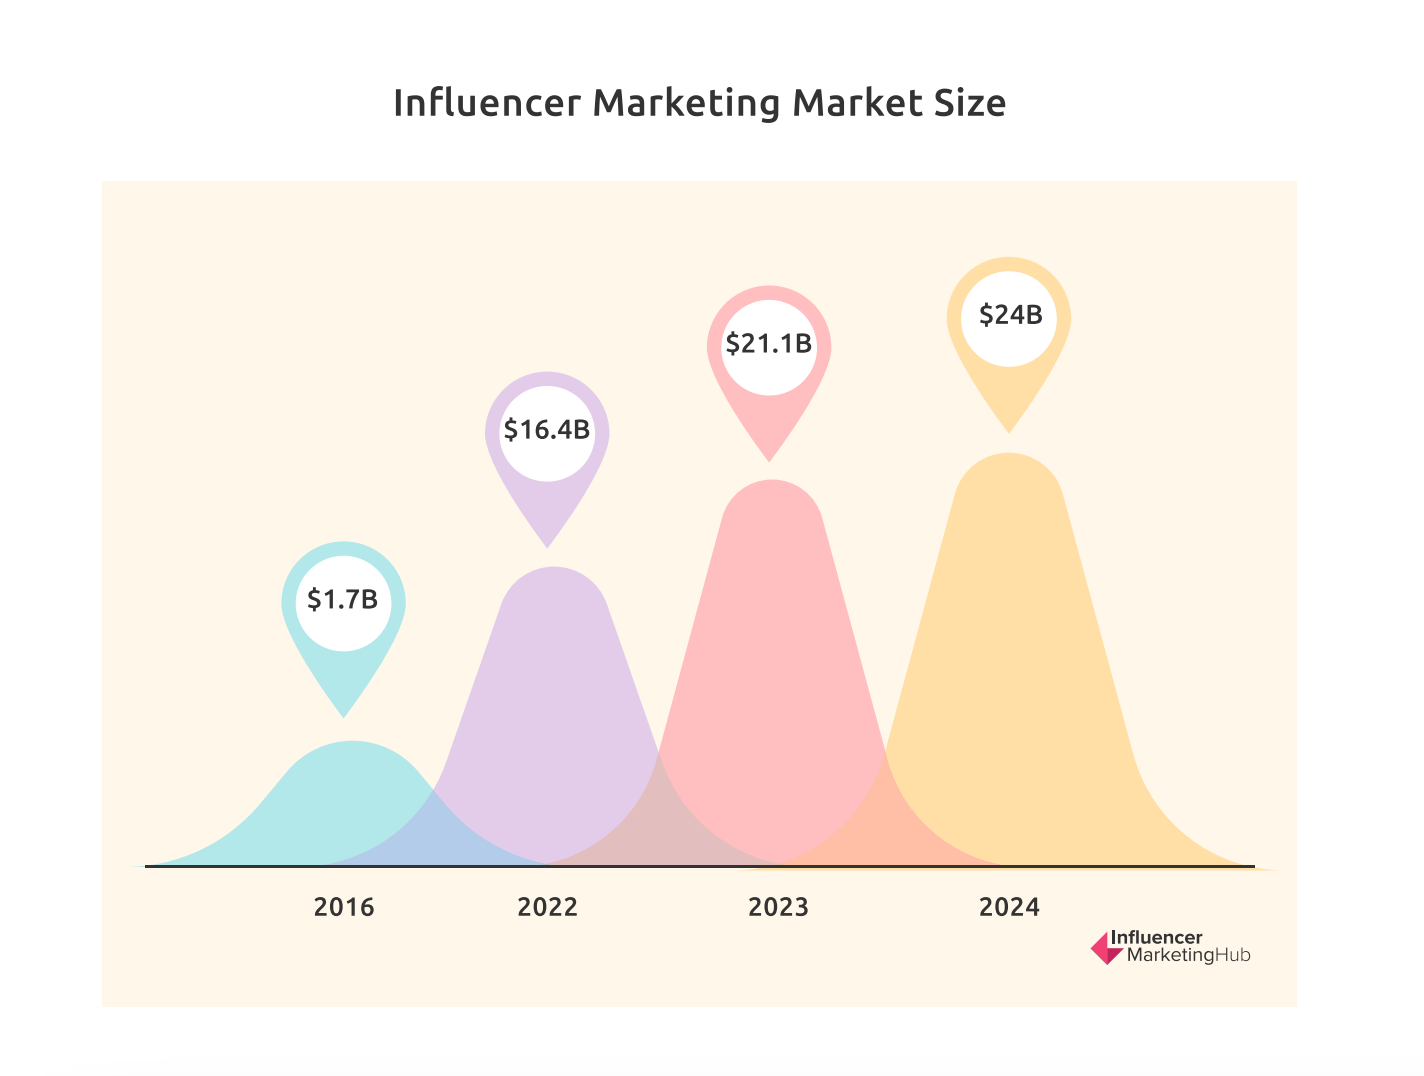
In 2024, the global influencer marketing industry was valued at $24 billion, up 14% from $21.1 billion in 20232. This was more than triple the value of the market in 2019 and over 1,300% higher than in 2016 when the influencer marketing industry was worth $1.7 billion3.
The influencer marketing platform market alone is forecasted to grow at a CAGR of 37% to reach $50.3 billion between 2024 and 20284.
The influencer marketing platform market, which includes software, tools, and systems to streamline campaign processes and influencer discovery, was worth $14.2 billion in 2024, up 34% from $10.6 billion in 2023.
Ad spending in the influencer advertising market is expected to grow at a CAGR of 10.4% and reach $52 billion by 20285.
The influencer advertising market, which promotes products or services by collaborating with influencers on social media, was worth $35.1 billion in 2024 —an increase of 13.9% from 2023.
Additionally, the average ad spending per internet user in the influencer advertising market was $6.30 in 2024.
In the US alone, influencer marketing spend growth is expected to surpass social ad spending (14.3% vs 9.7%) in 20256.
Despite economic uncertainty, influencer marketing spend rose 3.5x faster than social ad spending or 16% year-over-year to over $8.14 billion in 2024.
Between 2016 and 2023, Google searches for ‘Influencer Marketing’ grew by 400%7.
In the US, 35% of creators stated that becoming an influencer was a key goal. This was followed by 34% of creators in Brazil, 30% in the UK, and 24% in Australia.
As of 2023, 9% of social media users, or 450 million people identified as influencers8.
This was even higher for Gen Z social media users (11%). Additionally, 76% of self-proclaimed influencers said they earned enough money from content creation and advertising to support themselves.
Key influencer statistics
Globally, influencers made up 14% of all creators in 20229.
Influencers were more prominent in markets like Brazil, Australia, the UK, and the US.
Additionally:
- There were more male influencers (60%) than female influencers (40%).
- Most influencers were Millennials (mean age of 35).
- Over 58% of influencers had over 3 years of experience.
Compared to 68% of creators, 89% of influencers posted at least weekly. While 41% of influencers posted daily, 21% of creators did the same.
Compared to 9 hours per week, influencers typically spent 15 hours a week on content development. Additionally, instead of an average of 2.8 creative activities, influencers typically engaged in 4.
As of 2024, social media influencers reached at least 83% of consumers aged 18-6010.
89% of influencers planned to use TikTok in 2024, making it the most popular channel. This was followed by Instagram at 86% and YouTube at 29%.
With average engagement rates of 4.39%, nano influencers (less than 10,0000 followers) consistently achieved the highest engagement across all platforms11.
- Micro-influencers (10,000-60,000 followers) had an engagement rate of 2.59%.
- Mid-tier influencers (60,000-200,000 followers) had an engagement rate of 1.71%.
- Macro influencers (more than 200,000 followers ) had an engagement rate of 1.44%.
A majority of influencers (24%) charged between $250 and $500 per post in 2024.
Meanwhile, 23% charged $500 and $1000 per post, and 17% charged between $100 and $250.
- 15% charged between $1000 and $5000.
- 9% charged between $51 and $100.
- 7% charged over $5000.
- 6% charged between $1 and $50.
71% of influencers offered discounts when partnering with brands on multiple posts.
25% said they would consider it in the future.
Influencers’ preferred content to create with brands were short-form videos at 53%.
This was followed by static image posts (48%) short form videos under 15 seconds at 43% and live video at 42%. Influencers were less likely to work on interviews (19%), content (14%), and evergreen activations (5%).
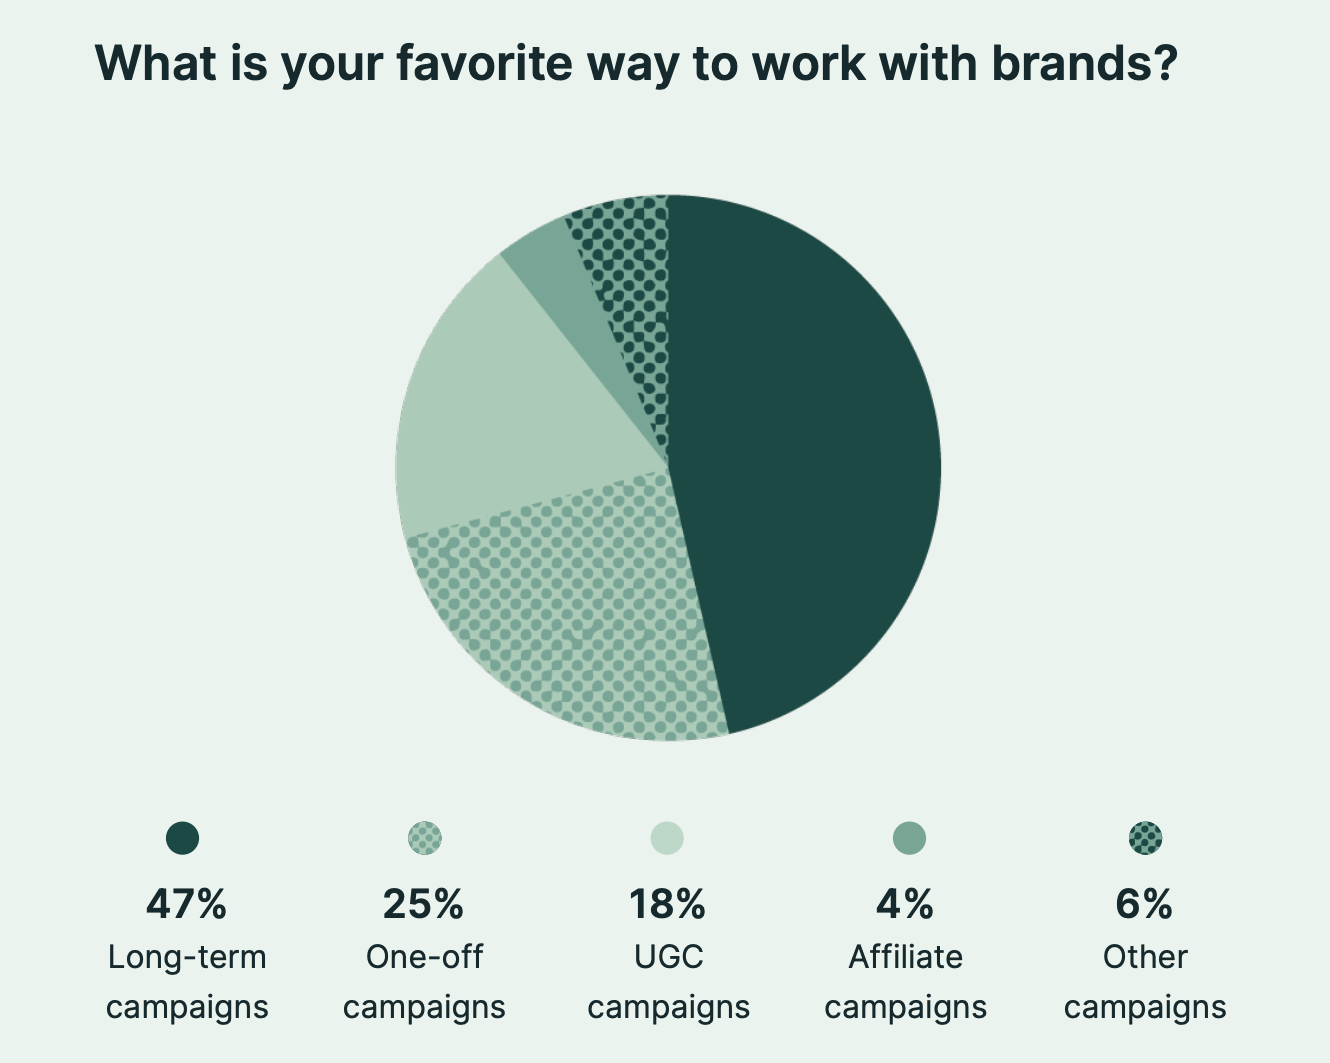
47% of influencers preferred to work on long-term campaigns with brands.
25% preferred to work on once-off campaigns while 18% preferred to work on UGC campaigns. Under 6% wished to work on other or affiliate campaigns.
Influencers measured the success of brand partnerships primarily through social media engagement metrics.
This was followed by:
- Growth in followers and subscribers
- Link traffic from posts
- Increases in web traffic
- Social mentions and hashtags
In 2024, close to 60% of influencers felt they faced discrimination. This was higher for macro-influencers (81%) and mega-influencers (70%).
- 48% felt they faced discrimination based on their gender.
- 22% felt they faced physical feature discrimination.
- 13% felt they faced racial discrimination.
Influencers stated they had encountered the most discrimination on TikTok (58%).
This was followed by YouTube(14%). Instagram (13%) and Facebook (10%).
93% of influencers stated that the quality of a brand's existing social content impacted whether they agreed to partner12.
Moreover, 61% of influencers said their most important criteria when selecting a brand partner was whether the brand's values aligned with theirs.
This was followed by:
- Budget and payment structure at 59%
- Brand and product alignment at 41%
- Degree of creative control at 21%
- Ease of work and responsiveness at 8%
The most popular tools and services influencers leveraged in 2023 included:
- CapCut - 19%
- Adobe - 18%
- Canva - 18%
- Instagram-16%
When asked how they would improve brand partnerships, 35% of influencers wished brands would let them get involved in the creative process and content brainstorming earlier.
A further 30% wished that brands would involve them in product and service development conversations before promotions began.
Meanwhile:
- 16% would get brands to embrace more lo-fi content instead of polished or highly produced work.
- 10% would encourage brands to collaborate with more diverse influencers.
- 8% would encourage brands to forge long-term partnerships versus pursuing one-off projects.
Influencer marketing revenue statistics
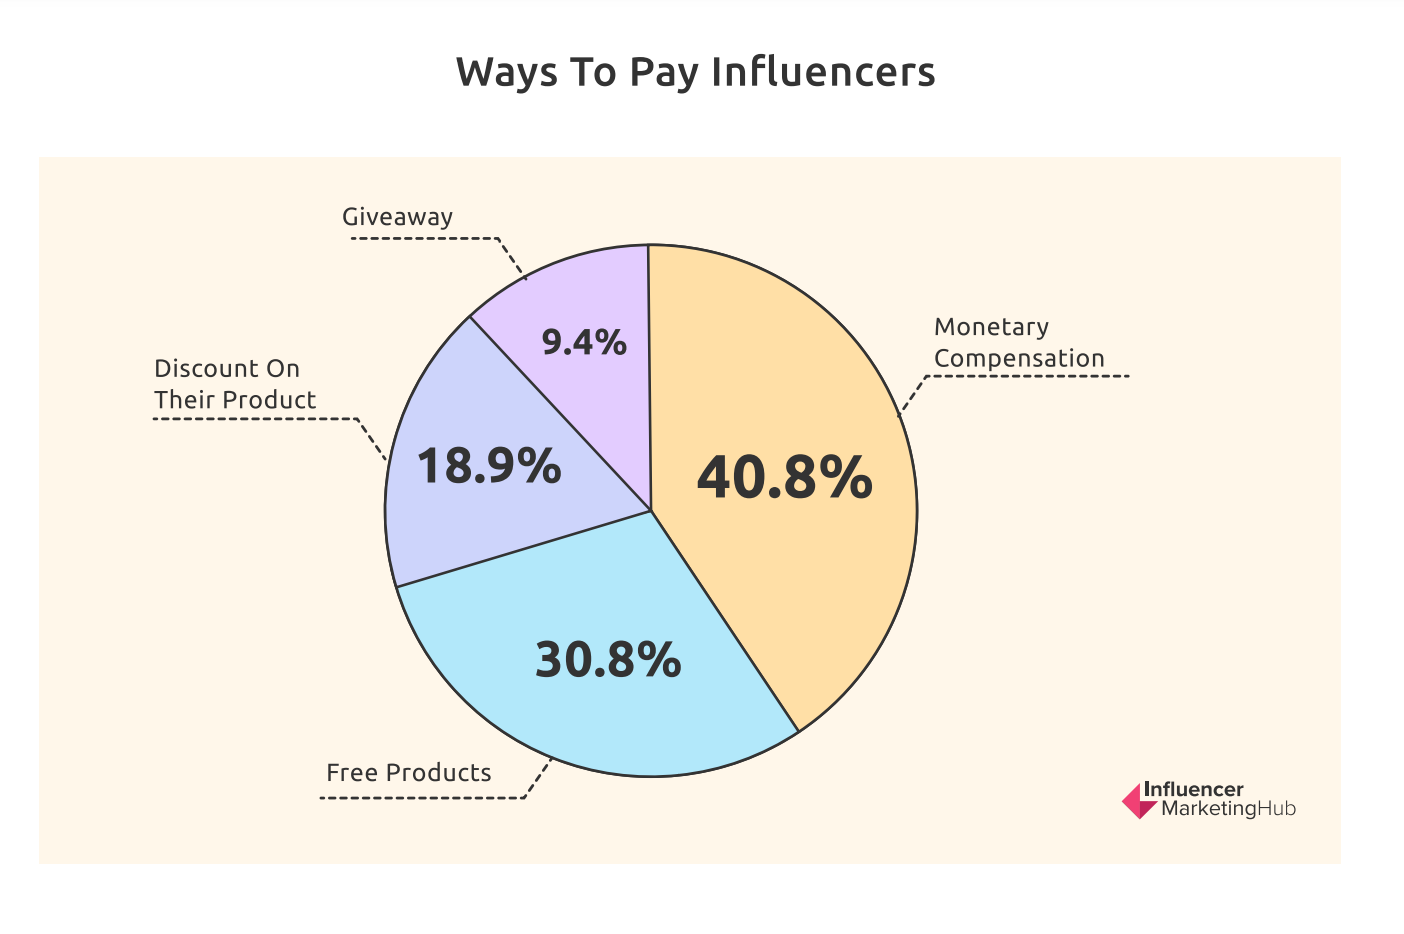
In 2024, 41% of brands and marketers paid influencers in cash, making monetary rewards the most popular type of influencer compensation.
This was followed by product samples at 31%, product discounts at 19%, and giveaway entries at 9%.
The most popular influencer payment system was a flat rate. At 50%, this figure has remained consistent since 2022.
The second most popular system was paying a percentage of the sales value at 24%. However, this dropped significantly from 42% in 2022. This was followed by product-level payments at 19%.
In 2024, the most popular way influencers received payment was through wire transfers at 29%.
This was followed by PayPal at 27%, manual payments at 25%, and 3rd party payment services at 19%.
A 2023 study found that 48% of influencers earned $15,000 or less13.
The second and third most popular annual income brackets at 10.6% and 9.3% were $50,000-$75,000 and $15,000 and $25,000, respectively.
On the other hand, an earlier study found that influencers made $81 per hour compared to $61 per hour for other creators.
Influencers also earned the most per hour in the UK ($147), Germany ($127) and France ($84). Additionally, income earned from their efforts made up over 70% of influencers’ monthly income.
On average, influencers working with top Fortune 100 brands were compensated for around 39% of their content and made $2,100 per month from content creation in 202414.
A majority of these influencers (33%) made $500-$2,500 for a single post. 32% made under $500 and 19% made $2,500 to $10,000.
Influencers in categories such as Food & Drink, Tech, and Business made over $100,000 in annual revenue in 2023.
Meanwhile, influencers in categories such as Lifestyle, Beauty, Education, Photography, and Music made less than $50,000 per year.
The industries with the highest pay per post were Travel ($16,000), Business or Personal Finance ($15,000) and Lifestyle ($15,000).
Meanwhile, the industries with the lowest pay per post included:
- Art, Media, and Entertainment at $10,500
- Retail at $10,100
- Home and Garden at $8,600
57% of influencers kept their rates the same in 2024.
Plus, 93% were willing to work with brands for free products, especially if they loved the brand or the product value was high.
Influencer marketing consumer statistics
86% of consumers made a purchase inspired by an influencer at least once a year15.
49% of consumers made purchases at least once a month because of influencer posts. While influencer marketing had a major impact on consumer buying decisions, only 16% of consumers ranked influencer marketing as having the most impact on their buying decisions.
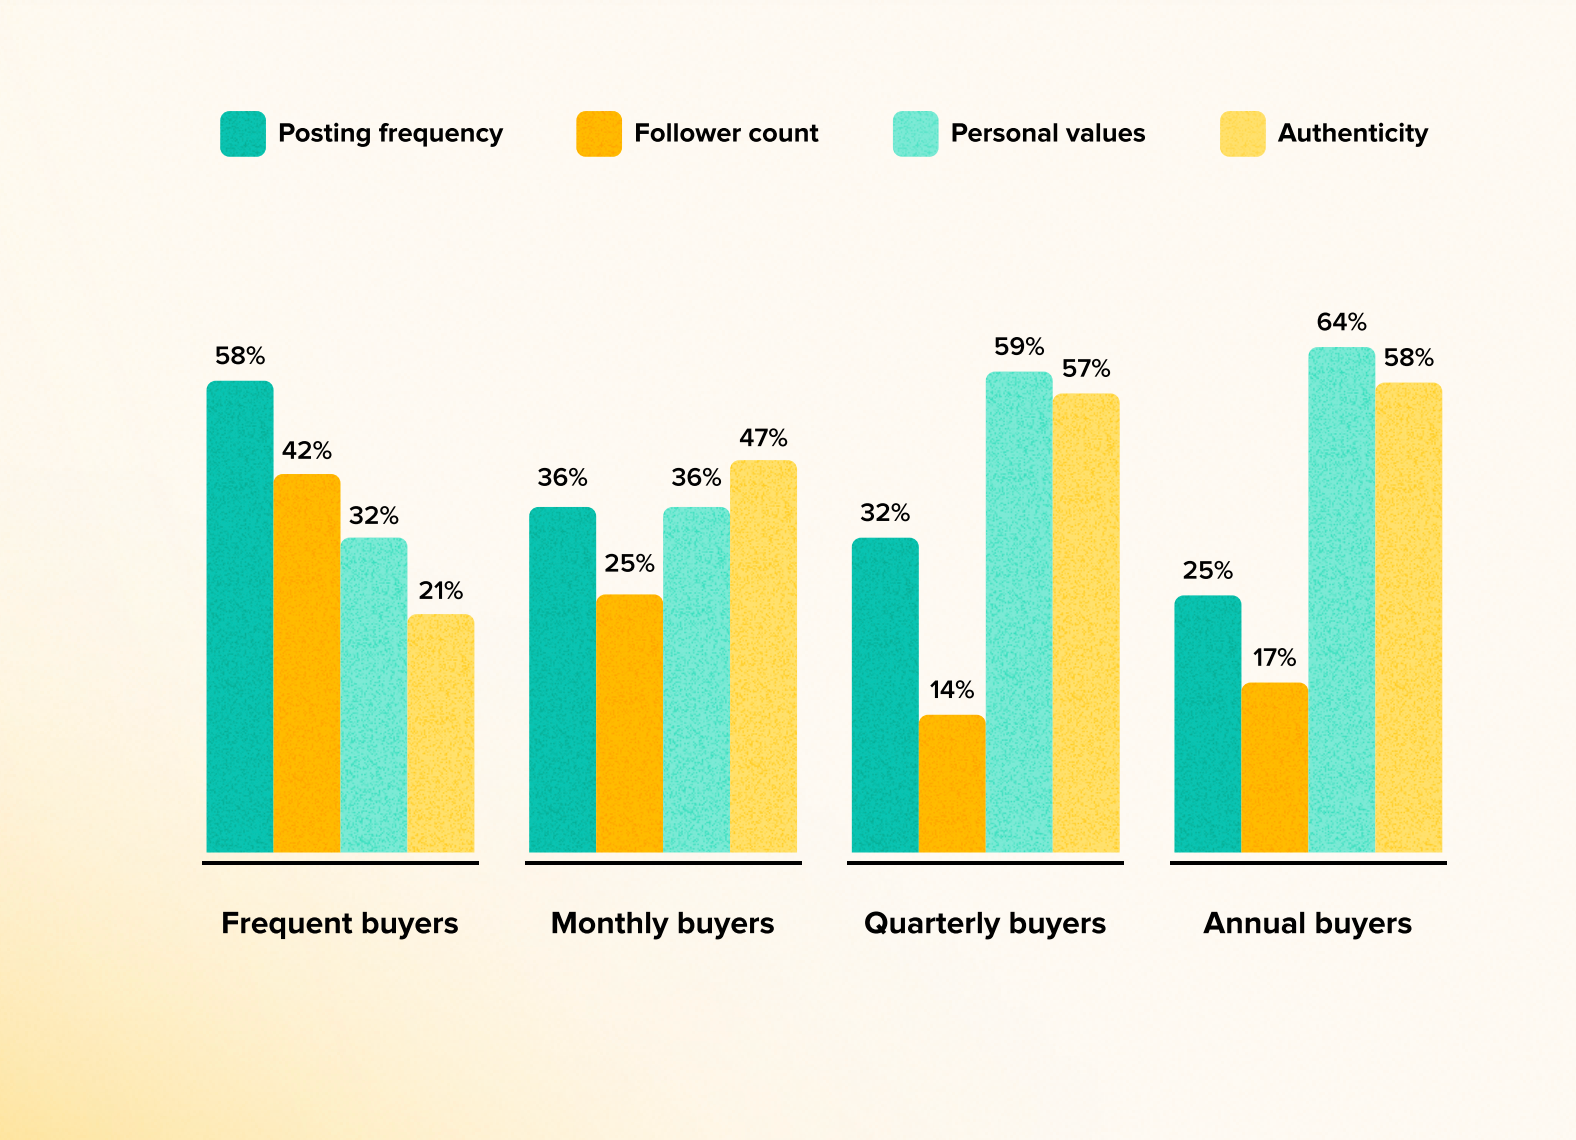
Based on their buying behavior, consumers valued different influencer traits. Frequent buyers valued posting frequency at 58%, while they valued authenticity the least at 21%.
Additionally:
- Monthly buyers valued authenticity most at 47%, while they valued follower count the least at 25%
- Quarterly buyers valued personal values most at 59% and valued follower count least at 25%
- Annual buyers valued personal values most at 64% while they valued follow count the least at 17%
The top influencer content quality that motivated consumers to buy was ‘genuine reviews’ at 64%.
This was followed by discount codes at 55% and seeing multiple influencers post about the same product at 26%.
Over 50% of all consumers trusted influencers in 2024 as much as they did in 2023.
Another 30% trusted them more. In fact, Millennial and Gen Z respondents trusted influencers at a higher rate than Gen X and Baby Boomers. Moreover, frequent buyers trusted influencers at nearly 2x the rate of monthly and 3x the rate of quarterly buyers.
62% of frequent buyers were likely to share feedback with influencers.
This was compared to 41% of Gen Z consumers and 29% of all consumers.
53% of consumers looked for influencers who aligned with their personal values in 202416.
47% looked for authenticity, while 37% valued influencers posting the right amount of content. A further 36% valued influencers aligning with their personal demographics, while 26% valued follower count.
While authenticity was important for Millennials, Gen X, and Baby Boomers, only 35% of Gen Z respondents felt the same way.
Instead, Gen Z placed more value on quantifiable credibility, with 47% valuing follower count.
Consumers’ favorite influencer marketing topics included Food and Drink (30%) and Beauty (26%).
Other favorite topics included Fashion (21%), Music (19%) and DIY crafting (18%). These preferences varied according to age, with younger consumers leaning toward fitness, gaming, lifestyle, movie, and sports content.
According to consumers, the best influencer collaborations were honest and unbiased (67%) and entertaining (48%).
Consumers also wanted to be educated (29%) while 19% wanted to be surprised. Only 18% wanted aspirational content.
80% of consumers were willing to buy from brands that partnered with influencers beyond just social media content17.
This included in-person events, brand trips, and multichannel ad campaigns.
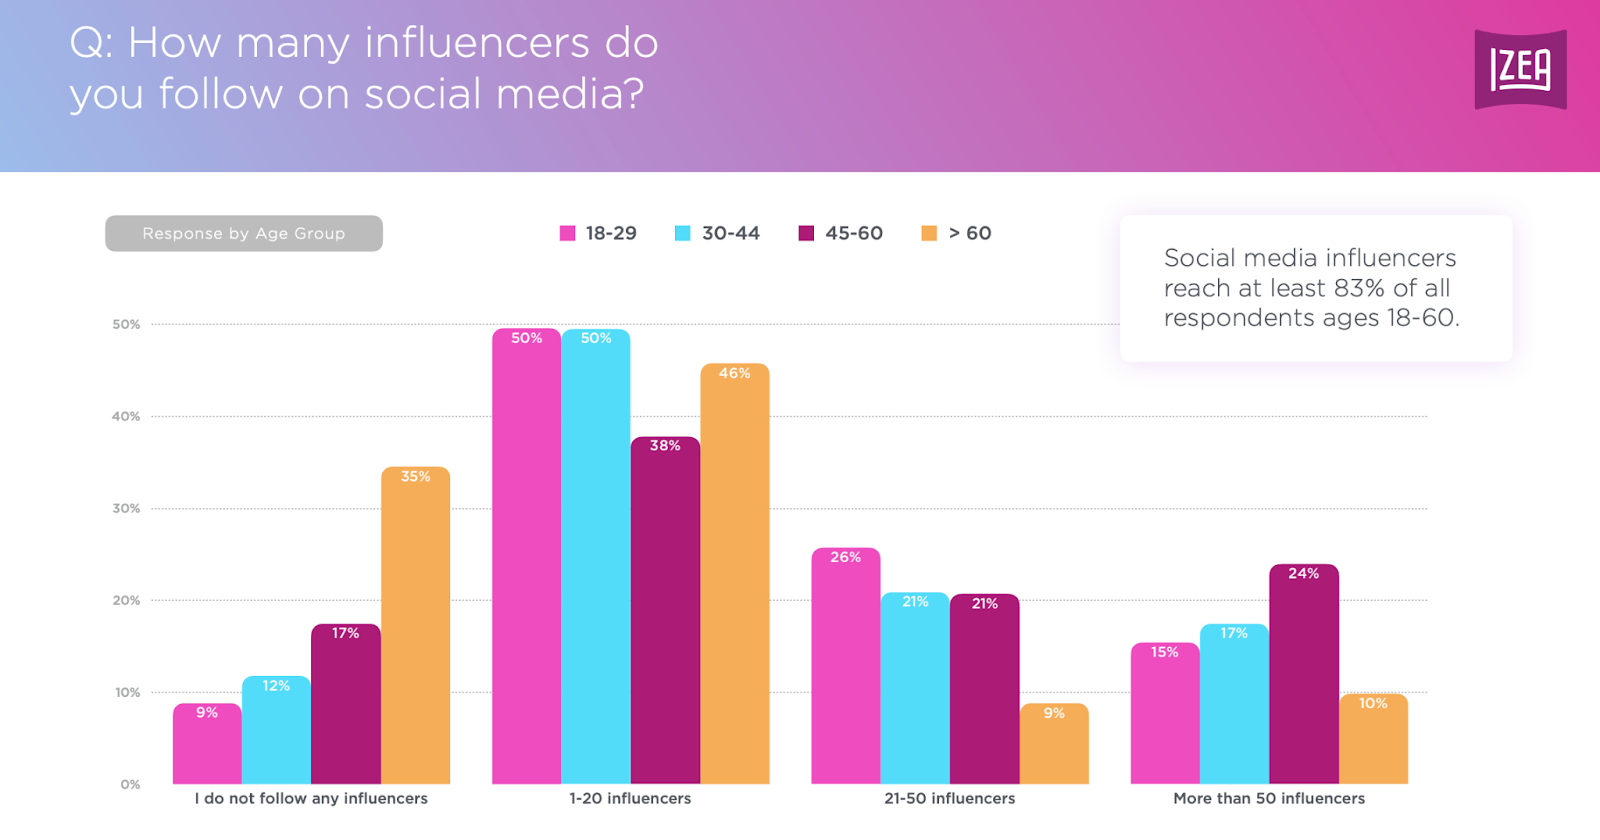
In 2024, 50% of consumers between the ages of 18-44 followed 1-20 influencers.
This was followed by 46% of consumers over 60 and 38% of consumers aged 45-60.
Of consumers who followed 21-50 influencers, the majority (26%) were between the ages of 18-29.
Additionally, 21% were between the ages of 30-60 while 9% were over 60.
Of those who followed more than 50 influencers, the majority (24%) were between the ages of 45-60.
This was followed by 30-44-year-olds at 17%, those aged 18-29 at 15%, and those 60 and older at 10%.
35% of consumers aged 60 and older did not follow any influencers.
This was followed by 17% of consumers aged between 45-60, 12% of consumers aged 30-44, and 9% of consumers aged 18-29.
77% of consumers considered influencer content more compelling than scripted advertising18.
This was up from 50% in 2023, 48% in 2022 and 48% in 2021. Additionally, male consumers (53%) and consumers aged 45-60 were more likely to find influencer content more compelling.
86% of consumers said they were very likely to search on social platforms before making a purchase.
In fact, since 2022, product research on TikTok and Instagram has increased by 2.3x and 2.4x, respectively. Meanwhile, friend and family recommendations have declined.
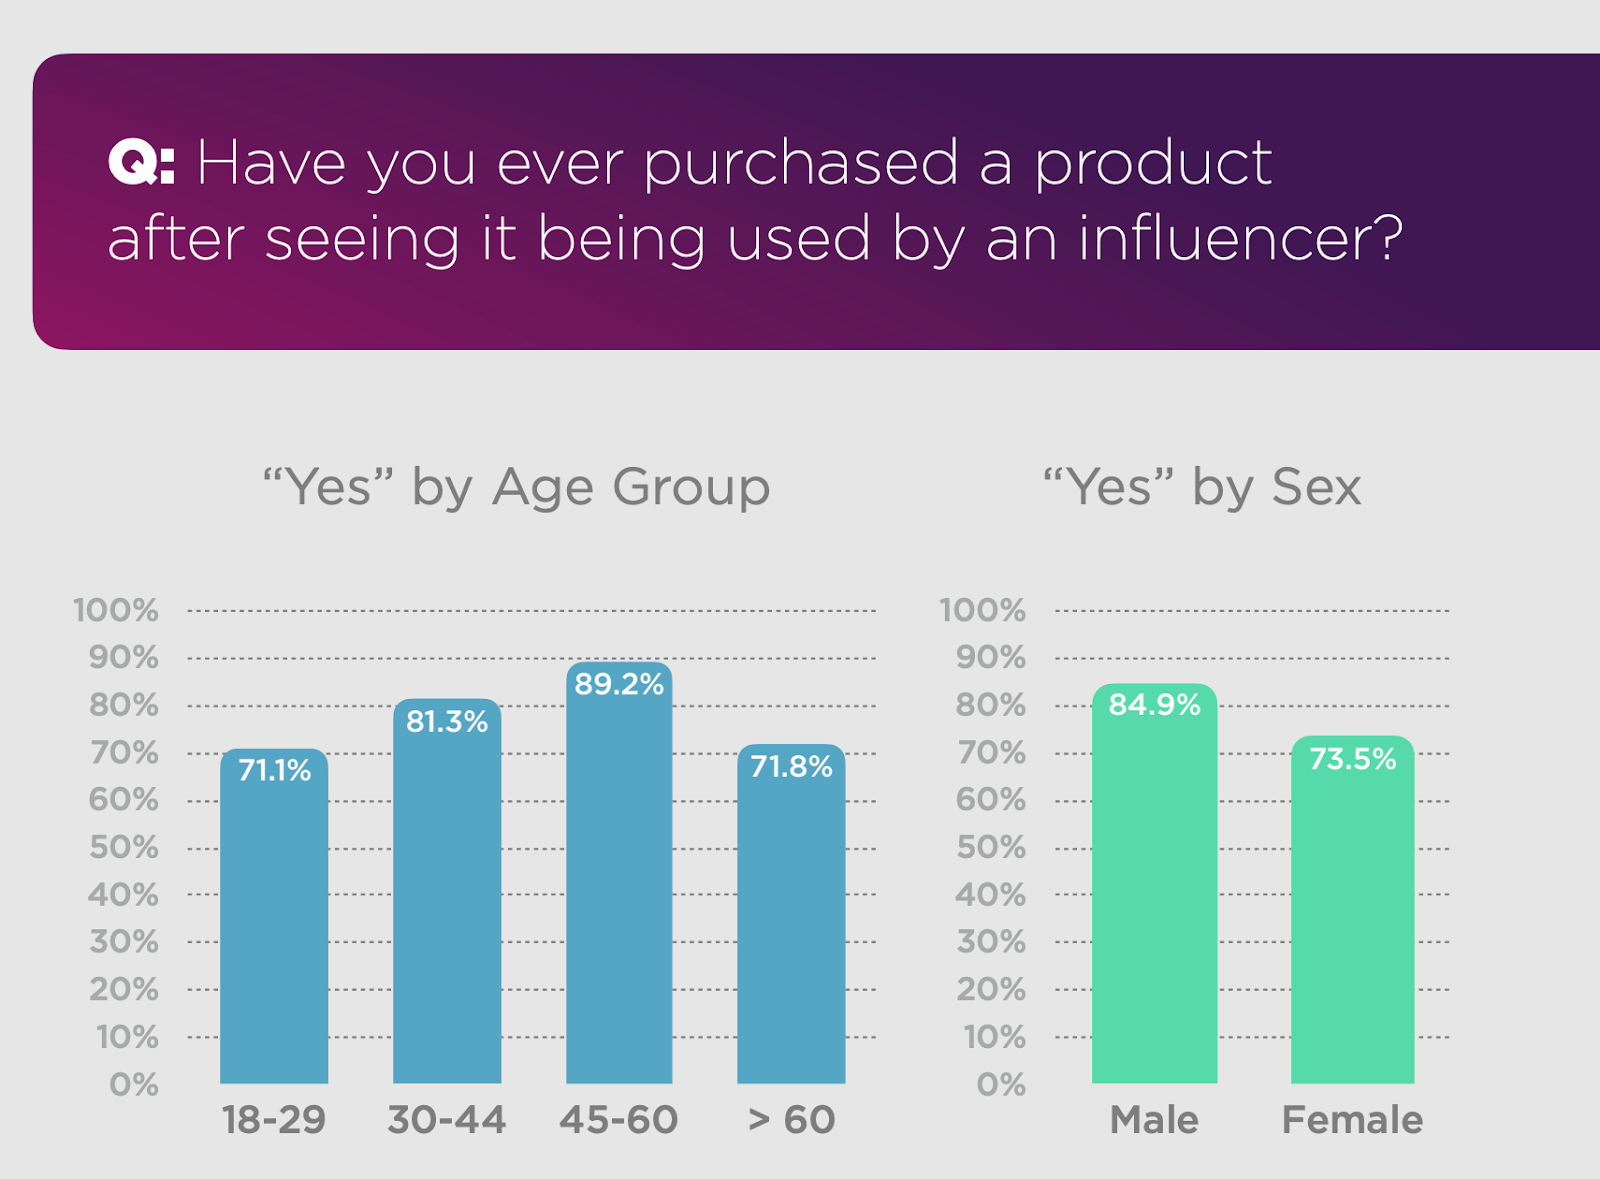
79% of consumers purchased a product after seeing an influencer using it, up from 51% in 2023.
This was the case for 74% of female consumers and 85% of male consumers. By age group, this was the case mainly for consumers aged 45-60 (90%) and consumers aged 30-44 (81%).
85% of consumers said they were more likely to trust a sponsored post from an influencer over an A-List celebrity, up from 61% in 2024.
This was particularly the case for male consumers (89%) and those aged 45-60 (90%).
Key factors that increased consumer trust in influencer product recommendations included:
- Authenticity - 68%
- Recommendation history - 54%
- Product demonstration - 52%
- Transparency - 44%
Consumers were more likely to try a new product because of an influencer post versus any other type of ad.
This was the case for 38% of female consumers versus 24% of male consumers. By age group, influencer posts were the top choice for consumers under 45.
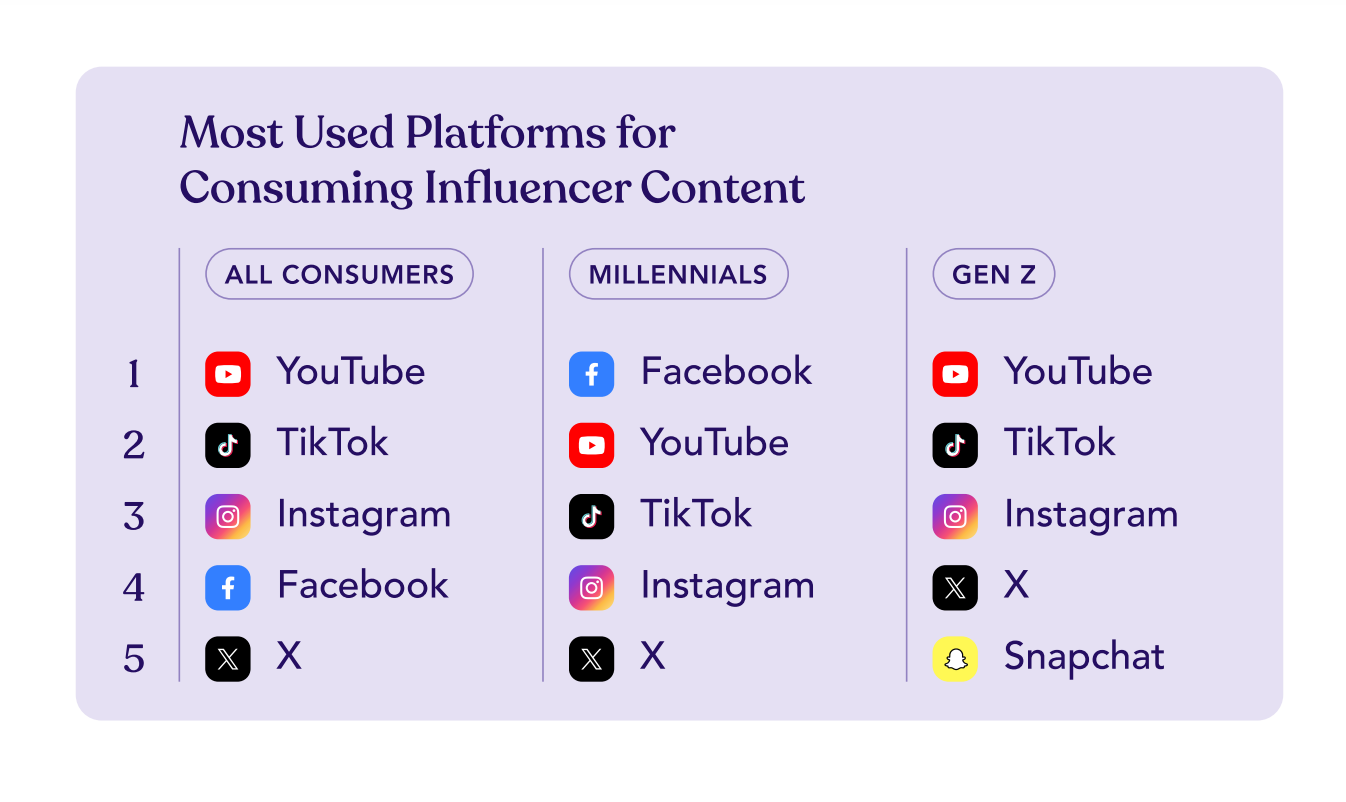
As of 2024, 24% of consumers considered YouTube the best platform to promote a product through an influencer.
This was followed by Facebook at 22%, Instagram at 20%, TikTok at 22% and Twitter (X) at 5%.
Women were more likely to select TikTok (26%) and Instagram (23%) as the top influencer marketing platforms, while men were more likely to select YouTube (29%).
Consumers under 45 were more likely to select TikTok and Instagram as the top influencer marketing platforms, while those over 45 were more likely to select Facebook and YouTube.
75% of all consumers considered short-form videos (less than 3 minutes) the most engaging content type19.
This was followed by photos, long videos (5+ minutes), and live streams.
Millennials were 13% more likely to rank funny content as the most engaging content type than Gen Z.
Additionally, female consumers were more likely to rank funny content as the most engaging type of content.
Highlighting the power of influencers of consumer behavior:
- 61% of consumers were likely to be persuaded to purchase a product from a brand if an influencer they knew and trusted made a post.
- 53% of consumers were likely to purchase a product because it was recommended by a social media influencer they followed.
- 56% of consumers were likely to purchase a product from a brand owned by an influencer they followed.
57% of consumers said they would try out a new social platform if an influencer they knew and trusted posted there.
41% of consumers would pay for a favorite or trusted social media influencer's exclusive content.
Influencer Marketing Engagement Statistics
Consumers were most likely to use Instagram, Facebook, TikTok, and YouTube to engage with their favorite influencers.
50% of Baby Boomers were more likely to engage on Facebook. On the other hand, Gen X and Millennials are 2x as likely as Boomers to engage on Instagram. 27% of Gen Z were likely to engage with influencers on TikTok, compared to 15% overall.
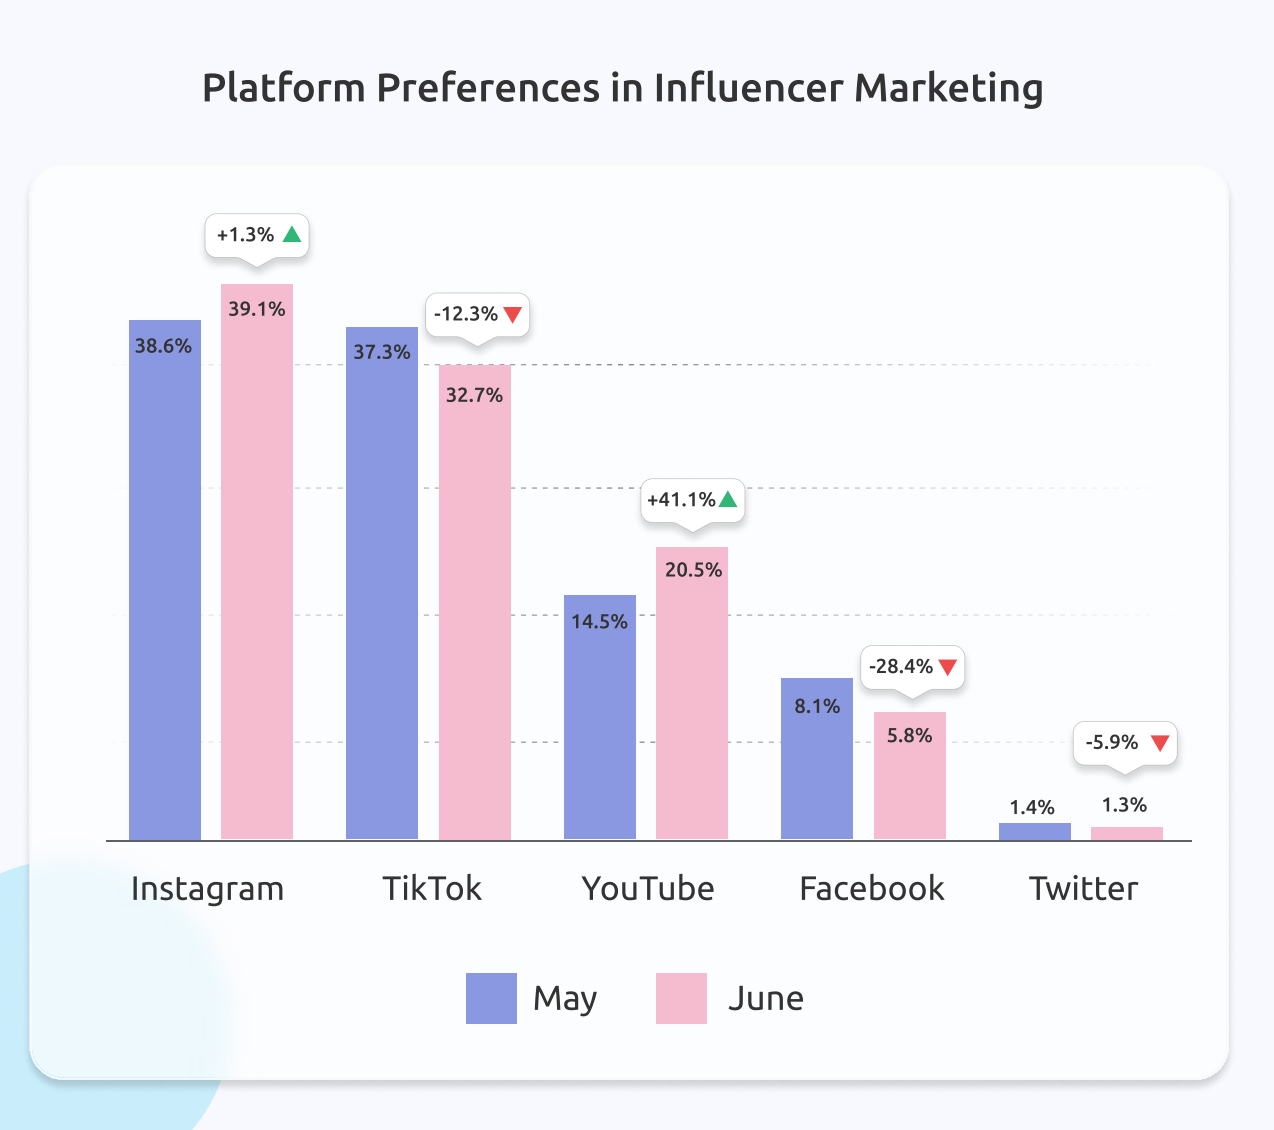
As of June 2024, Instagram was the leading influencer marketing platform, with 39.1% of marketers selecting it as their top preference.
In second place, 32.7% of marketers selected TikTok as their preferred influencer marketing platform. Next, 20.5% of marketers selected YouTube while 5.8% of marketers selected Facebook as their preferred influencer marketing platform.
Highlighting a shift in marketer preferences, YouTube usage surged 41% in 202420.
Influencers on YouTube achieved a whopping 49.5% engagement rate.
TikTok popularity among brands fell by 12% amid regulatory concerns in 2024.
However, the number of influencer campaigns on the platform grew by 26% year-over-year.
In 2024, the number of campaigns on Instagram Reels increased by 7.7% year-over-year.
Additionally, Instagram Reels had an engagement rate of 3.75%, placing them ahead of Feed Posts with a 2.38% engagement rate.
In 2024, average engagement rates on Instagram stood at 2.05% for accounts with over 100,000 followers, down from 2.18% in 2021.
Instagram influencer engagement rates fell in relation to a larger number of followers. In particular, engagement for accounts with over 1 million followers fell from 1.97% in 2018 to 0.95% in 2024.
On the other hand, engagement for accounts with fewer than 5,000 followers was over four times higher at 4.21%.
Similarly, smaller TikTok accounts with 1000-5000 followers had higher engagement rates (15.04%) than larger accounts.
Meanwhile, accounts with over 1 million followers had average engagement rates of 10.53%.
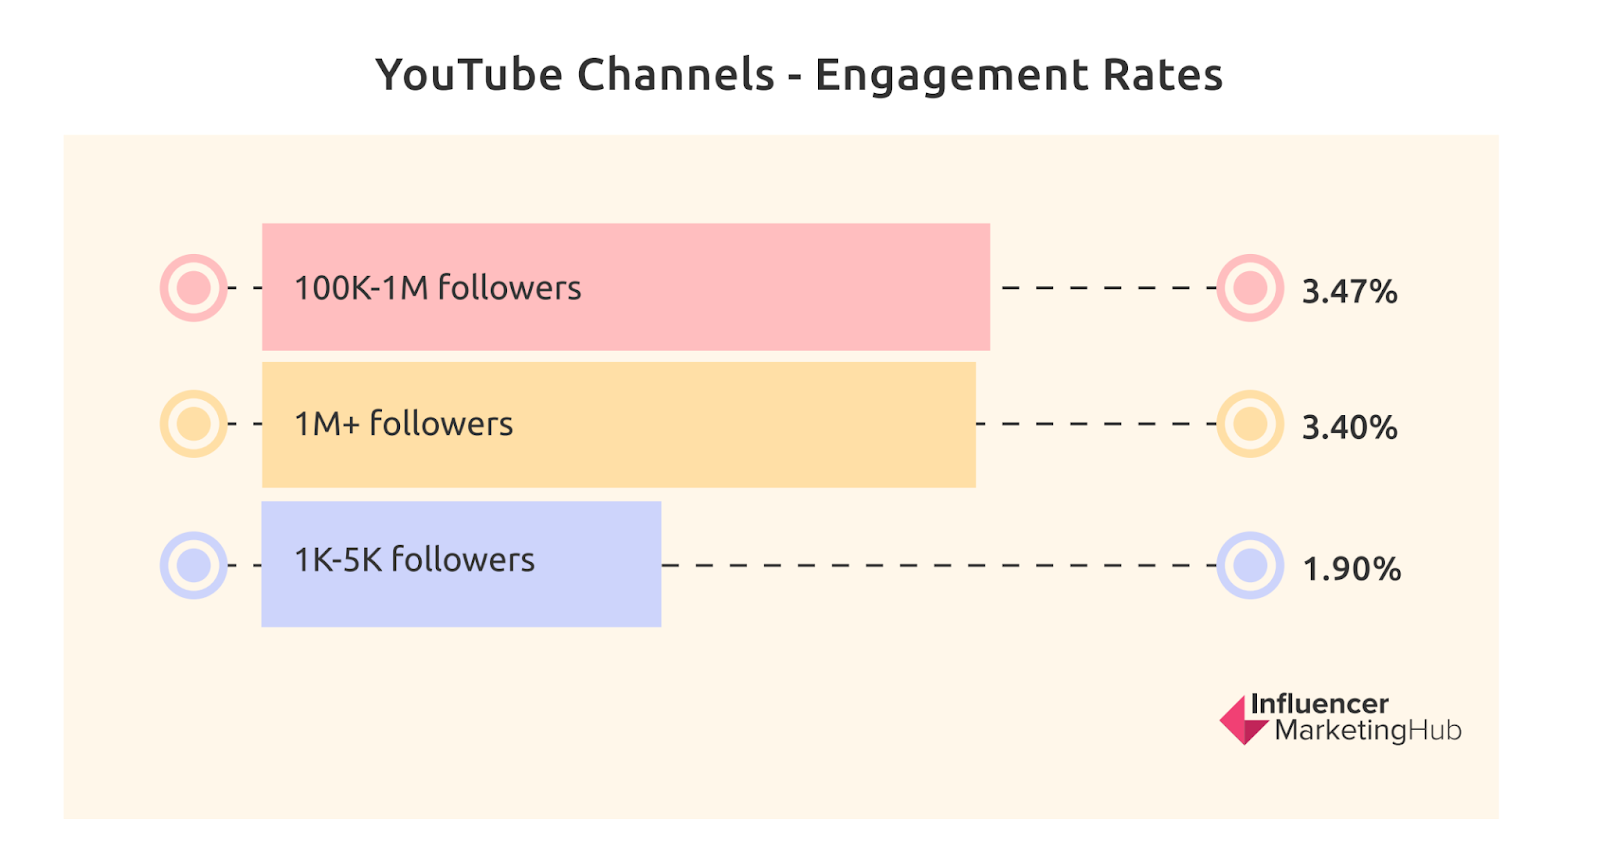
Contrastingly, YouTube didn’t follow the same engagement pattern as Instagram and TikTok. On YouTube, larger channels had higher engagement rates than smaller channels.
Influencer channels with:
- 100,000-1 million followers had an engagement rate of 3.47%
- 1 million + followers had an engagement rate of 3.4%
- 1,000 - 5,000 followers had an engagement rate of 1.9%
Globally, 7% of influencer content on Instagram was sponsored in 202421.
Compared to 2023, this figure did not change.
Generally, micro-influencers with up to 10,000 followers posted up to 70% more sponsored content than larger influencers.
In 2024, Instagram influencers with:
- Up to 10,000 followers posted 8% sponsored content.
- Up to 50,000 followers posted 7% sponsored content.
- Up to 100,000 followers posted 6% sponsored content.
- Up to 1,000 followers posted 5% sponsored content.
- Over 1 million followers posted 4% sponsored content.
B2B influencer marketing statistics
In 2024, 71% of B2B influencers planned to speak at in-person events, while 67% planned to co-create content with brands22.
This was closely followed by creating guest content on brand (65%) and their own (56%) platforms.
According to influencers, the most successful type of collaboration with brands was co-created content (75%).
This was followed by speaking at in-person events (75%) and speaking at online events (69%).
2024 trends in B2B influencer compensation revealed significant variability in the average costs of collaborating with influencers:
- Speaking at events: $12,000 - $17,000
- Blog/Articles: $3,000
- Live Streams: $5,000 - $8,000
- Social video creation: $4,000 - $5,000
- Workshops: $11,500-$18,500
- Podcasts: $2,000 - $5,000
- Newsletters: $4,500
93% of B2B brands relied on awareness metrics to measure the success of their influencer marketing efforts.
A further 88% tracked engagement metrics and only 44% tracked conversion metrics.
B2B influencers and brands prioritized LinkedIn as their top channel.
This was followed by brand websites, Instagram and YouTube.
In 2024, 76% of B2B brands prioritized social content, closely followed by video at 70%.
Other key B2B influencer marketing tactics included posts (59%), events (54%) and webinars (46%).
Influencer marketing strategy statistics
The top influencer marketing goal for brands was developing a successful influencer marketing strategy, with 40% of marketers selecting this as a priority for 2024 and 202523.
This was followed by measuring and reporting on the performance of influencer strategies (17%) and improving influencer marketing programs (14%).
Close to 40% of brands worked with between 0-10 influencers in 2024.
Meanwhile:
- 19% worked with 10-50 influencers.
- 15% worked with 50-100 influencers.
- 14% worked with 100-1000 influencers.
- 15% worked with over 1000 influencers.
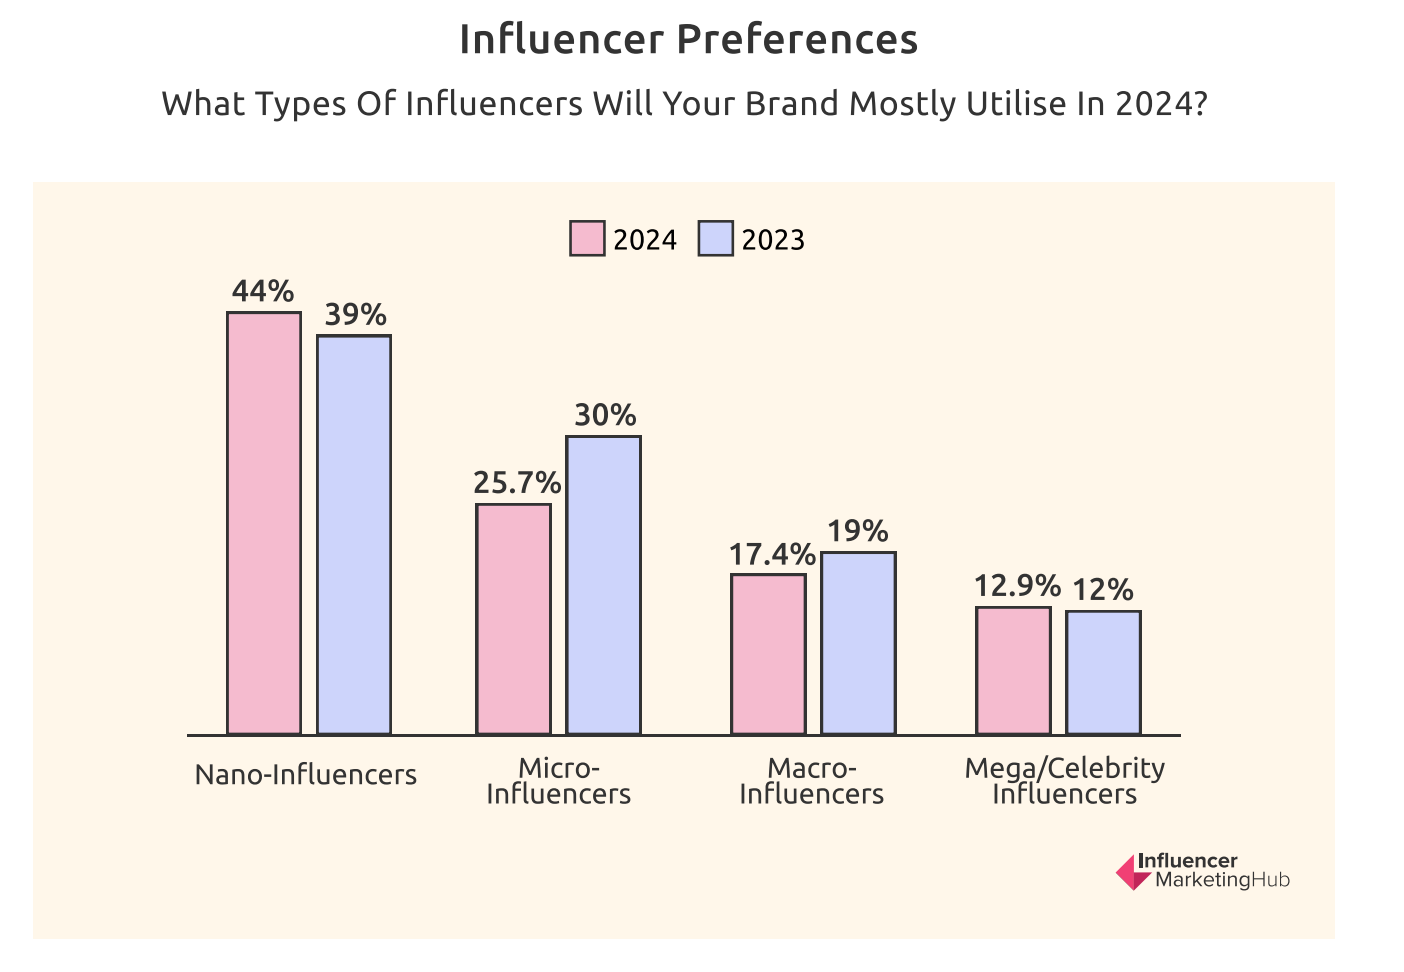
In 2024, a majority of brands (44%) planned to work with nano-influencers (1,000-10,000 followers), up from 39% in 2023.
By June 2024, the number of brands and marketers choosing to work with nano influencers had increased to 55%.
Additionally
- 20% of marketers chose to work with micro-influencers (10,000-100,000 followers).
- 15% of marketers chose to work with macro influencers (100,000-1 million followers).
9% of marketers chose to work with mega or celebrity influencers (1 million + followers).
The most important factor brands and businesses considered when partnering with influencers was content production at 37%, up from 36% in 2023.
Additionally, 23% of marketers believed audience relationships were a key factor when working with influencers. However, this was down from 29% in 2023 and 51% in 2022.
Another study found that engagement (50%) and audience demographics (41%) were the top factors brands looked at when selecting an influencer.
Other factors included follower count (37%) and campaign fit (35%).
62% of marketers preferred to keep their influencer marketing relationships campaign-based, up from 60% in 2023.
Yet 37% kept these relationships going consistently, though slightly down from 40% in 2023.
49% of marketers preferred to run influencer campaigns monthly over quarterly or longer periods, up from 34% in 2022.
- 15% preferred to run campaigns quarterly, down from 35% in 2022.
- 14% preferred to run campaigns annually.
- 22% preferred to run campaigns whenever they launched a new product.
57% of marketers believed influencer marketing was a scalable tactic in their marketing ecosystem.
27% thought it was somewhat scalable, while 16% disagreed with this sentiment.
The most challenging aspect of influencer marketing for brands in 2024 was building brand awareness and loyalty (21%).
Evaluating performance came next at 17%, followed by driving ROI at 14%. This was slightly different from 2023 when key influencer marketing challenges included:
- ROI - 28%
- Automating or streamlining influencer marketing processes - 19%
- Discovering new influencers and maintaining existing relationships - 13%
As of 2024, significantly more brands (53%) considered brand safety a concern when selecting influencers to partner with.
However, for 14% of brands, this became less significant.
Influencer marketing spending statistics
86% of marketers planned to create a budget for influencer marketing in 2024.
This is slightly up from 82% in 2023 and up considerably from just 37% in 2017.
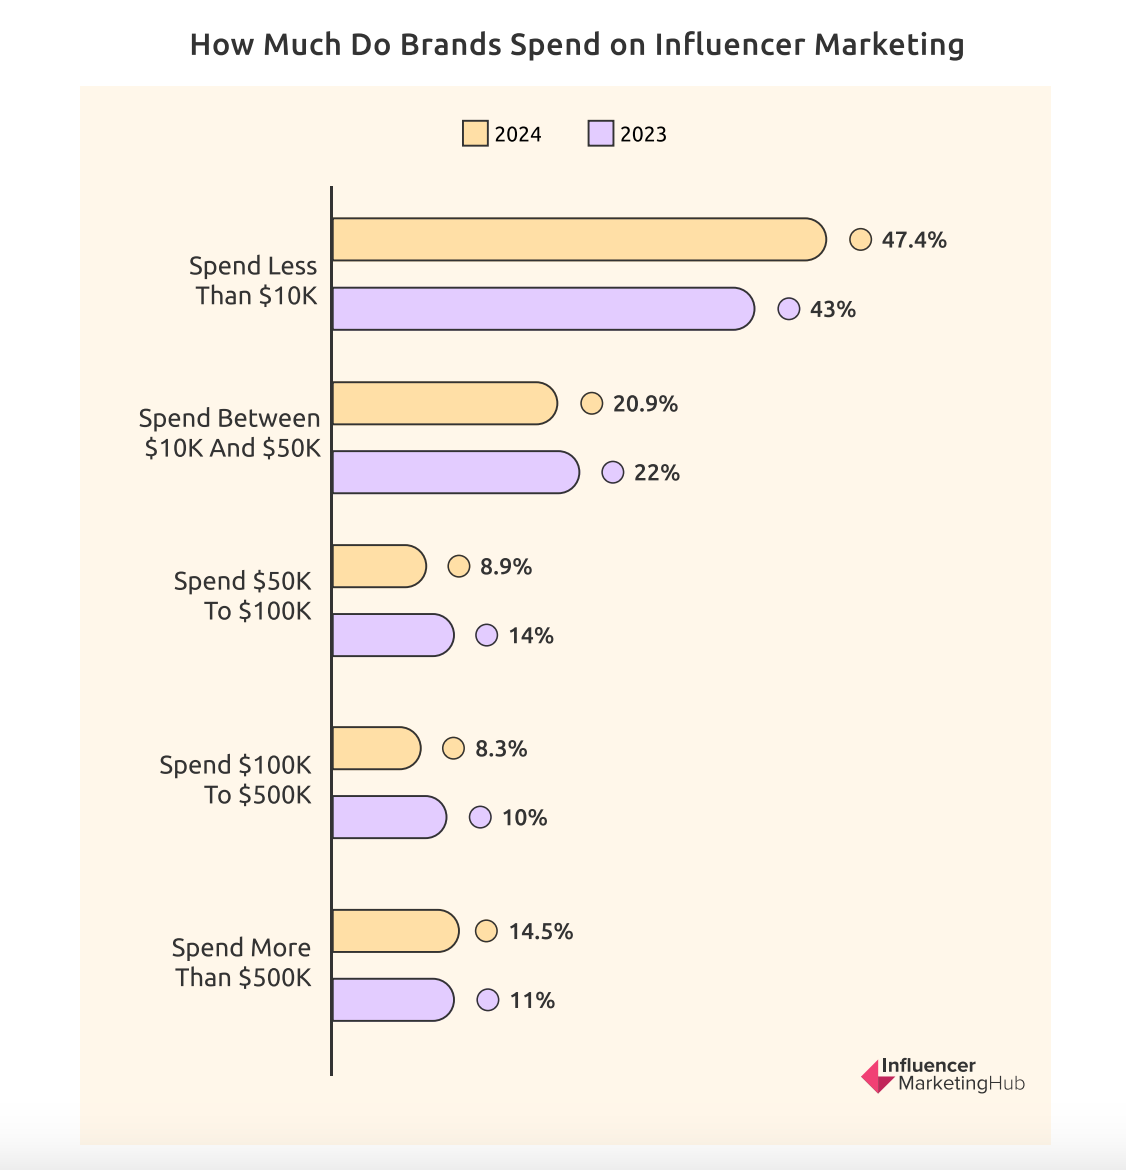
While brands of all sizes paid for influencer marketing, there was a lot of variation in what they spent. For example, 47% of brands spent less than $10,000 on influencer marketing in 2024, up from 43% in 2023.
- 21% spent between $10,000 and $50,000, slightly down from 22% in 2023.
- 9% spent between $50,000 and $100,000 slightly down from 14% in 2023.
- 8% spent between $100,000 and $500,000, down from 10% in 2023.
- 15% spent more than $500,000 up from 11% in 2023.
60% of marketers with a budget for influencer marketing planned to increase their spending in 2024.
Meanwhile, 22% stated that they expected to keep their budgets the same. A further 9.3% were unsure whether their influencer marketing budgets would change. Finally, 9.3% intended to decrease their influencer marketing budgets.
24% of marketers planned to spend more than 40% of their marketing budget on influencer campaigns in 2024.
Over the years, the share of marketers dedicating over 40% of their marketing budgets to influencer marketing has increased as shown below:
- 9% in 2020
- 11% in 2021
- 5% in 2022
- 23% in 2023
22% expected to spend 10-20% of their marketing budgets on influencer marketing and 11.5% of marketers planned to spend between 30-40% of their marketing budgets.
However, a majority of marketers (26%) still planned to spend less than 10% of their marketing budgets on influencer marketing, up from 20% in 2023.
46% of marketers planned to increase their influencer marketing budgets in 2024.
Additionally, influencer marketing accounted for a notable 30% of the total budget, underscoring growing confidence in the strategy.
Facebook had the highest average cost per engagement at $15.30 in 2024.
This was followed by Pinterest with an average cost-per-engagement of $3.60.
On the other hand, YouTube had the lowest cost-per-engagement at $0.05.
This was followed by TikTok at $0.27 and Instagram at $0.51.
When asked how much they would pay for a single Instagram post in 2024/2025, brands stated:
- $3,900 for a follower count of under 100,000.
- $8,800 for a follower count of 100,000-300,000.
- $18,400 for a follower count of 300,000 -1 million.
- $40,000 for a follower count of over 1 million.
Influencer marketing campaign statistics
In 2024, 81% of brands were involved in influencer marketing campaigns24.
In fact, 20% of brands participated in more than 20 influencer campaigns.
The main objective for running influencer campaigns was creating user-generated content (UGC) at 56%.
This was followed by sales at 23.2% and awareness at 21%.
63% of brands preferred to work with the same influencers across different campaigns.
That’s up from 61% in 2023 and 57% in 2022.
As of June 2024, 88% of marketers integrated influencer marketing with other marketing efforts.
Key campaign objectives for influencer marketing included:
- Direct sales - 48.8%
- Brand awareness - 29.9%
- Both sales and brand awareness - 21.3%
76% of influencer campaigns were run in-house, while 24% were headed by agencies.
With the presence of tools to facilitate influencer marketing, more businesses are choosing to handle their efforts in-house. In fact, over 60% now rely on 3rd party tools and platforms to:
- Discover influencers (50%)
- Automate campaigns and reporting (36%)
- Pay Influencers (35%)
Influencer marketing effectiveness statistics
85% of marketers believed that influencer marketing was effective, up from 83% in 2023.
Reflecting the power of influencer marketing, this statistic exceeded 80% between 2017 and 2024.
In 2024, influencer marketing converted shoppers 10x more than social media overall25.
Plus, 33% more social media users bought products recommended by influencers in 202326.
Most marketers (84%) believed that influencer marketing attracted high-quality customers.
However, 21% of marketers still found influencer marketing ineffective, highlighting key challenges with strategy, execution, and management.
63% of marketers stated that influencer-generated content performed better than other brand-directed content.
In fact, 21% repurposed influencer content for:
- Paid Ads - 23%
- Organic Social Channels - 25%
- Website/Product Pages - 21%
- Email - 19%
80% of brands tracked sales from their influencer campaigns in 2024, reflecting the growing importance of influencer marketing in driving sales.
When asked how they determined influencer-generated sales, brands and marketers selected:
- Email addresses - 30%
- Referral links - 28%
- Coupon codes - 14%
- Product SKUs - 4.2%
68% of marketers measured the success of influencer marketing campaigns through social media engagement metrics.
50% were concerned with link traffic from posts, while 45% were concerned with website traffic during campaigns.
45% of marketers and brands shared performance results from Influencer partnerships with influencers.
Meanwhile, 48% did so occasionally.
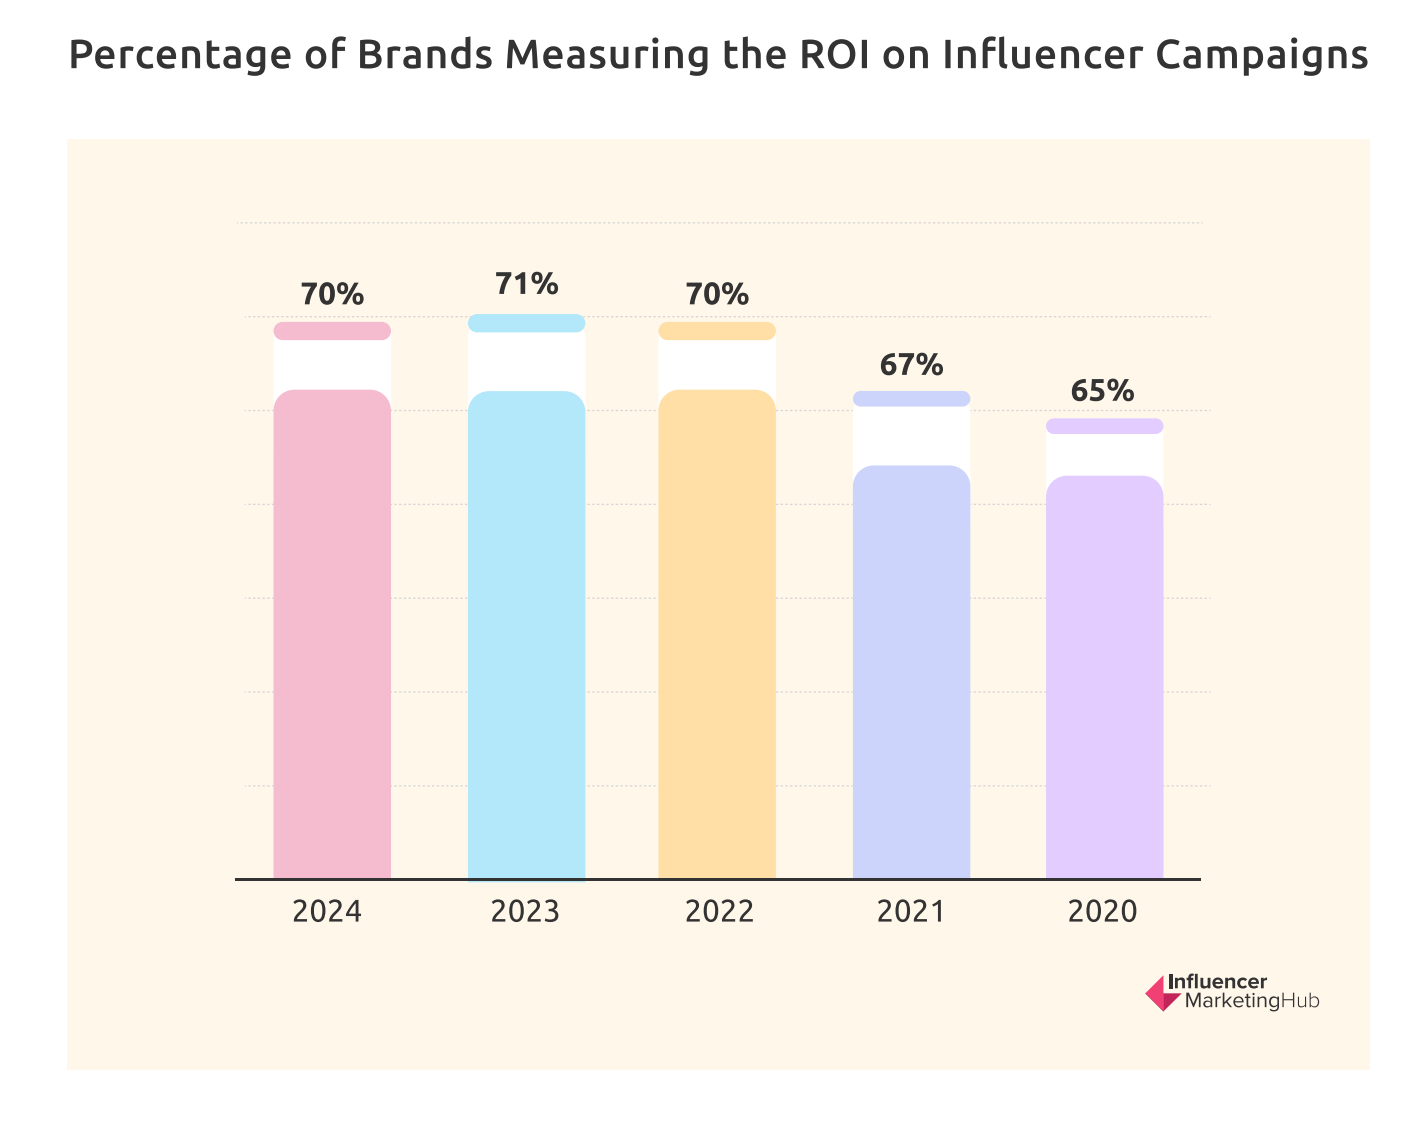
70% of marketers measured the ROI on their influencer marketing campaigns.
This was slightly down from 71% in 2023, but notably higher than 65% in 2020.
At 54%, the most common measure of influencer marketing success was views/reach/impressions.
This was followed by engagement at 24% and conversions/sales at 22%
Another key metric brands used to measure success in 2024 was Earned Media Value (EMV) or the returns that an influencer has generated for the brands they’ve worked with.
Around 81% of marketers favored this metric.
19% were against the metric, mainly due to its complex calculation and the challenges involved with communicating its worth to management.
In 2023, brands that made use of influencer marketing saw an average return per dollar spent of $4.58.
Influencer marketing leaders, or the top 20% of brands using influencer marketing saw an average return per dollar spent of $4.70.
Influencer marketing and AI statistics
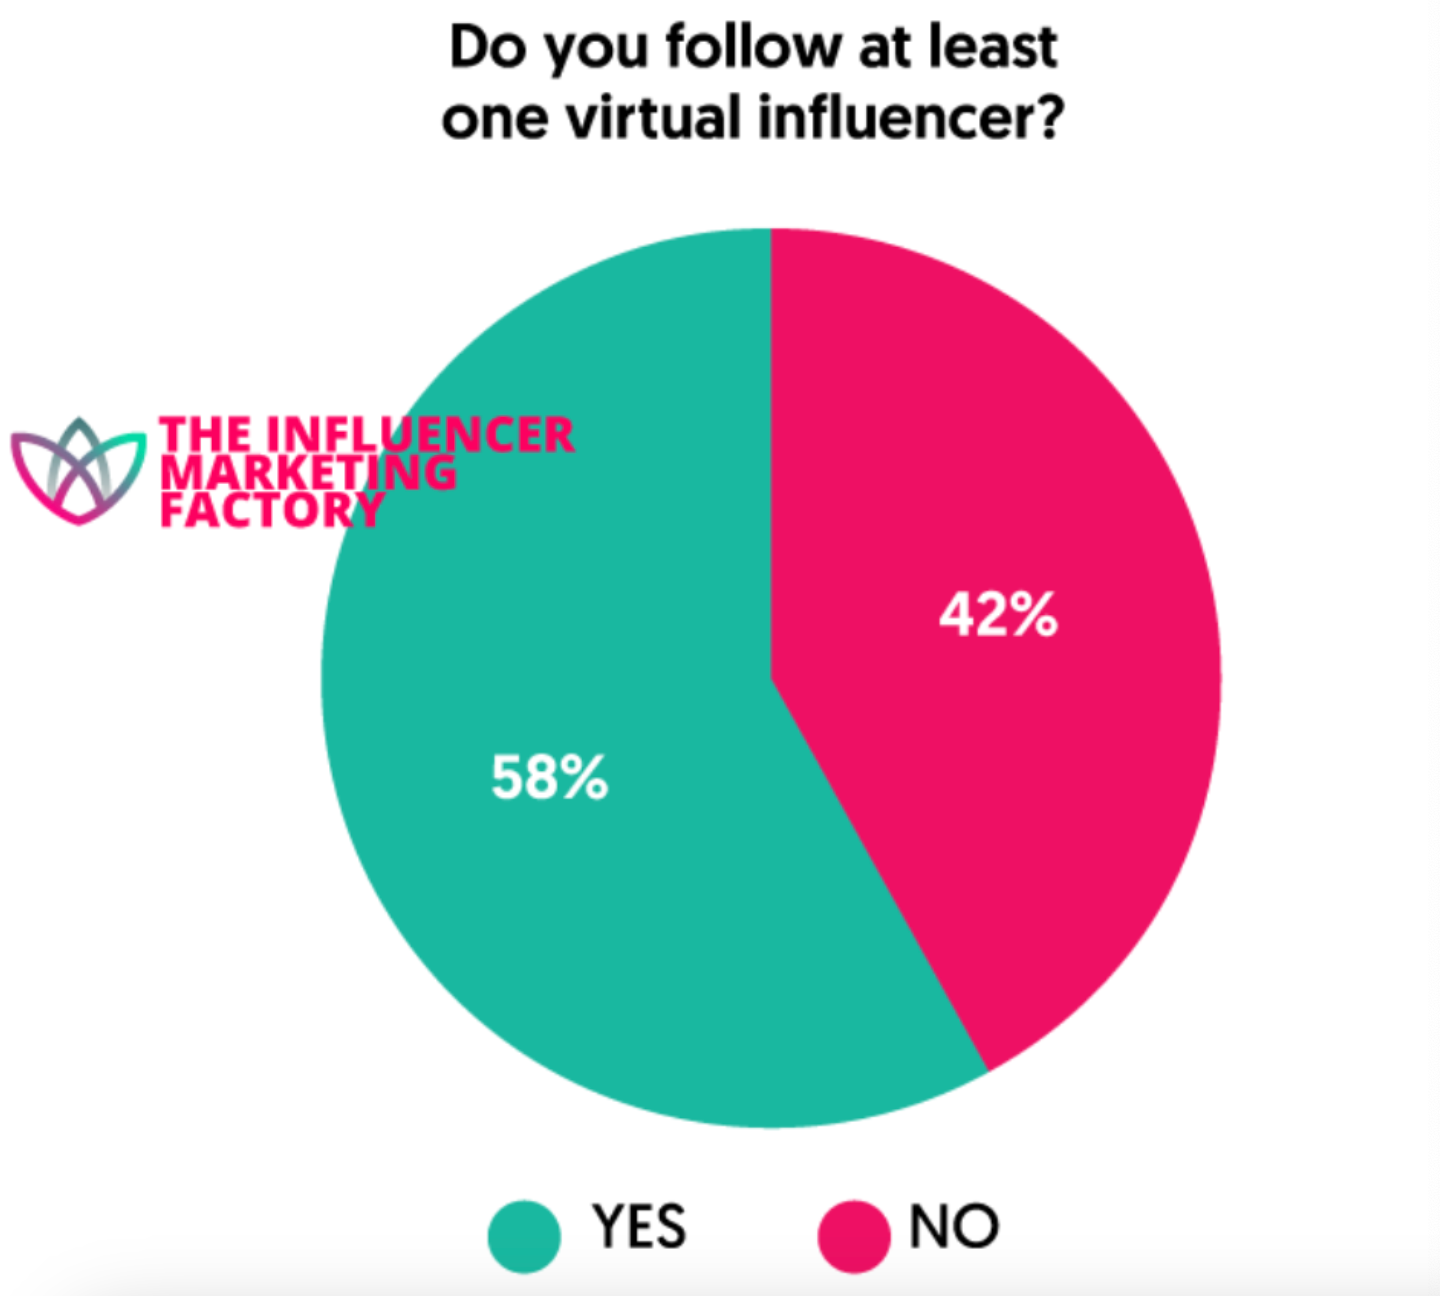
58% of consumers followed a virtual influencer, while a further 65% bought a product or service promoted by one27.
- A majority of consumers followed virtual influencers on YouTube and Instagram.
- 54% of consumers found virtual influencers relatable.
- 56% of consumers trusted products and services promoted by virtual influencers.
Only 37% of consumers stated they would be more interested in a brand that used an AI influencer. For Gen Z consumers this rose to 46%.
However, the same percentage said they would be distrustful of the brand. Meanwhile, 27% of consumers said they would be indifferent and unable to tell the difference between AI and human influencers.
Over 60% of marketers stated they had used virtual influencers in 2024.
Virtual influencers refer to digital characters created using computer graphics software. Examples include Lu do Magalu, Barbie, and Guggimon.
75% of marketers believed influencer marketing could be automated.
However, the percentage of marketers who believed automation plays a vital role in influencer marketing fell from 77% in 2023 to 73% in 2024.
63% of brands and marketers in 2024 planned to use AI or machine learning (ML) to identify influencers and create effective campaigns.
Key use cases included identifying the most effective influencers for a particular brand or campaign (56%) followed by locating and distributing relevant content (19%). Another growing use case was identifying fake influencers and bogus engagements.
Looking to boost your brand? Check out Whop
Whether you're an influencer looking to sign your next big campaign or a business trying to connect with influencers, Whop can help. Whop has thousands of communities dedicated to helping businesses find success.
Check out business on Whop today and find the right community, course, or connection for you and your brand.
Sources
References
- Allied Market Research
- Statista
- Influencer Marketing Hub
- Markets and Markets
- Statista
- eMarketer
- Adobe
- PR Newswire
- Adobe
- IZEA
- Aspire
- Sprout Social
- NeoReach
- CreatorIQ
- Sprout Social
- Sprout Social
- Sprout Social
- IZEA
- Traackr
- Influencer Marketing Hub
- Emplifi
- Onalytica
- CreatorIQ
- Havas Red
- Adobe
- Hubspot
- Influencer Marketing Factory


