Discover over 60 newsletter statistics you need to know, including key engagement metrics, revenue, and more.
Key takeaways
- Newsletters outperform social media with 38.7% open rates versus 10%, making them the most effective channel for audience engagement.
- Newsletters generate $44 ROI per $1 spent, with 5-10% of free subscribers converting to paid at an average price of $11/month.
- Welcome emails achieve 47% open rates, and optimizing for mobile, short subject lines, and Monday/Sunday sends maximizes engagement.
Newsletters have attracted considerable attention in recent years—and with good reason. Not only are they still one of the best ways to nurture deeper connections with engaged audiences, but they have also emerged as a lucrative business model.
With this in mind, we've consulted a wide range of sources to deliver over 60 paid newsletter statistics you need to know for 2026.
Read on for a comprehensive look into newsletter engagement, monetization, costs, and more.
Newsletter growth statistics
Below, we explore the key trends driving newsletter growth.
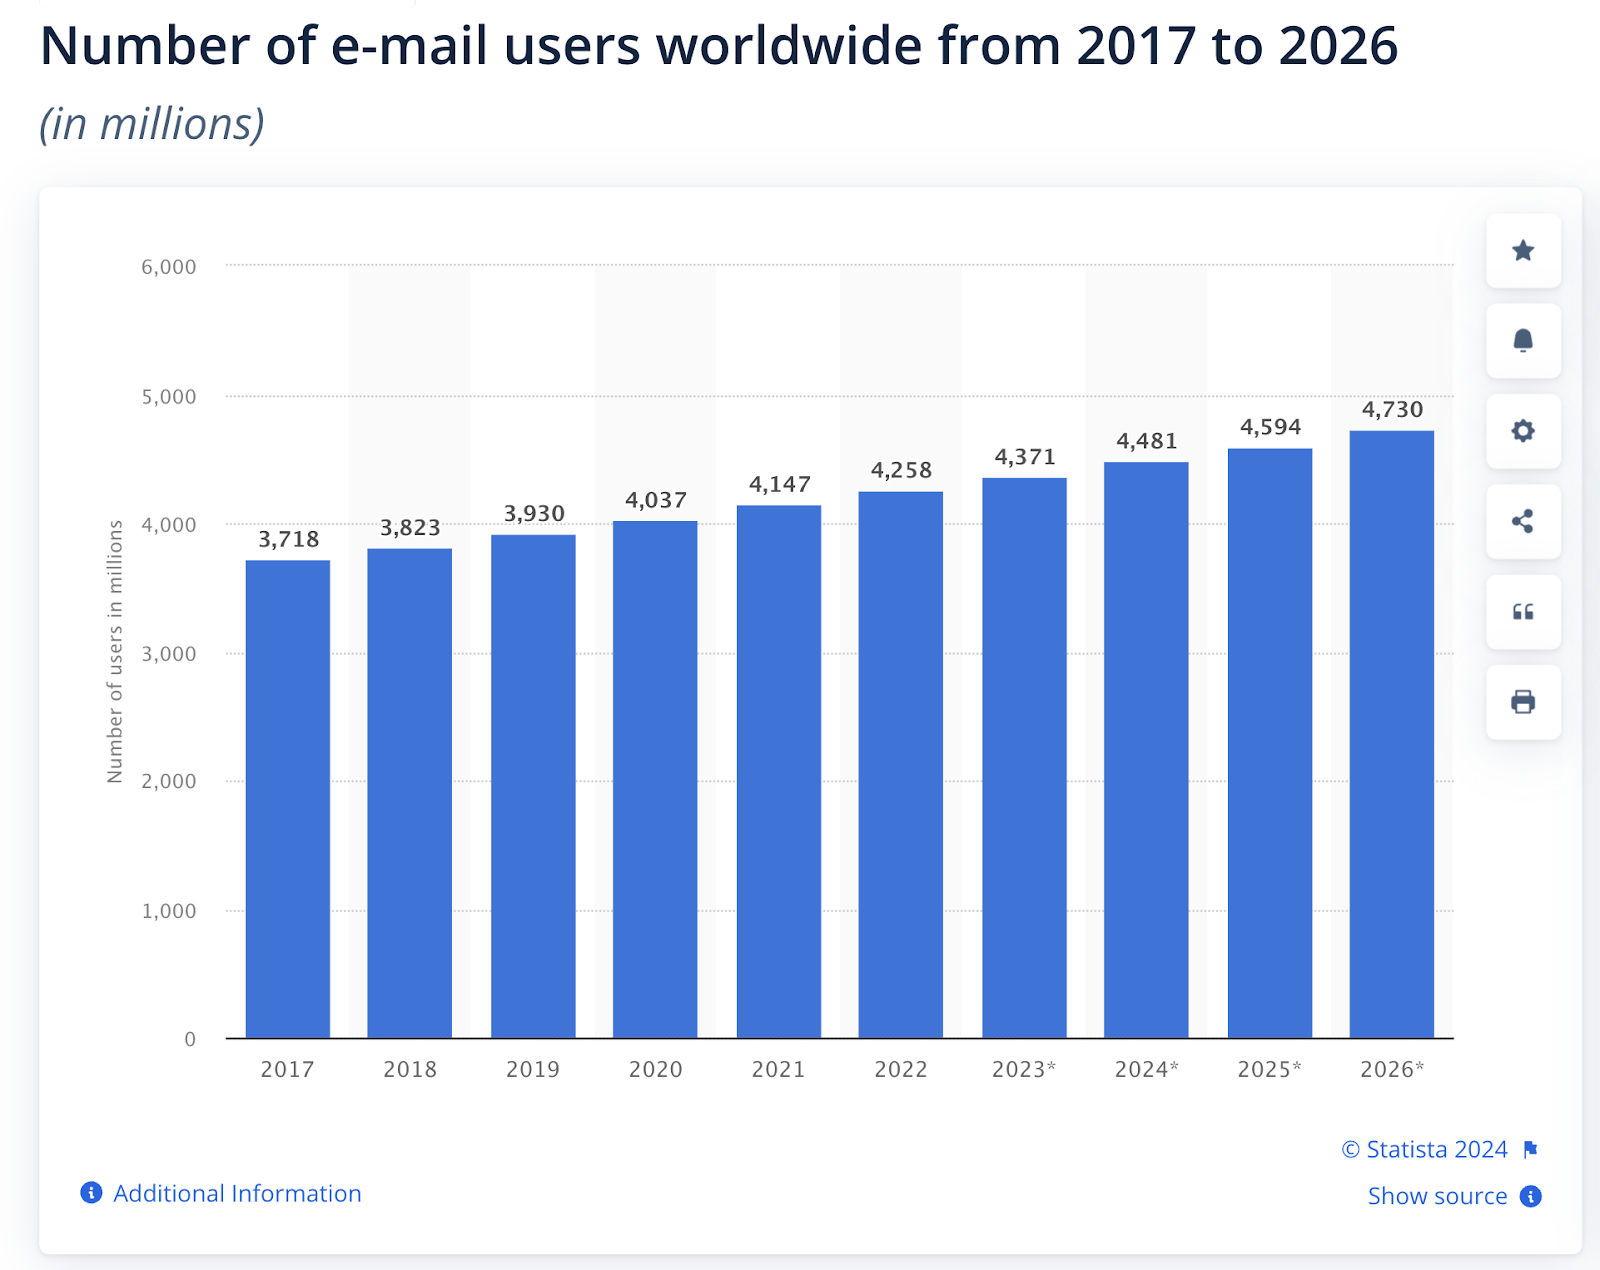
There will be over 4.73 billion email users1 globally by 2026.
This represents a 19% increase from 3.7 billion users in 2017.
In 2024, email users exceeded 4.4 billion.
That’s over 82% of the world’s internet users and 54% of the global population.
Over 376 billion emails will be sent and received daily worldwide in 2025.
This represents an increase of 23% from 306 billion emails sent and received every day in 2020.
Newsletter publishers and platforms have experienced notable growth in subscriber counts and newsletters.
For example in 2023, Beehiiv noted a whopping 700% increase in newsletters on its platform2.
Additionally:
- Beehiiv had 10,000 newsletter creators and 93 million unique readers.
- Newsletter creators over 4.5 billion emails were sent using Beehiiv in 2023, up from 402 million between 2021 and 2022.
Meanwhile, inboxReads noted a 27% year-over-year increase3 in newsletters submitted on its platform.
Overall, since 2019, newsletter submissions on its platform have increased by 514% from 137 to 840.
As of 2023, 70% of publishers considered newsletters a key investment area4.
50% of publishers already offer 1-5 newsletters with 50% offering more.
As per a ConvertKit report, creators sent 902 emails every second5, a 70% increase from 2021.
Additionally, 27% of creators planned to start a newsletter in 2025. The key reasons creators gave for making newsletters a priority were:
- Owning more of their channels.
- Building deeper connections with their audiences.
- Higher open rates of up to 45% vs 10% for social media.
- Greater monetization opportunities
The same report revealed that newsletters were the most popular form of content created at 58%.
This was followed by:
- Articles, blog posts, and books at 51%
- Educational courses at 30%
Meanwhile, short-form video, which was predicted to be the preferred platform for creators in 2023, fell out of favor due to:
- Low engagement
- Workload overwhelm
- Poor monetization
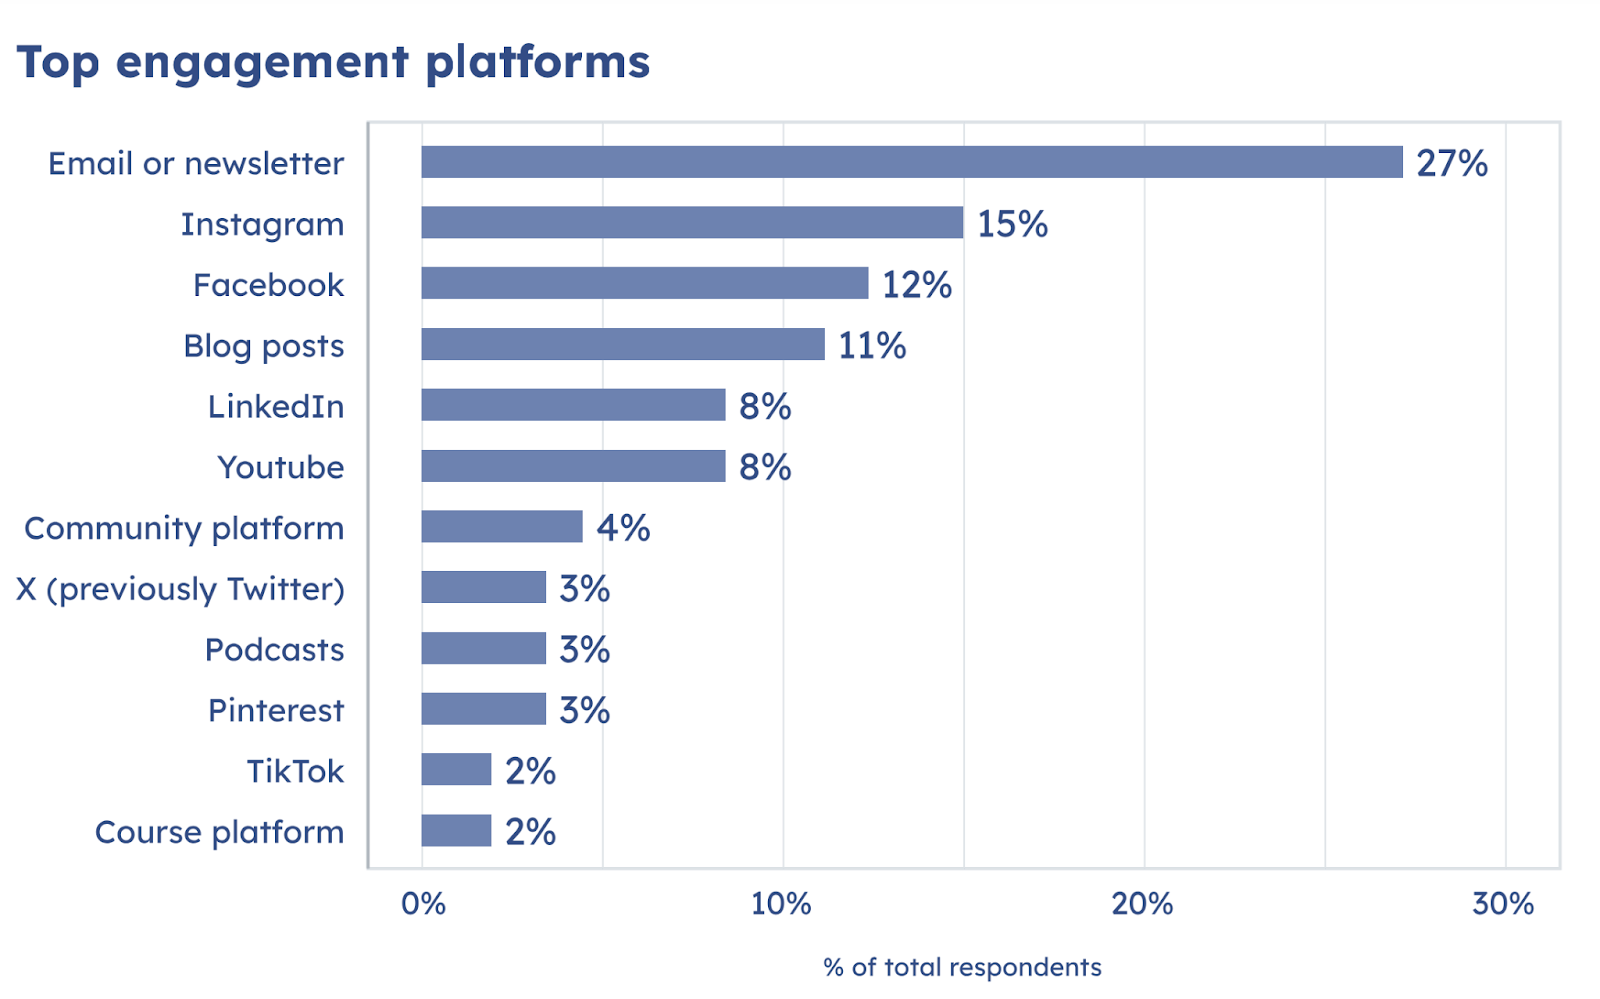
Lastly, creators had the best audience engagement through newsletters, according to 27% of creators.
As a result, 11% of creators prioritized email engagement with their audiences in 2024.
Newsletter engagement statistics
In the previously mentioned Beehiiv report, 4.5 billion newsletters across all industries were analyzed, revealing the following engagement metrics:
- An open rate of 38.7%, down 4% from 42.9% in 2022.
- A click-through rate of 1.85%, up from 1.79% in 2022.
- A bounce rate of 2.4%
- A spam complaint rate of 0.01%
According to the same report, the best-performing email was the welcome email with an average open rate of 47%.
Typically automated, the welcome email is sent to outline what new subscribers can expect and to encourage engagement right away.
Additionally, venture capital newsletters had the highest engagement rates at 50.4%
This was followed by sports newsletters at 47.5% and food & drink newsletters at 45.3%. Other newsletter niches whose open rates were above the average of 38.7% were:
- Fitness - 44.9%
- Investing - 43.9%
- Community - 43.7%
- Finance - 43%
- Entertainment - 42.9%
- Money - 42.7%
- Lifestyle - 42.5%
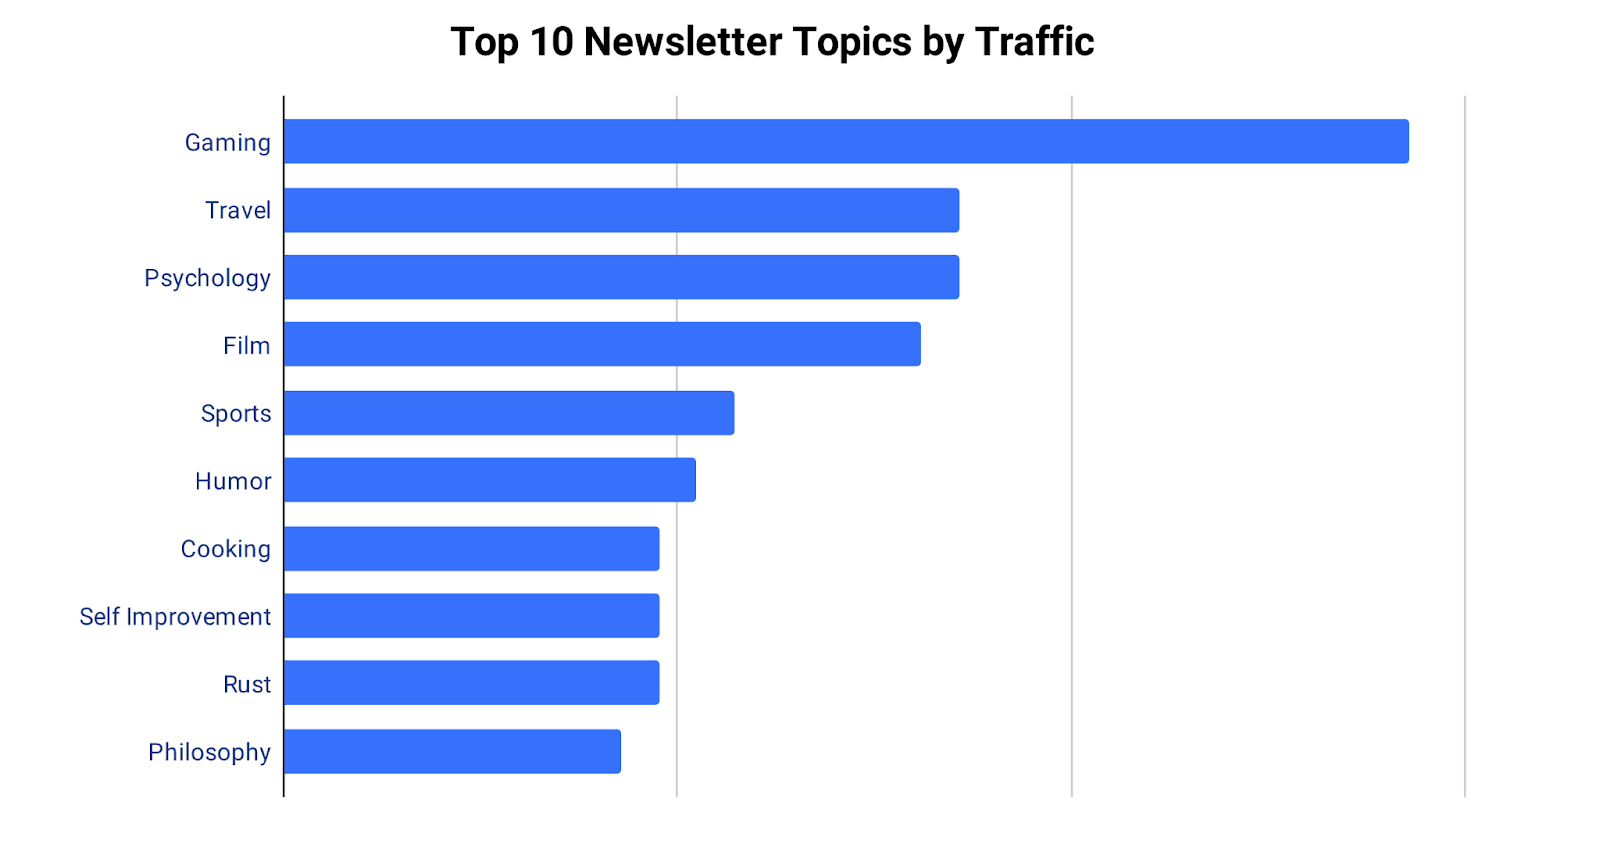
Meanwhile, the InboxReads report revealed that in 2023, newsletter subscribers were most interested in the following topics:
- #1 - Gaming
- #2 - Travel
- #3 - Psychology
- #4 - Film
In a What If Group report, 47.3% of consumers subscribed to at least one email newsletter for news and entertainment6.
- 19.4% subscribed to 2-3 newsletters
- 14.7% subscribed to 1 newsletter
- 7.5% subscribed to 5 or more
- 5.7% subscribed to 4-5
Over 3150 AI newsletters were launched on Beehiiv in 2023, making up 12% of all newsletters on the platform.
As consumers and businesses seek to stay updated on the latest AI developments, the demand for AI newsletters is expected to increase in 2025.
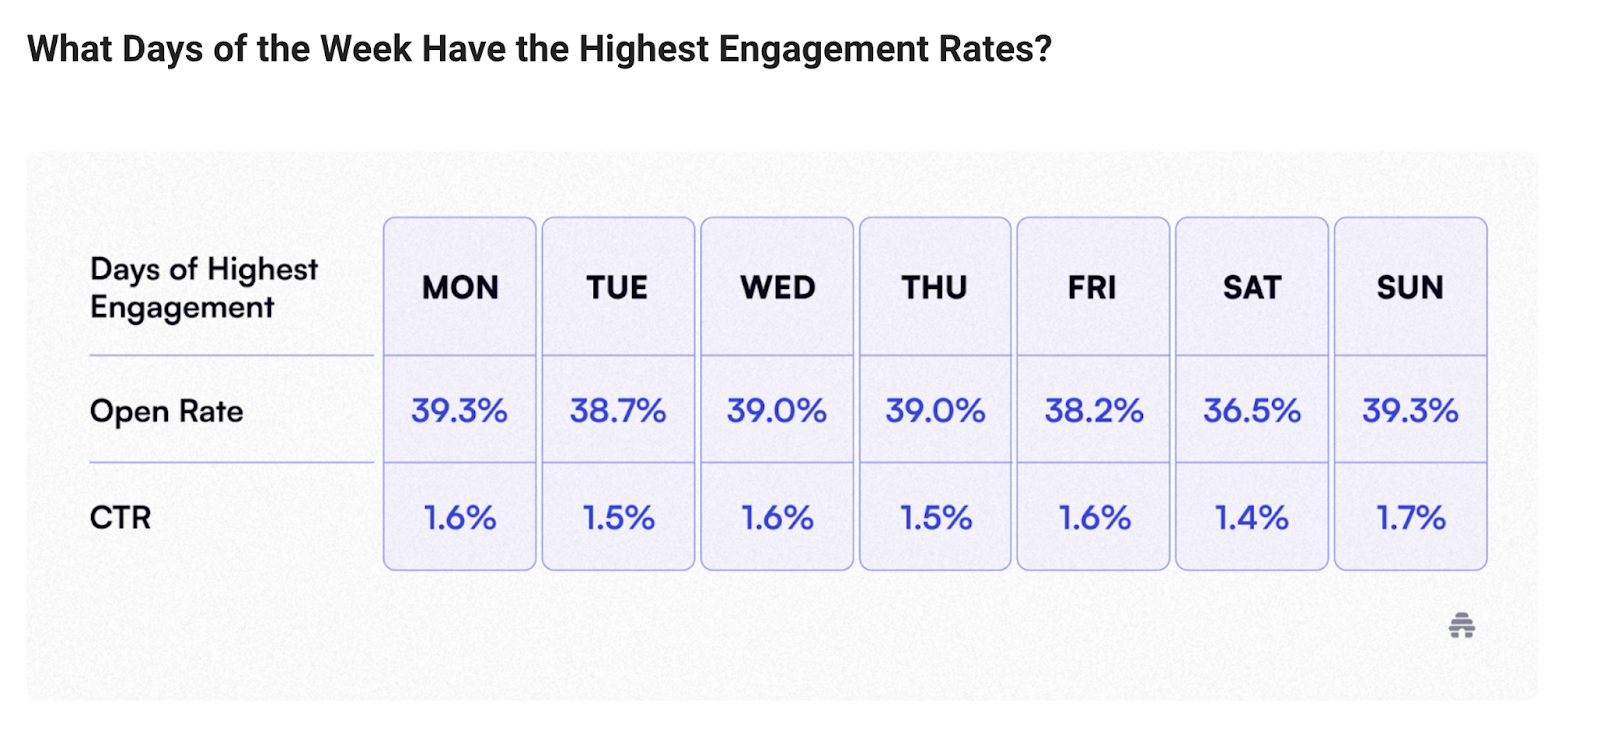
Beehiiv found that with open rates of 39.3%, Monday and Sunday were the days of the week with the highest newsletter engagement rates.
Clickthrough rates were also higher on both days, with an average of 1.7% on Sundays and 1.6% on Mondays. Meanwhile, Saturdays had the lowest engagement rates with open rates of 36.5% and click-through rates of 1.4%.
In addition, the times of day with the highest engagement rate were 10 am with an open rate of 44.5% and 11 am with an open rate of 42.4%.
This was followed by 1 pm and 2 pm with open rates of 41.5% and 41.2% respectively. On the other hand, the worst times to send a newsletter were early morning between 2 am and 6 am, when open rates dropped below 30%.
Beehiiv found that the majority of newsletter creators (57.1%) sent a newsletter monthly in 2023.
This was followed by 37.9% of creators who opted for a weekly publishing schedule. Meanwhile, only 4.9% of newsletter creators sent a newsletter daily.
Newsletters with 0-20 characters in the email subject line had the highest open rates at 40.2%.
This was followed by 21-40 characters with open rates of 39.7%. Emails with 41-60 characters had open rates of 37.9%. On the other hand, email subject lines with 81-100 characters had the lowest open rates at 32.5%
The average newsletter had a character count of 2,115.
That’s about 360 words and much shorter than the average blog post.
Newsletters focusing on a specific niche had a 16% higher open rate and a 21% higher click-through rate7.
Some of the most profitable newsletter niches were:
- Finance and investing
- Technology
- Parenting
- Health and Wellness
- AI Newsletters
Interactive or dynamic newsletters had 2x more engagement8 than static content.
In addition:
- Interactive emails increased open rates by 73%
- Adding videos to email increased click rates by 300%
A/B, QA, and spam testing emails led to returns that were on average 28% higher9 as per a Litmus report.
Research revealed that A/B testing increased email ROI to $42 for every $1 spent.
Additionally:
- Spam testing every email before sending generated an ROI of $40 for every $1.
- Running spam filter tests increased ROI from $28 for every $1 spent to $39.
- Using a comprehensive pre-send checklist resulted in an ROI of $40 per $1 spent compared to $28 for those that didn’t.
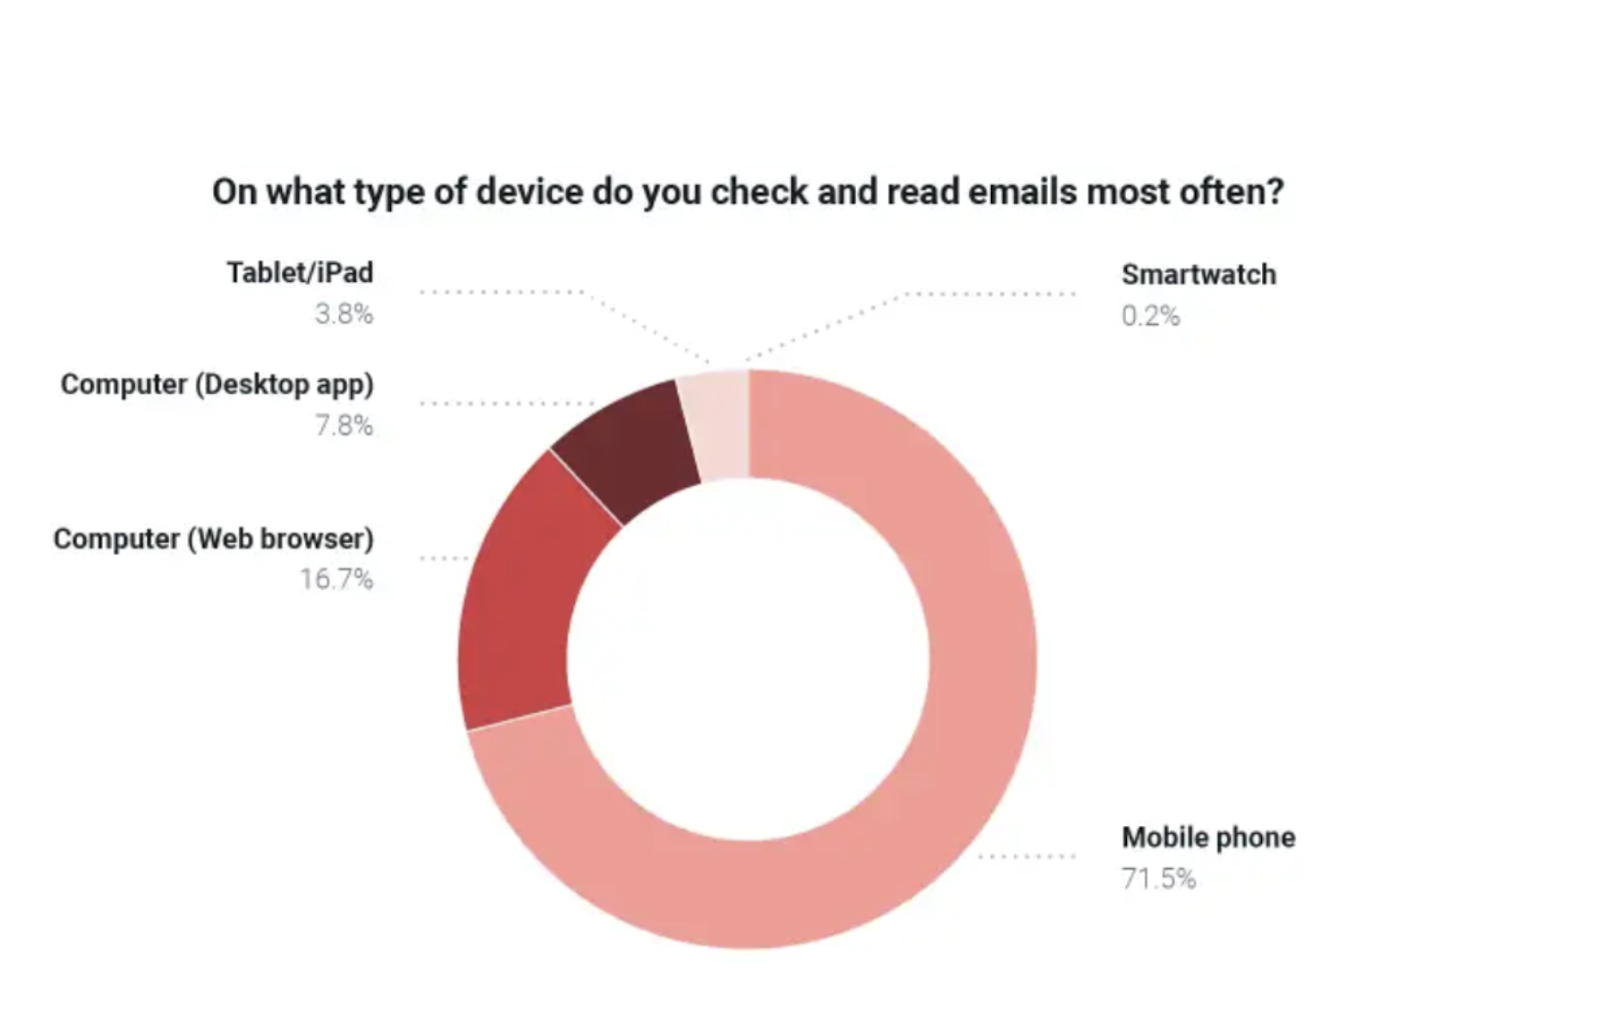
According to a Mailgun report, 71.5% of email users viewed emails primarily from their mobile phones10.
Mobile drove close to 60% of global website traffic in 2024 and accounted for the majority of emails opened. Publishers looking to gain (and keep) audiences must optimize their newsletters for mobile.
There has been a 77% increase in email engagement11 over the last 12 months. As per LiveIntent research, email users spent close to six hours a day12 compared to just 2.5 hours on social media in 2023.
99% of email users checked their inboxes every day13 while 85% checked their emails more than twice a day. A majority of email users (55%) did their checks in the morning, usually within the first 10 minutes of waking up.
Newsletter monetization statistics
In 2024, premium subscription-based content was identified as the most important digital revenue stream14.
Since 2020, subscriptions have become a popular way to monetize newsletters. In another report, 57% of publishers expected their subscription revenue to grow15 in 2023.
According to Convertkit16, the average price of a paid newsletter as of 2024 was $11.
Pricing typically didn’t fall below $5 a month, Meanwhile, high-value newsletters such as those targeting business audiences were over $40 a month.
The average yearly price of a paid newsletter was $100 with most creators offering two free months as a common promotional method.
In the previously mentioned What If Group report, 71.1% of consumers were willing to spend up to $10 per month or $120 per year on a newsletter.
Some audiences, particularly those in business and finance, are willing to pay more. In fact, some of the most popular newsletters in these niches charge annual subscriptions17 of over $300.
For example:
- The Bottom Line - $369
- MarketBeat Daily - $399
- Insider Newsletter - $420
- Alpha Picks - $499
- Org Charts - $999
The typical conversion rate from free to paid newsletter is around 5% and may go as high as 10% for some newsletter creators.
- A conversion rate of 5% means that out of an email list of 10,000, around 500 will convert to paying subscribers.
- A conversion rate of 10% means that out of an email list of 10,000, around 1000 will convert to paying subscribers.
The typical subscriber churn rate on a paid newsletter is 4% per month.
For a list of 1000 paying subscribers, a 4% churn rate would mean a loss of 40 monthly subscribers. While churn is normal, a higher or growing churn rate may point to subscriber engagement or satisfaction issues.
According to the What If Group report, newsletters had an ROI of up to $44 for every $1 spent.
This is higher than the average email ROI of $36 for every $1 spent.
Beyond paid subscriptions, other key monetization methods include ads, sponsorships, affiliate marketing, product or service sales, and newsletter flipping.
For example:
- The Publish press (60,000 subscribers) generates $7000 per primary ad slot18 and $2000 per listed ad.
- The Rundown, an AI newsletter generates $2,000 for a main ad and $1,000 for a trending ad.
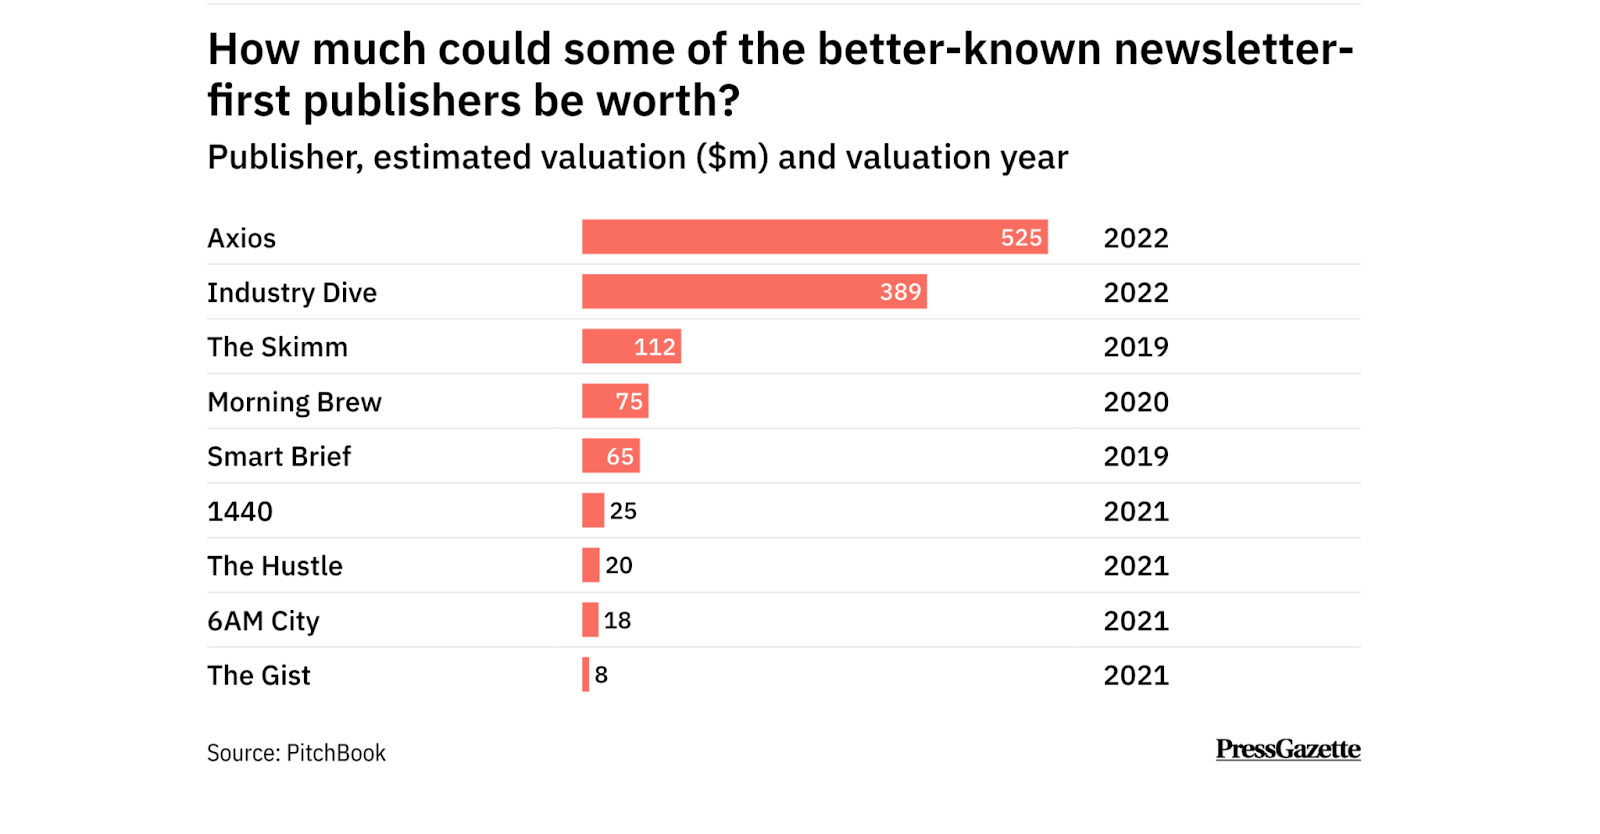
Newsletters are also a lucrative business model. The Agora, a collection of newsletter businesses, makes $1 billion per year from its portfolio of email newsletters19. Plus, some of the most popular newsletter-first publishers have multi-million dollar valuations20.
- Axios - $525 million
- Industry Dive - $389 million
- The Skimm - $112 million
- Morning Brew - $75 million
- Smart Brief - $65 million
- 1440 - $25 million
- The Hustle - $20 million
Some of the most noteworthy newsletter acquisitions that have occurred in the last three years include:
- In 2020, Morning Brew, which generated over $50 million in revenue in 2021, sold a majority stake to Insider, valuing the company at $75 million.
- In 2021, The Hustle was acquired by Hubspot for $27 million.
- In 2022, Milk Road, a crypto newsletter, was acquired for 7 figures.
- In 2023, The Peak, with 2.8 million subscribers21, was acquired for $5 million.
- Axios was sold for $525 million22 to Cox Enterprises.
Recent newsletter sales on Flippa place subscriber value at between $0.45-$3.20 per subscriber23.
The value of a newsletter is typically determined by analyzing its subscriber base, engagement metrics, monetization methods, and growth potential.
As per a 2024 Validity report, the average value per email is expected to increase24 from $0.13 to $0.17 by 2026.
As third-party cookies are phased out, more marketers are expected to turn their spending to high ROI channels like email.
Over 17,000 writers are paid for their newsletters on Substack25.
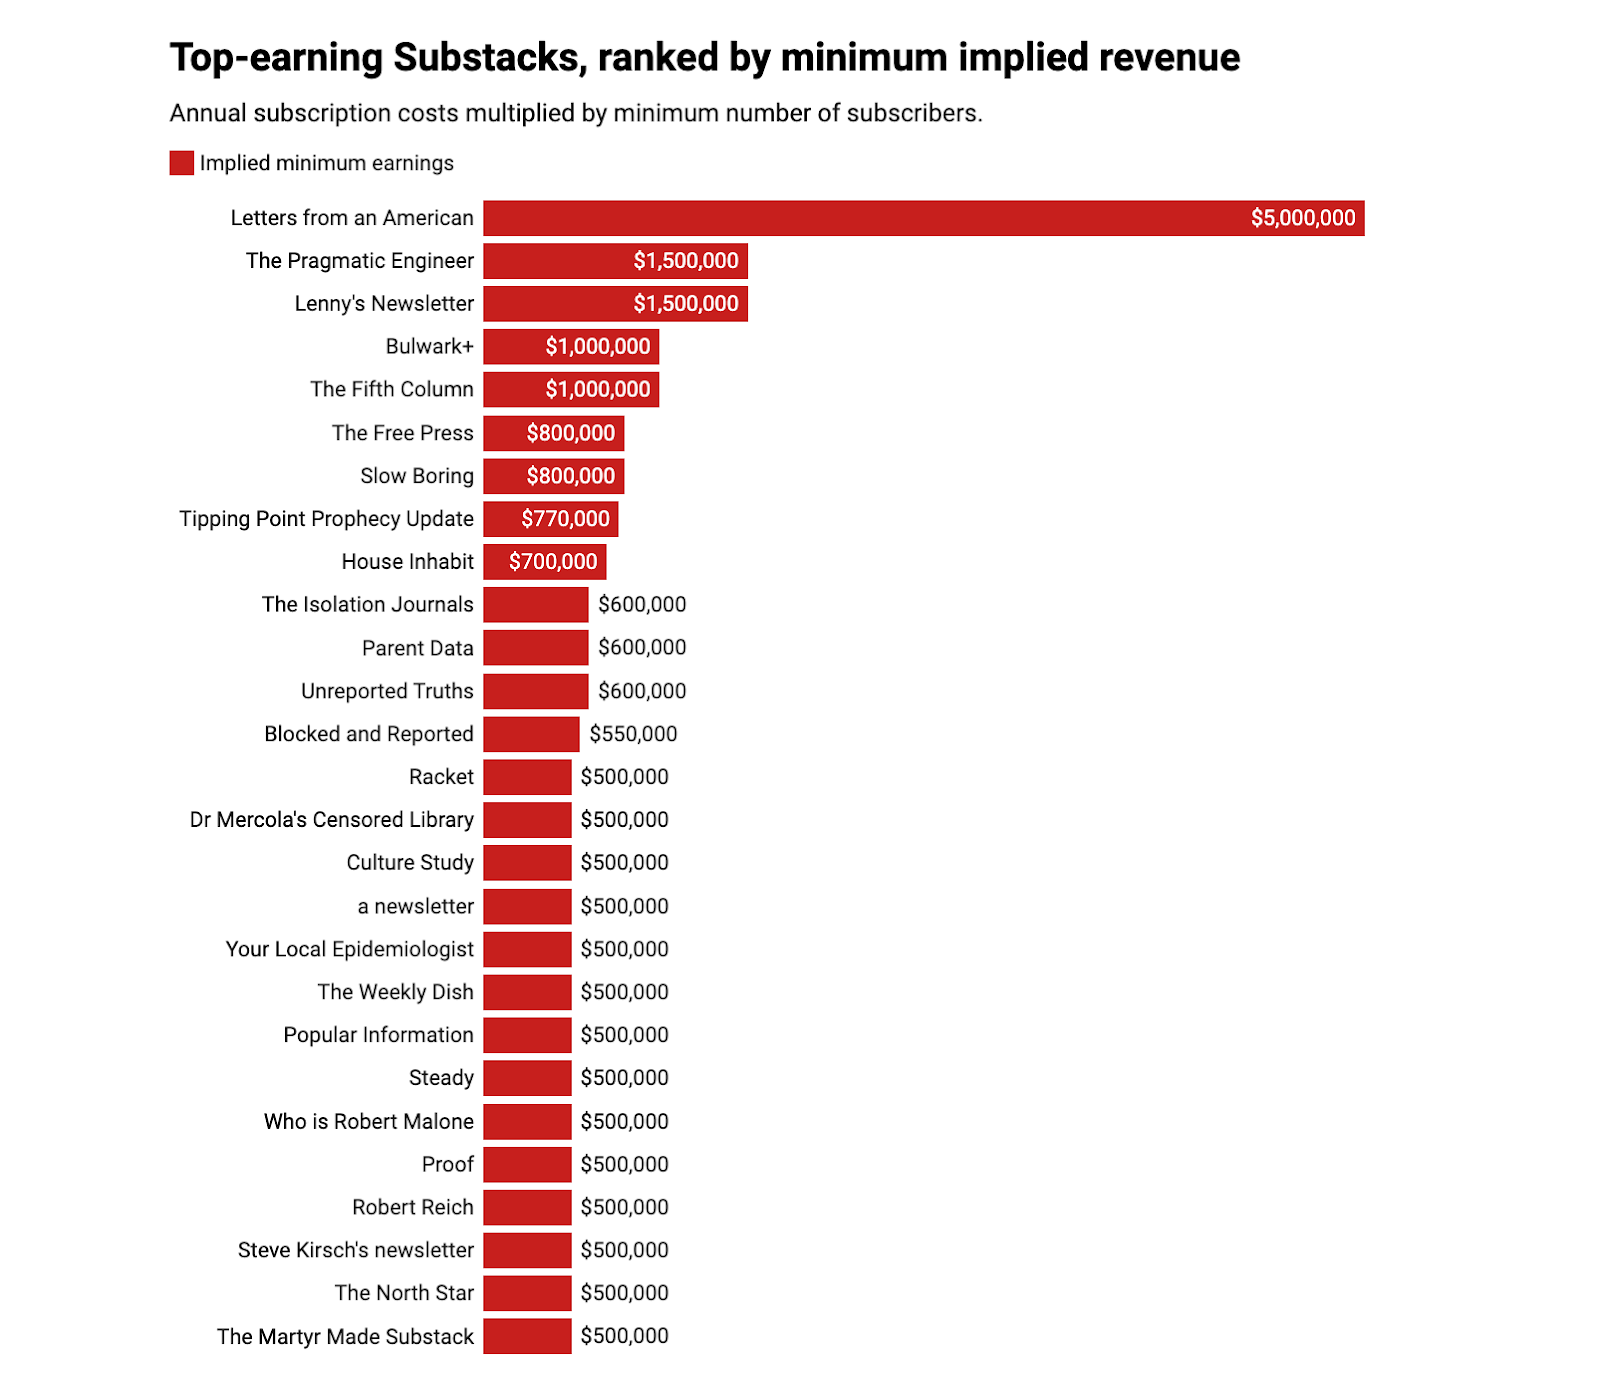
As of February 2023, the top 27 highest-earning newsletters on Substack generated at least 22 million26 in subscription revenue.
Meanwhile, the top 27 authors pulled in over $25 million per year collectively, up from just $7 million in 2020.
The highest-earning newsletter on Substack was ‘Letters from an American’, with an annual revenue of $5 million.
This was followed by:
- The Pragmatic Engineer: $1.5 million
- Lenny’s Newsletter: $1.5 million
- Bulwark: $1 million
Among the 27 top-earning newsletters, 60% were in the politics genre.
The second most popular genre was culture at 19%.
As of February 2021, Substack had over 500,000 active paying subscribers to newsletters on its platform.
This is up from over 11,000 paying subscribers in 2018.
Newsletters on Beehiv earned $1.75 million in 2023.
Beehiiv also paid out a total of $271,430 to creators through its Boosts monetization feature. Boosts are a paid recommendation feature that allows newsletters to recommend other newsletters to their subscribers. Brands were willing to pay up to $2.37 per subscriber to acquire a single subscriber.
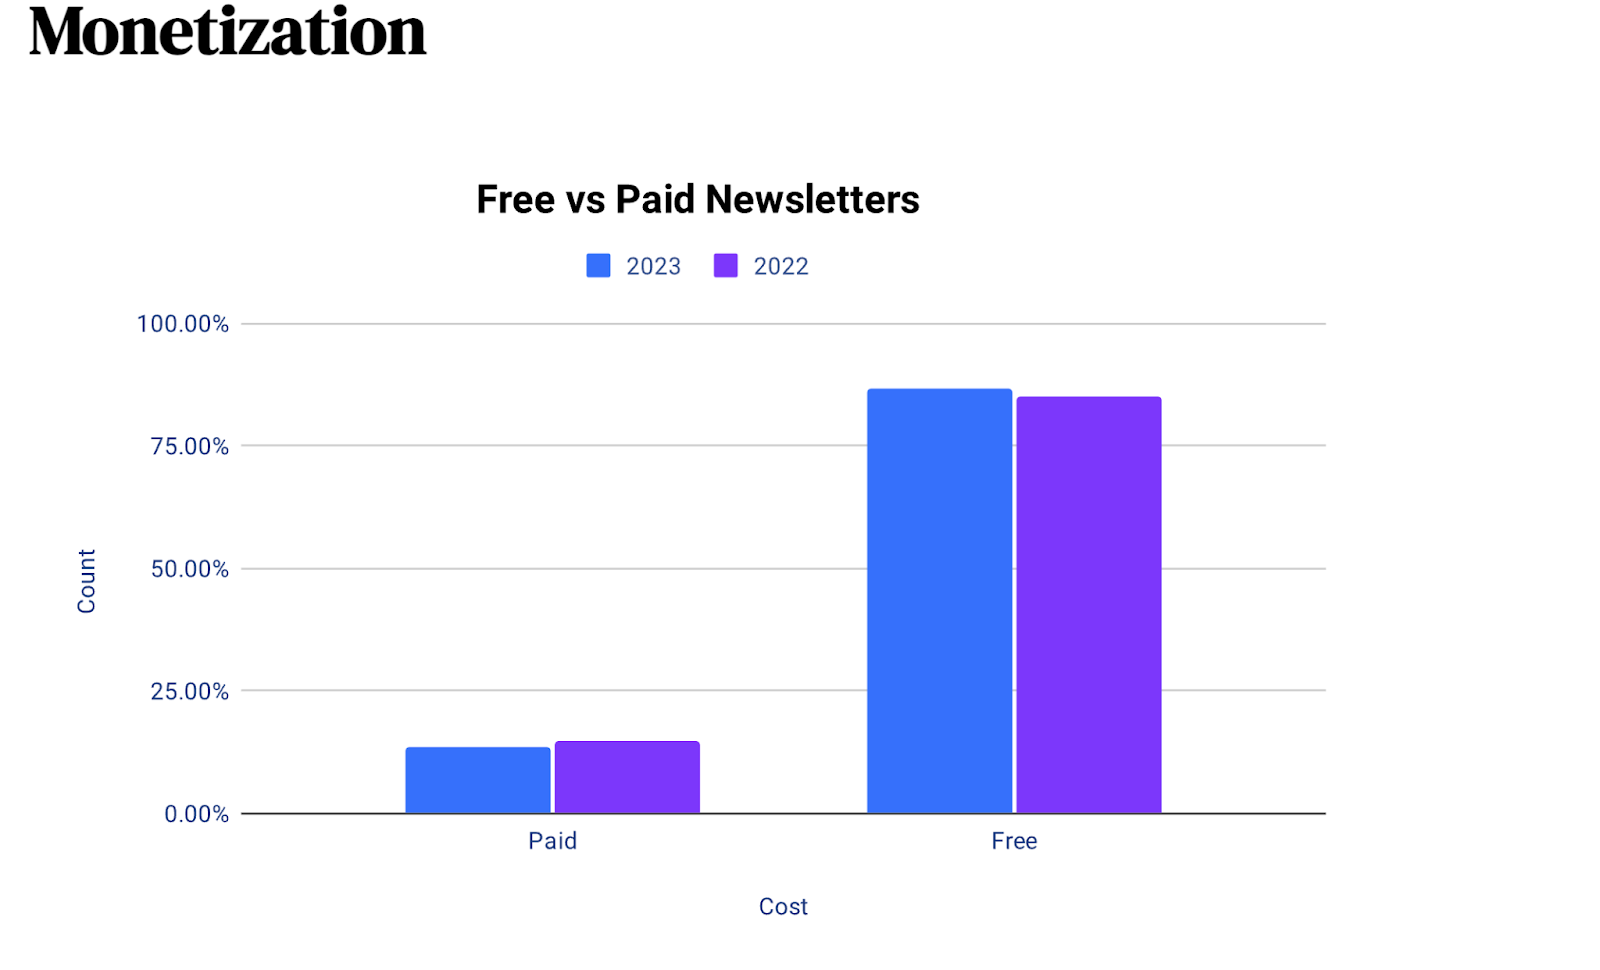
The previously mentioned InboxReads report found that 13.5% of newsletters were paid or offered a subscription.
At 67%, ads and sponsorship remained the most popular form of newsletter monetization.
According to the previously mentioned LiveIntent research, newsletter subscribers were 16 times more likely to be receptive to and engage with newsletter ads.
That’s compared to regular interruptive pop-ups or banner ads.
The What If Group report found that 79.6% of subscribers preferred to access ad-sponsored newsletters for free.
20.4% of subscribers were willing to pay for an ad-free experience.
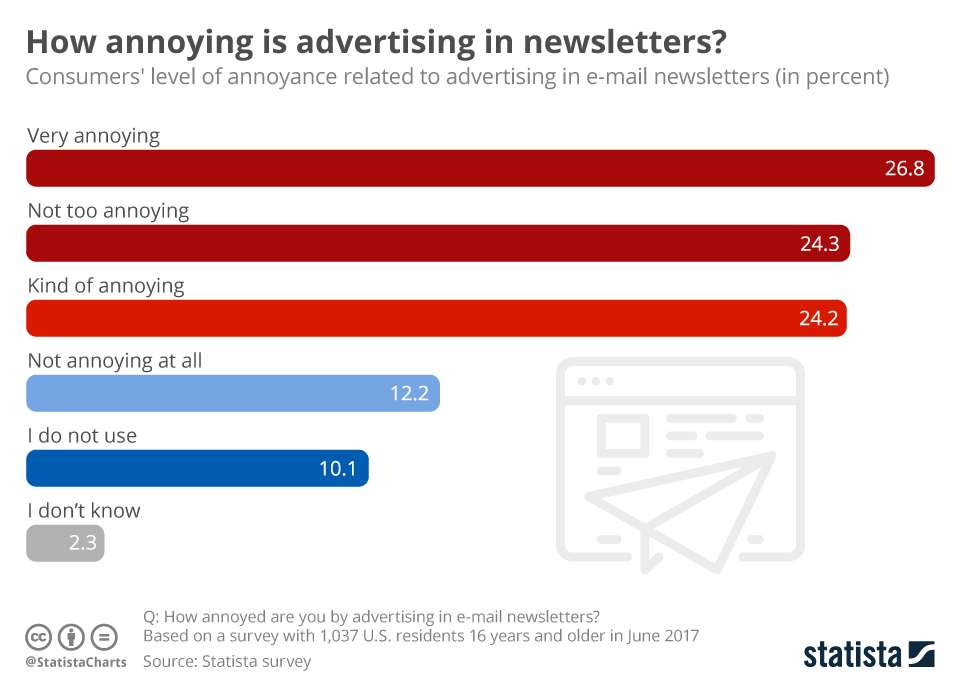
A 2017 survey revealed that up to 75% of consumers27 found advertising in newsletters annoying.
Meanwhile, 12.2% weren’t annoyed by newsletter ads at all.
Newsletter creators looking to monetize via ads should:
- Choose relevant sponsors
- Avoid spam content
- Avoid publishing too many ads
- Prioritize proper ad placement
Newsletter cost statistics
We’ve looked at how much revenue paid newsletters can generate, but what are the typical costs associated with newsletters?
Platform Costs
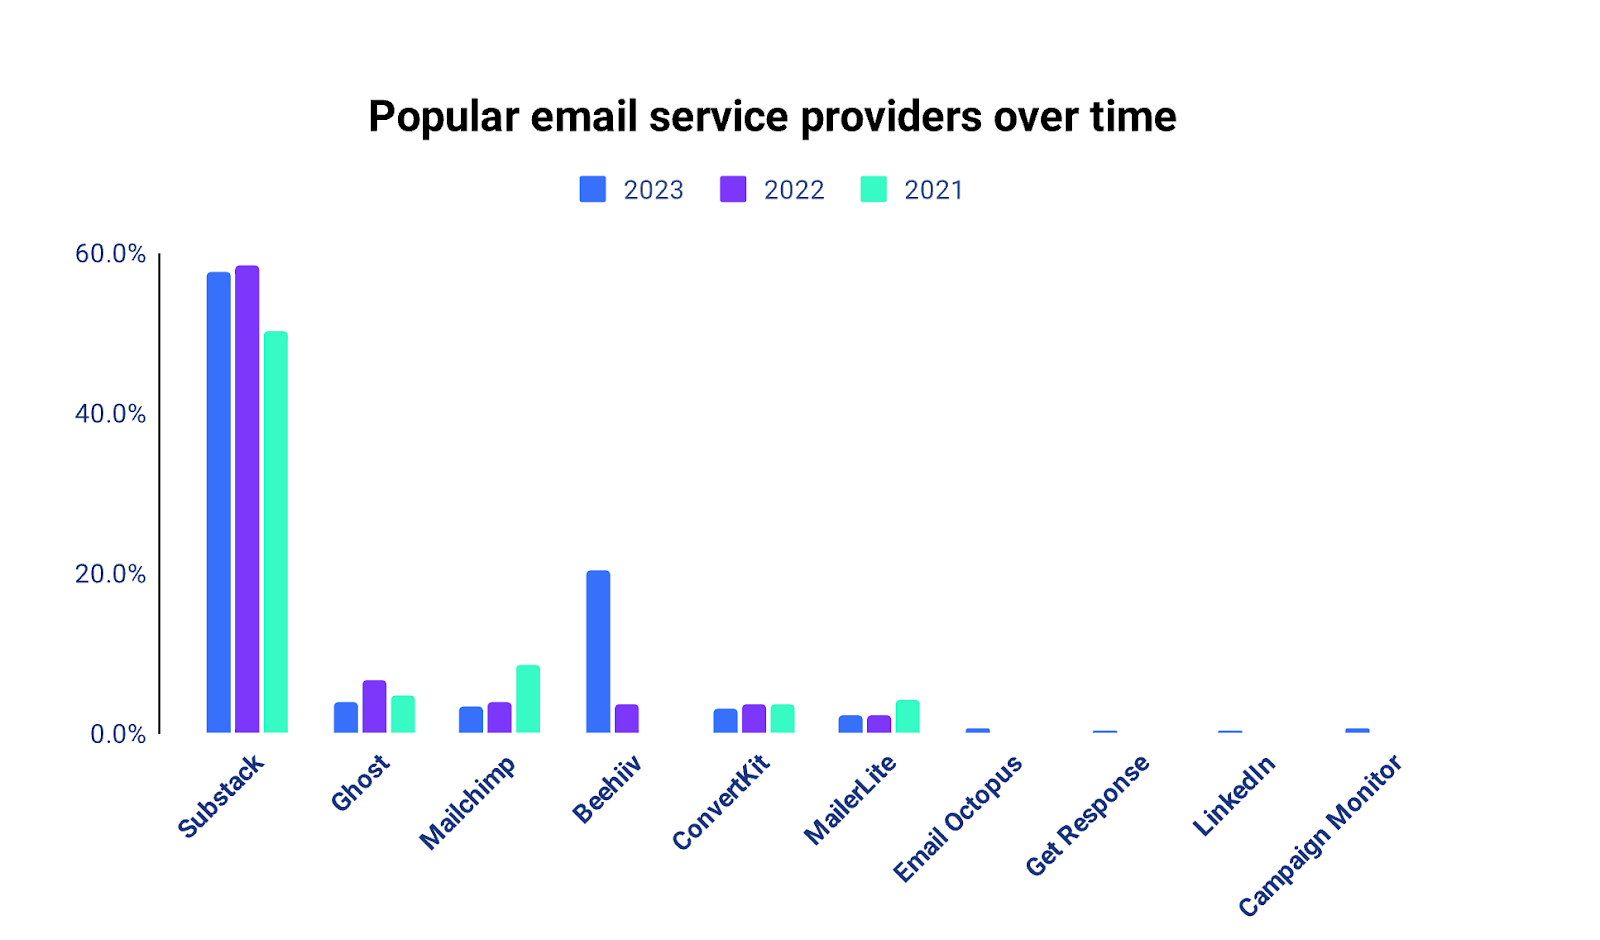
According to the InboxReads report, the most popular email service providers for newsletter creators in 2023 were:
- Substack with a 60% share
- Beehiiv with a 20% share
- Ghost, Mailchimp, and ConvertKit with a market share of 5% each
Monthly pricing across newsletter platforms varies according to several factors. Some platforms, like Substack, are free but have a take rate or platform fee of 10%. Other costs to consider include platform transaction fees which may be up to $0.30 per transaction.
| Newsletter Platform | Under 2500 Subscribers | Up to 10,000 Subscribers | Up to 100,000 Subscribers |
|---|---|---|---|
| Beehiiv | Free | $99 | $299 |
| ConvertKit | Free | $140 | $733 |
| MailChimp | Free | $135 | $955 |
| Substack | Free | Free | Free |
| MailerLite | Free | $73 | $440 |
| Ghost | Free | $174 | $1036 |
| Campaign Monitor | Free | $140 | $733 |
Marketing Costs
Some of the most popular methods for growing a paid subscriber list in 2025 include referral programs, social ads, and email sponsorships. Below, we cover the costs associated with these strategies.
Referral Programs
Referral programs are a great way for newsletter creators to tap into their existing network and increase their subscriber count.
- Newsletters grow up to 35% faster28 when using a referral program.
- Newsletter referrals cost an average of $0.17 per subscriber versus $1-$3 from other acquisition channels.
- Referrals have a conversion rate of 32%.
Social Media Ads
With over 5 billion active social media users around the world, social ads are a powerful way to reach new subscribers. Social media ads can cost anywhere from $15 to $200 per day to $450 to $6,000 per month30.
The average cost per click (CPC) across social media platforms is as follows:
- TikTok - $1
- Facebook - $0.97
- Twitter - $0.38
- Instagram - $3.56
- Linkedin - $5.26
- YouTube - $3.21
- Pinterest - $1.50
Meanwhile, the average cost per 1000 impressions or the cost per mille (CPM)
- TikTok - $10
- Facebook - $7.19
- Twitter - $6.46
- Instagram - $7.91
- Linkedin - $6.59
- YouTube - $9.68
- Pinterest - $30
Email Sponsorship
Email sponsorships typically involve advertising within the body of an email newsletter to reach a community of engaged audiences.
Standard newsletter CPM ranges from $5-$200 depending on the niche, audience size, and sponsorship type31.
- Meanwhile, CPC can range between $0.88-$29.9832
- Primary sponsorship costs can vary from $262-$18,000, with an average cost of around $3,635.
Newsletter deliverability statistics
With paid newsletter renewals depending on engagement, ensuring deliverability is crucial to maintaining a profitable business model.
The previously mentioned Mailgun report found that Gmail was the most-used mailbox provider with more than 72% of email users using the provider.
33% of email users used Outlook while 20% used Yahoo. Overall, these mailbox providers account for 87% of the market (7 out of every 8 emails). In addition to different user experiences, these inbox providers have different deliverability requirements and scores.
The report also revealed that email users had negative reactions to unsolicited emails. 40% deleted such emails, 23% simply ignored them and 20% marked them as spam.
Gmail and Yahoo are implementing stricter consumer-reported spam thresholds. This means senders with spam complaint rates consistently exceeding 0.1% or 1 complaint per 1000 emails delivered, will no longer reach user inboxes.
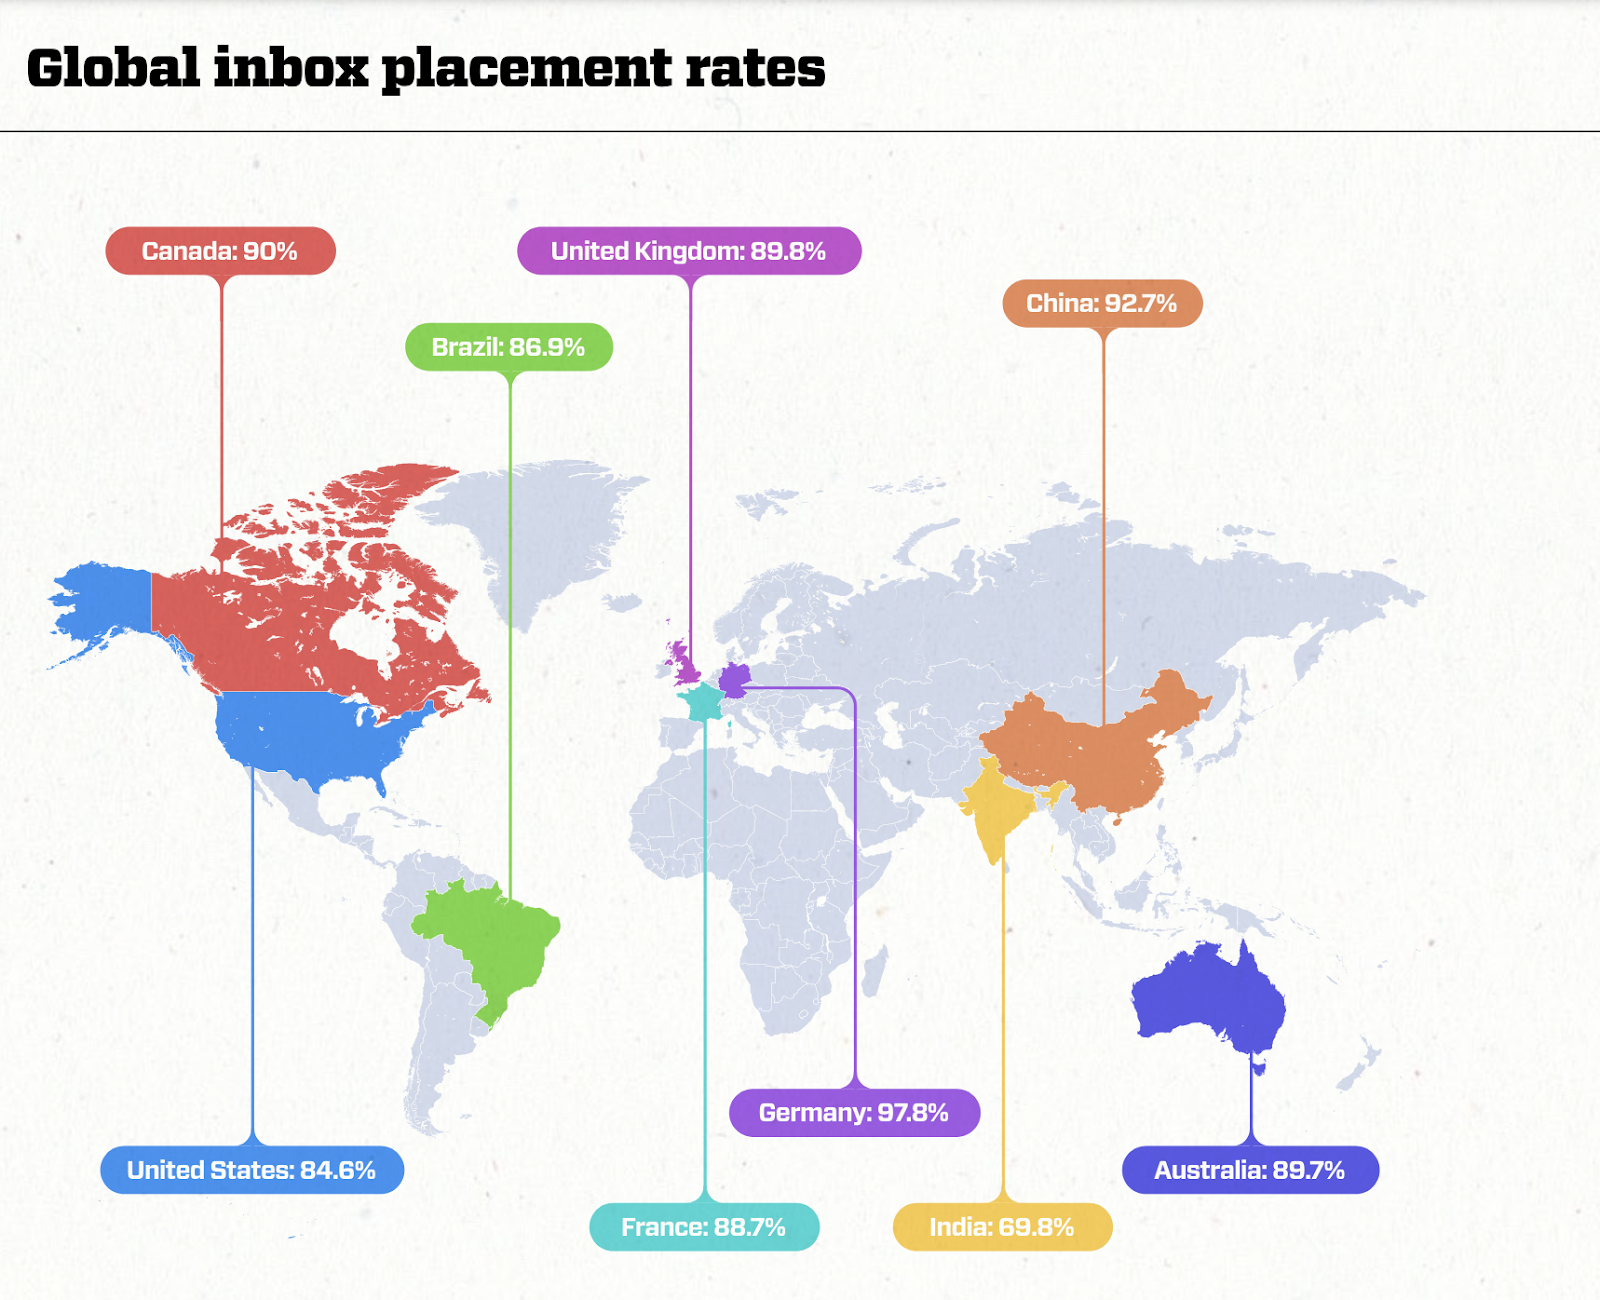
According to a 2023 Validity33 report, global inbox placement rates (a sender’s ability to get emails delivered to the inbox, not the spam folder) were slightly below 85% in 2022.
This means that 1 in 6 legitimate permission-based marketing emails were not delivered to inboxes, costing the average email program around $15,000 for every 1 million emails sent.
The report also found that:
- 10% of emails were not even accepted by receiving mailbox providers.
- Deliverability rates at Microsoft, AOL, Gmail, and Yahoo were slightly higher than the average at 86%.
- Europe had the highest inbox placement rates at 91% while Asia Pacific had the lowest at 78%
To achieve strong deliverability and maintain a great sender reputation, email newsletter senders should follow these general guidelines, along with any other provider-specific requirements:
- Authenticate using Sender Policy Framework (SPF), DomainKeys Identified Mail (DKIM), and Domain-based Message Authentication, Reporting and Conformance (DMARC).
- Get permission from new subscribers using active opt-in methods.
- Verify all new email addresses.
- Send emails only to active and engaged subscribers.
- Screen all content for spam-like factors before sending.
- Remove bounces, opt-outs, and complaints.
- Make unsubscribing easy.
Fortunately, some of the most popular newsletter platforms handle email delivery and have above-average deliverability rates.
For example in 2023:
- ConvertKit had an average delivery rate of 99.8%
- Beehiiv had an average delivery rate of 98%
- Mailchimp had an average delivery rate of 95.5%
- MailerLite had an average delivery rate of 91.7%
Monetize your content with Whop!
Newsletters are growing in popularity, as more and more readers pay their favorite creators in exchange for premium, subscriber-only content.
You can monetize a newsletter in so many different ways - not just subscriptions. From courses to ebooks, paid communities and files, you can use your newsletter to sell all sorts of digital products - and Whop is here to help. Simply create a Whop hub and funnel your newsletter subscribers to that hub, where they can explore additional content such as:
- A community chat app
- A forum
- Giveaways and contests (great for subscriber engagement and sponsored posts!)
- Courses on your niche (why not teach others to do what you do?)
- Downloadable files, like ebooks and digital products.
With Whop, you can turn your newsletter into a money-making machine. Diversify your monetization options but keep all of your customers in one place - your Whop hub.
FAQs
What is the average newsletter growth rate?
Although this varies greatly across industries, the average email newsletter list growth rate is 2.5%.
What percentage of newsletters are opened?
Depending on the industry, around 40% of newsletters are opened.
How do you measure the effectiveness of a newsletter?
To measure the effectiveness of a newsletter, measure key performance metrics such as the open rate, click-through rate, unsubscribe rate, bounce rate, and conversion rate.
Sources
Reference List
- Statista
- Beehive
- Inbox Reads
- Media Markers Meet
- ConvertKit
- MediaPost
- Beehiiv
- Campaign Monitor
- Litmus
- Mailgun
- CMI
- LiveIntent
- Mailjet
- Statista
- The Rebooting
- ConvertKit
- InsiderMonkey
- Fast Company
- Hackernoon
- Press Gazette
- Global Newswire
- Axios
- Flippa
- Validity
- Backlinko
- Press Gazette
- Statista
- Convertkit
- DataReportal
- Ghost
- Validity