We cover over 100 YouTube statistics you need to know, including the platform’s growth, usage, revenue, and more.
Key takeaways
- YouTube dominates video streaming with 2.7 billion users and 25% market share, making it essential for content creators.
- YouTube's ad revenue grew 3,838% since 2010, proving video content remains a lucrative opportunity for creators and marketers.
- India leads YouTube usage at 476 million users, signaling massive growth potential in emerging markets.
Originally created as a dating app by three PayPal employees, YouTube has since become the world's most popular online video platform. With over 2.5 billion users, the platform’s reach and impact on entertainment, consumer behavior, and digital culture is unmatched.
If you’re looking to harness the power of video content, staying clued in on YouTube’s key trends and developments is crucial. That’s why we’ve used our expertise at Whop to provide a comprehensive overview of the platform.
Keep reading to discover over 100 YouTube Statistics for 2026, including usage, engagement, growth, and more.
| YouTube Snapshot | |
|---|---|
| Launch date | December 2005 |
| Industry | Internet, Video Hosting, Social Networking |
| CEO | Neal Mohan |
| Headquarters | San Bruno, California |
| Company Type | Subsidiary |
| Parent Company | Google LLC |
YouTube is an online video platform that allows users to create channels, upload, watch, like, and comment on videos.
YouTube’s key products include:
- YouTube Kids
- YouTube Music
- YouTube Premium
- YouTube Shorts
- YouTube TV
YouTube timeline
Below, we run through YouTube’s key developments.
2005-2007: Founding, acquisition and monetization
In 2005, PayPal employees Chad Hurley, Steve Chen, and Jawed Karim created YouTube. When their initial idea of a video-dating website tanked, the trio pivoted. They opened up the platform to all types of video, and within a year amassed over 20 million users — plus a $1.65 billion acquisition deal with Google.
By the end of 2007, YouTube had launched its Partner program and in-video ads. Other key updates to the platform included personalized profiles, a 10-minute video limit, subscriptions, and cell phone uploading.
2008-2010: VEVO and quality upgrades
2008 saw YouTube introduce 480p videos, video annotations, video analytics tools, and audio swap.
The next year, YouTube XL, 1080p videos, speech recognition, and 3D video were launched.
YouTube also partnered with Universal Music Group (UMG) to launch VEVO. By the end of 2010, YouTube had introduced its “Thumbs up” rating system and 4K video.
2011-2013: Live streaming and comments
By 2012, YouTube Live, YouTube Analytics, and Feature Film rental were officially added to the platform.
In 2013, YouTube merged with Google Video, removed the video responses feature, and added integrated comment sections.
2014-2016: Subscriptions, kids and gaming
YouTube Music Key and 60fps videos were launched in 2014.
In 2015, YouTube added YouTube Kids, YouTube Red, and YouTube Gaming to its platform.
By 2016, the video platform supported 360° and 8K videos.
2017-2019: YouTube Premium and YouTube Music
In 2017, YouTube TV was launched. This was followed by the rebranding of YouTube Red as YouTube Premium in 2018.
2019 ushered in the Video Reach platform. It also saw the abbreviation and rounding down of displayed subscriber counts. The very same year, uploads hit a milestone of 500 hours per minute.
2020-2022: YouTube Shorts and handles
To compete with TikTok, YouTube launched YouTube Shorts in 2020.
In 2021, YouTube removed public dislike counts, targeting cyberbullying and trolling. The next year, YouTube updated its UI and introduced handles.
2023- Present: Ad blockers and longer shorts
In 2023, YouTube began blocking videos for users of ad blockers. The platform intensified its efforts in 2024, targeting third-party apps with ad blockers.
YouTube also implemented ads on paused videos and increased the maximum length of YouTube Shorts from 60 seconds to 3 minutes.
YouTube company statistics
In November 2005, YouTube raised $5.5 million in a Series A funding round led by Sequoia Capital1.
In April 2006, the company raised an additional $8 million in a Series B round also led by Sequoia Capital.
In October 2006, YouTube was acquired by Google for $1.65 billion2.
YouTube retained its brand and all 67 employees including co-owners Chad Hurley and Steven Chen.
As of January 2024, YouTube had 7,173 employees3.
That’s up from just under 70 employees back in 2006.
Estimates placed YouTube’s net worth at a whopping $455 billion as of July 20244.
That’s over 50% above Netflix Inc’s market cap and more than Disney and Comcast’s combined valuations.
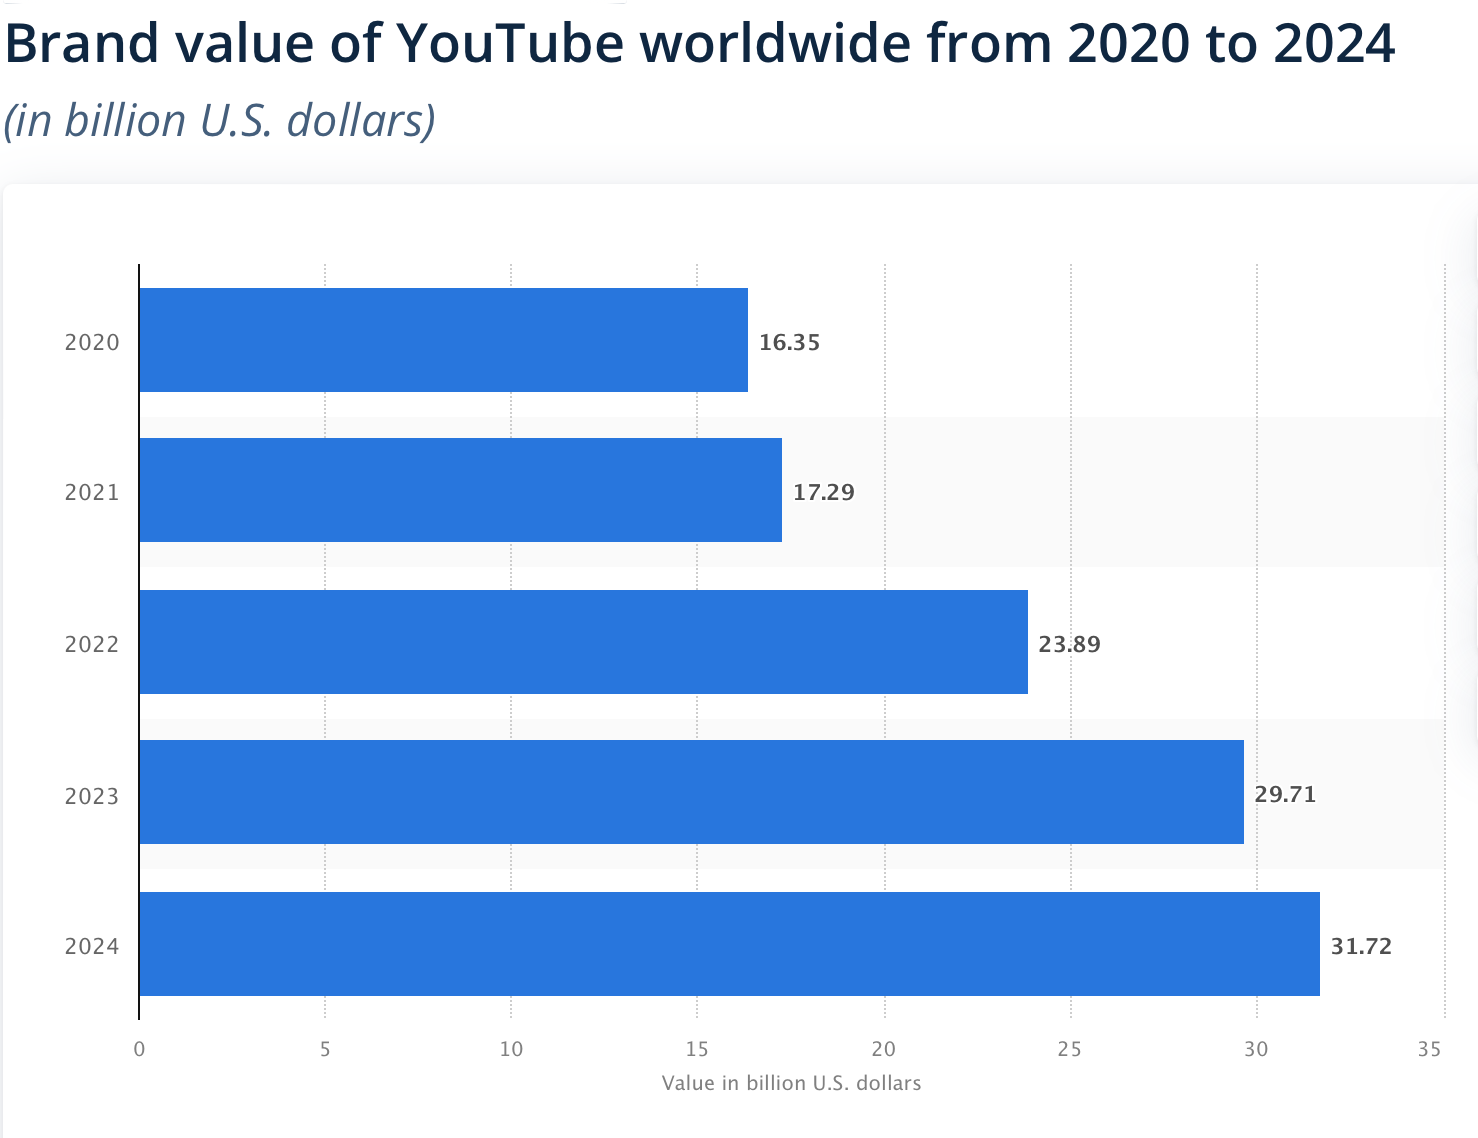
As of 2024, YouTube’s brand value was $31.7 billion, making it one of the most valuable media brands worldwide5.
Over the last four years, YouTube’s brand value has increased by 93% from $16.4 billion in 2020. YouTube’s brand value has also consistently trended upward, going from $17.3 billion in 2021 and $23.8 billion in 2022 to $29.7 billion in 2023.
Among streamers, YouTube had a 25% market share6.
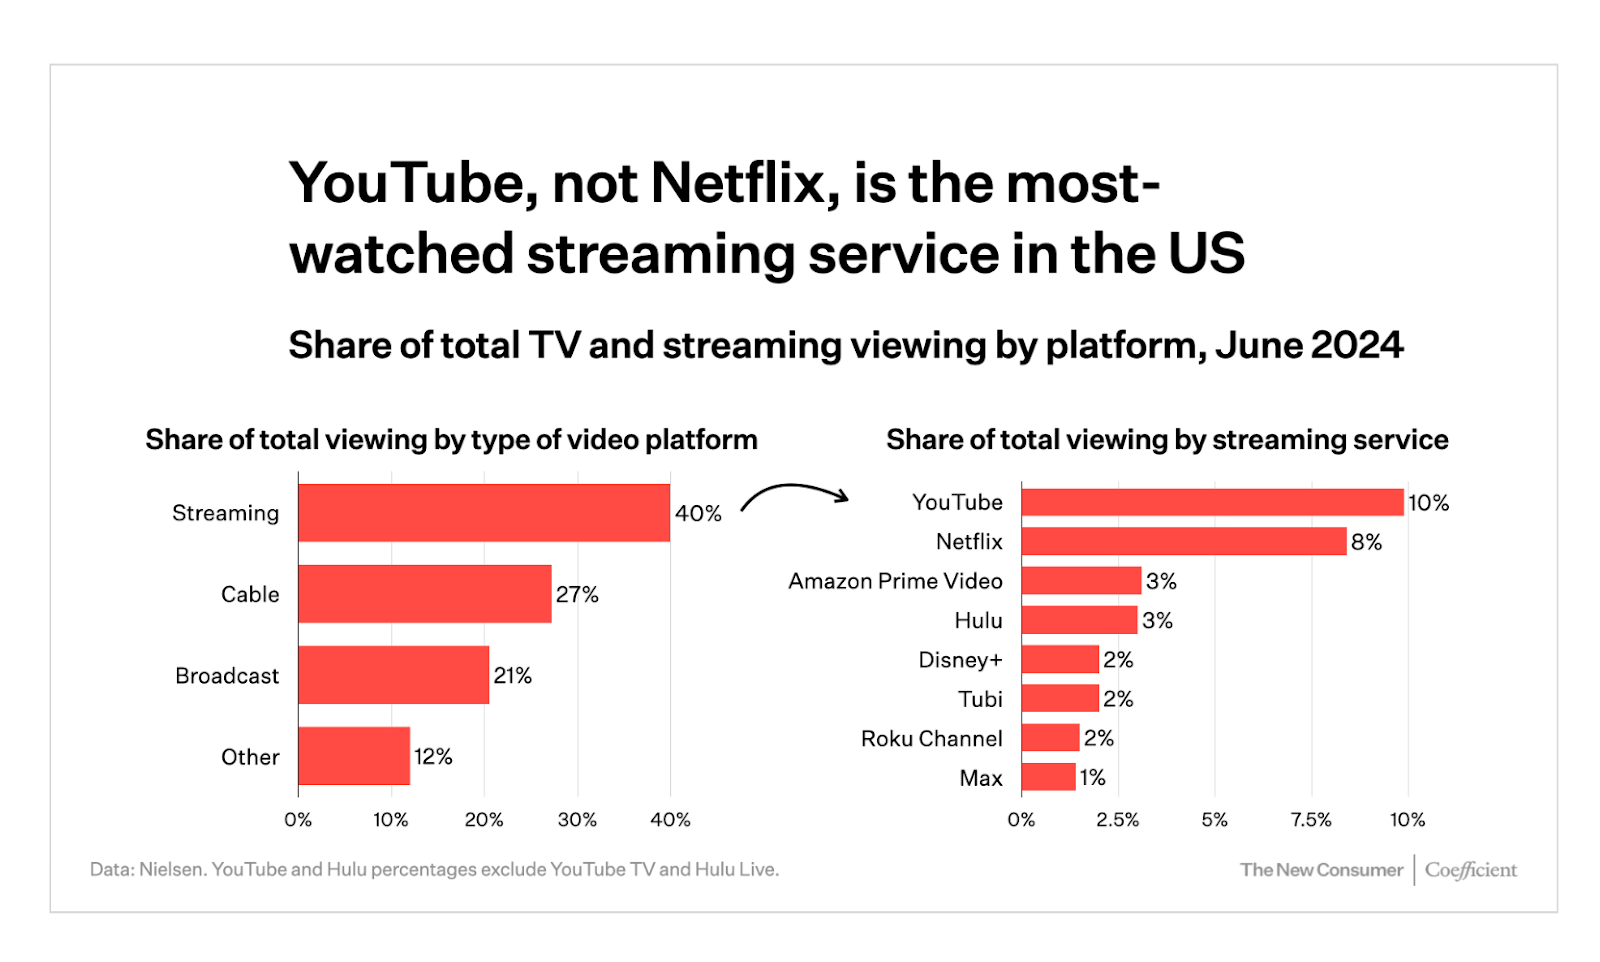
In the US alone, YouTube made up 10% of all viewership on connected and traditional TVs, the largest share of TV for a streaming platform. Netflix ranked second with an 8% share of viewership.
YouTube had an American Customer Satisfaction Index (ACSI) score of 77% in 2024, slightly down from 78% in 20237.
This placed YouTube in second place behind TikTok which had an ACSI score of 78%.
In 2022, YouTube’s creative ecosystem contributed over $35 billion to the US GDP8.
It also supported over 390,000 full-time equivalent (FTE) jobs in the US.
YouTube growth statistics
When YouTube officially launched in December 2005, it had just over 2 million monthly active users.
By August 2006, YouTube had 20 million monthly active users9.
In 2008, YouTube had 160 million users, up 700% from 2006.
This marked the biggest jump in users in YouTube’s history.
By 2013, YouTube announced it had 1 billion monthly active users10.
This increased by 50% to 1.5 billion in 2016.
In 2019, YouTube’s monthly active users crossed the 2 billion mark.
By 2022, this has increased a further 25% to over 2.5 billion, making YouTube the world’s second most popular social platform behind Facebook.
As of October 2024, YouTube had more than 2.7 billion users.
That’s a whopping 13,400% increase from 20 million users in 2006.
In 2018, YouTube officially launched YouTube Music and YouTube Premium, replacing YouTube Red —a subscription service first introduced in 2015.
YouTube had over 30 million paying subscribers by 2020. By 2022, the number of paying subscribers had more than doubled to 80 million.
In 2024, YouTube announced that it had surpassed 100 million paying subscribers.
That’s a significant 233% increase from 30 million users in 2020.
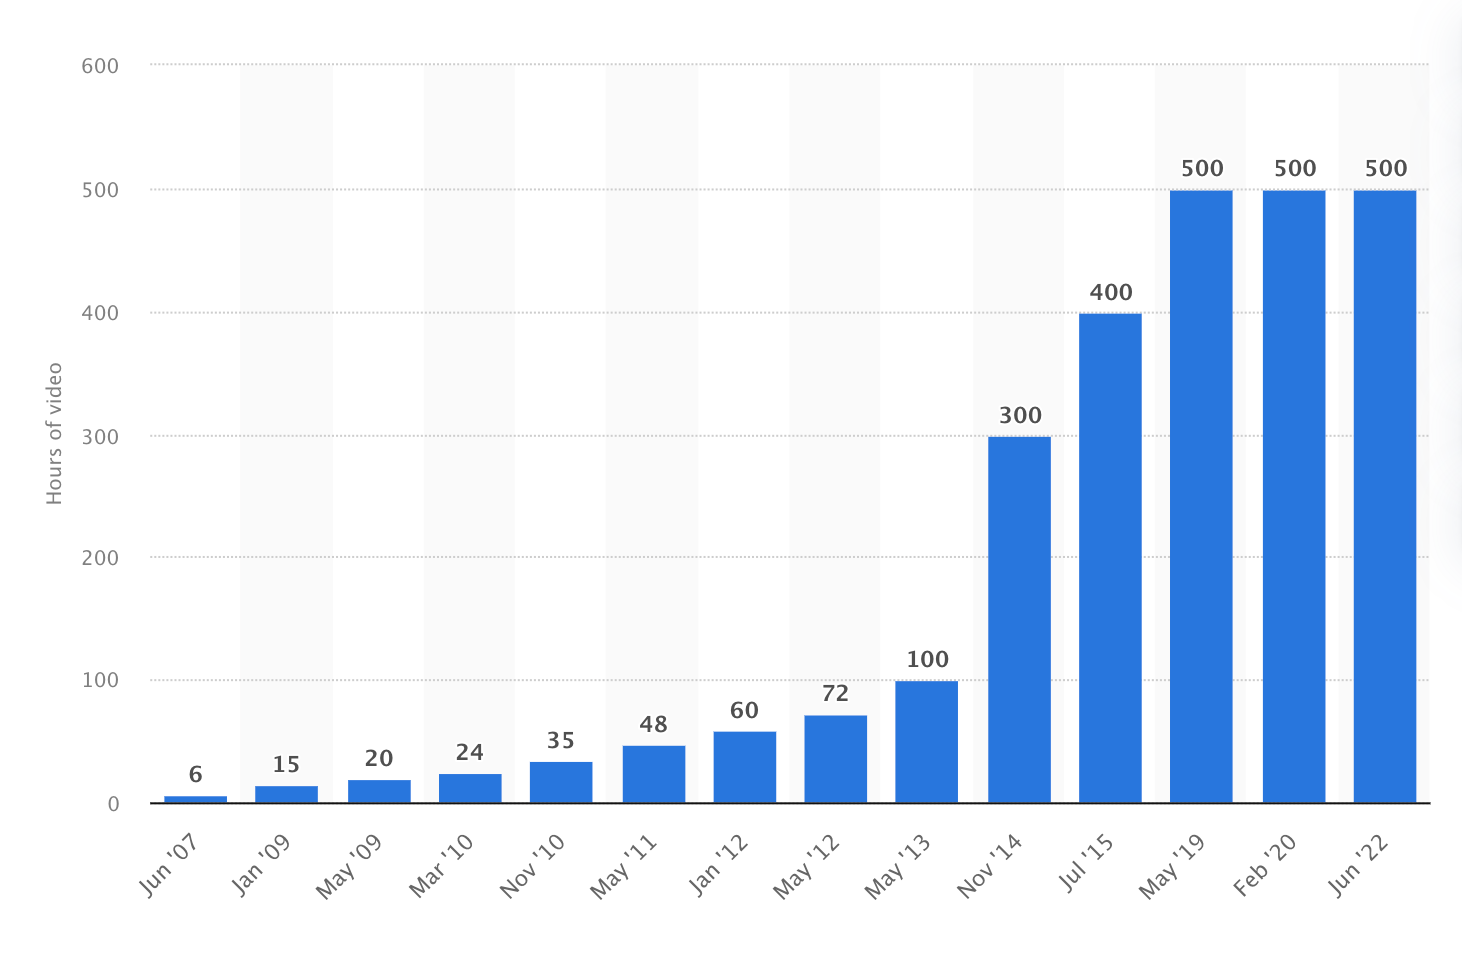
As of 2024, over 500 hours of video were uploaded to YouTube every minute.
This is a notable 8,233% increase from 2007 when 6 hours of video were uploaded per minute. Over the years, the growth in video uploads has trended upward as follows:
- 15 hours per minute in 2009
- 48 hours per minute in 2011
- 72 hours per minute in 2012
- 300 hours per minute in 2014
- 400 hours per minute in 2019
- 500 hours per minute in 2022
YouTube revenue statistics
YouTube generated $8.92 billion in ad revenue in Q3, up 12% year over year11.
Additionally, compared to Q3 2024, ad revenue increased by 11% from $8 billion in Q1 2024.
YouTube’s total ads and subscription revenue also surpassed $50 billion for the first time.
This averaged out to more than $12.5 billion in revenue per quarter since Q3 2023.
YouTube generated $31.5 billion through ad revenue in 202313.
This was up $2.3 billion from $29.2 billion in 2022.
YouTube ad revenue trended upward between 2017 and 202214, increasing from:
- $8.2 billion in 2017
- $11.2 billion in 2018
- $15.2 billion in 2019
- $19.7 billion in 2020
- $28.8 billion in 2021
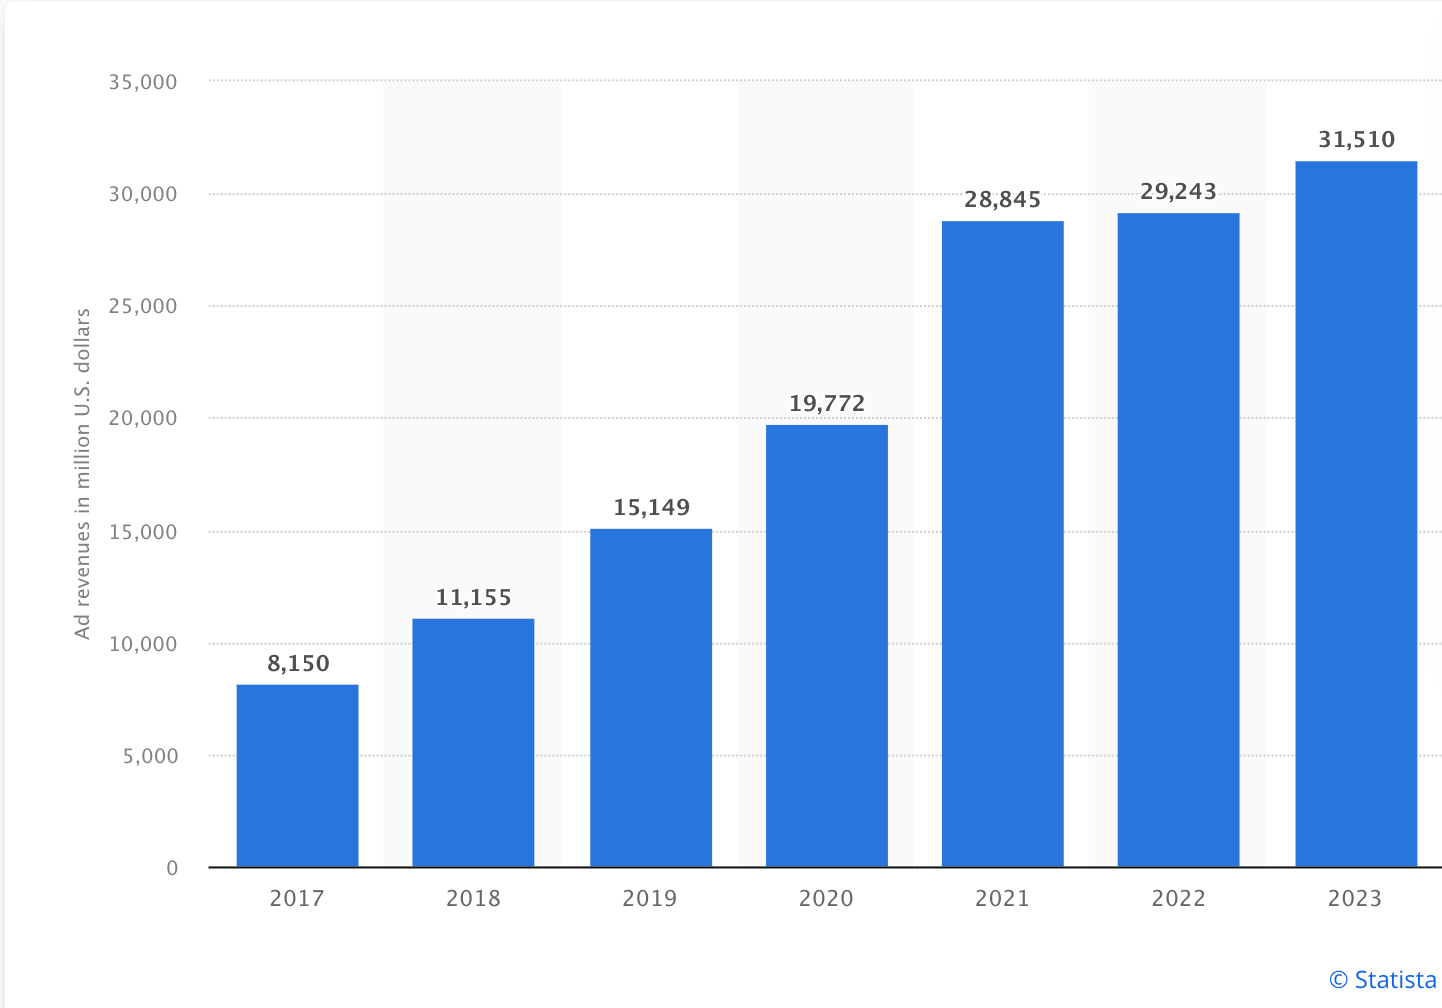
Overall, between 2010 and 2023, YouTube’s annual advertising revenue increased by 3,838% from $0.8 billion to $31.5 billion.
Spurred by a surge in online video engagement during the pandemic, YouTube experienced the biggest revenue jump ($9.1 billion or 46%) between 2020 and 2021.
Historically, the US has generated the most ad revenue for YouTube15.
The country’s contribution to YouTube’s total ad revenue has remained within the 45%-50% range.
This trend is evident in the yearly breakdown below:
- 47% in 2020
- 46% in 2021
- 48% in 2022
- 47% in 2023
After the US, the EMEA (Europe, Middle East, and Africa) region has been the second-largest contributor to YouTube’s ad revenue, maintaining a share in the 29%-31% range over the same period16.
- 30% in 2020
- 31% in 2021
- 29% in 2022
- 30% in 2023
In January 2024 alone, the US accounted for most of YouTube’s in-app purchases, generating $29 million, followed by Japan at $19 million.
In 2021, YouTube generated $1.2 billion in-app revenue globally, with $567 million generated in the US.
YouTube user statistics
As of July 2024, YouTube had over 2.5 billion monthly active users, making it the second most popular social media platform in the world.
YouTube was just behind Facebook which had over 3 billion monthly active users and ahead of WhatsApp and Instagram which had 2 billion monthly active users each.
In terms of gender demographics, YouTube had a slightly higher male presence at 54% in 2024.
The platform’s share of female users was 46%.
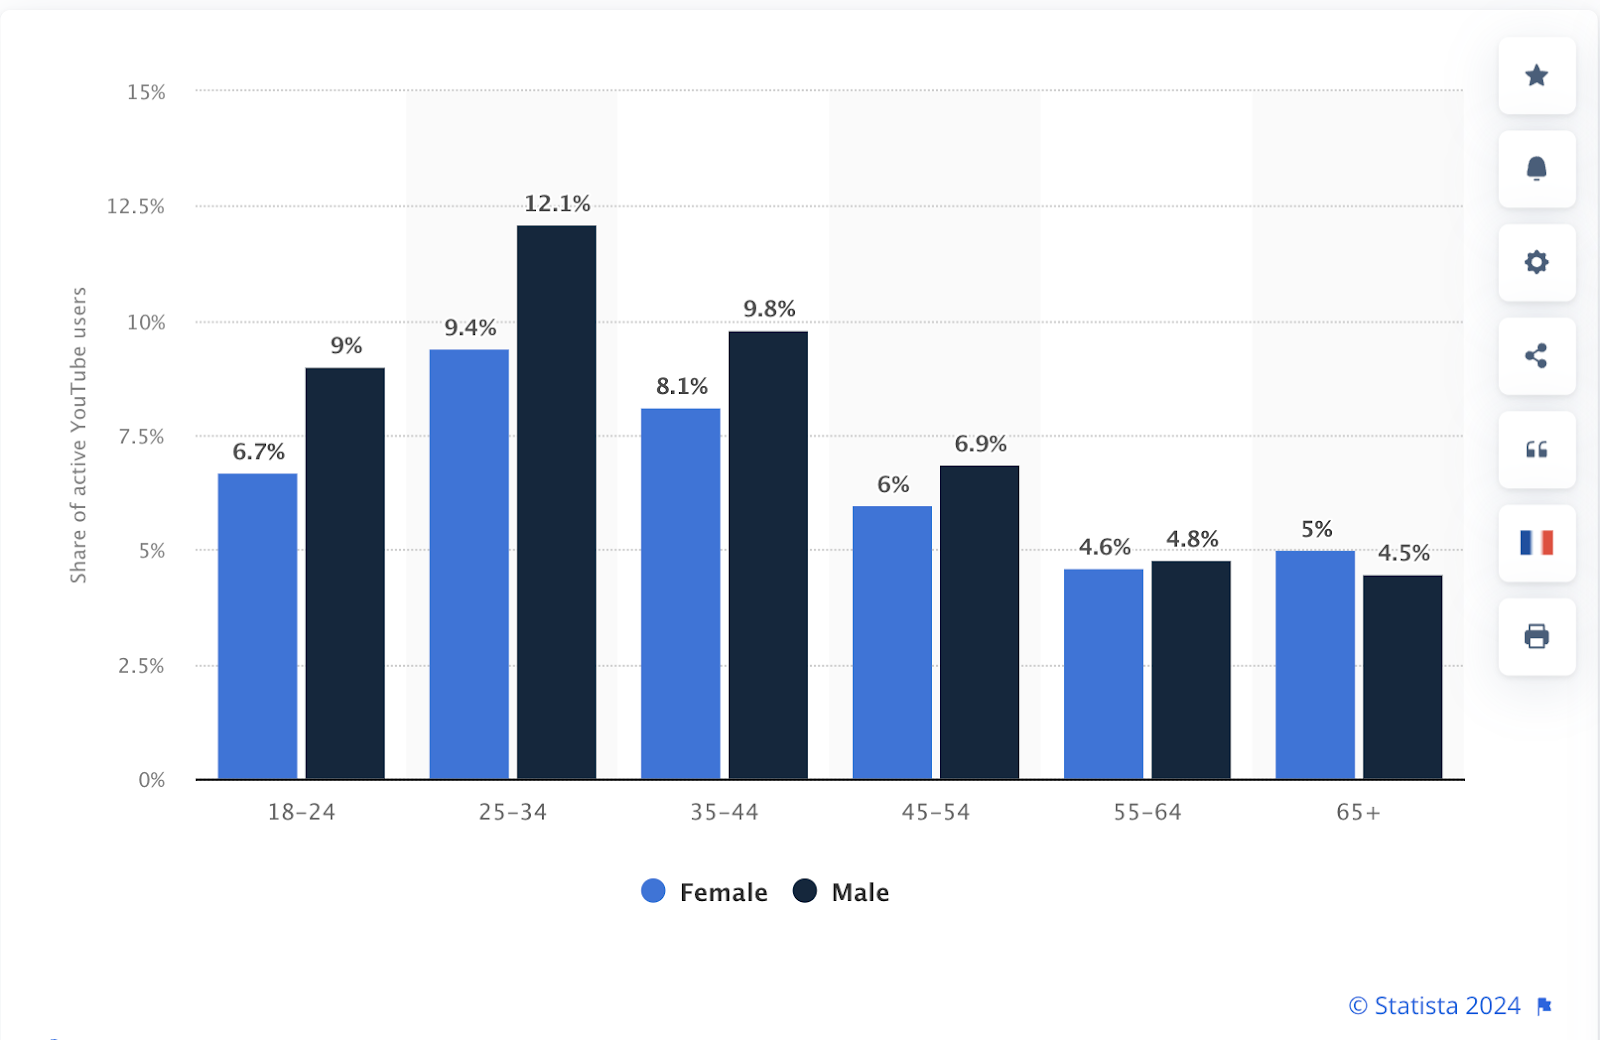
Breaking down YouTube’s user demographics by age and gender:
- 15.7% were between the ages of 18 to 24, split into 9% male and 6.7% female users.
- 21.5% were between the ages of 25 to 34, split into 12.1% male and 9.4% female users.
- 17.9% were between the ages of 35 to 44, split into 9.8% male and 8.1% female users.
- 12.9% were between the ages of 45 to 54, split into 6.9% male and 6.0% female users.
- 9.4% were between the ages of 55 to 64, split into 4.8% male and 4.6% female users.
- 9.5% were over 65, split into 4.5% male and 5.0% female users..
As of July 2024, YouTube had a global penetration rate of 38%.
The UAE was the country with the highest YouTube penetration rate at 94.1%. Israel ranked second with a reach of 93.2%, followed by the UK with a reach of 90.4%
The country with the highest number of YouTube users was India, with 476 million people making use of the platform.
In second place was the US with 238 million, followed by Brazil with 147 million users. Other countries with notable user counts included:
- Indonesia with 139 million users
- Mexico with 84.2 million users
- Japan with 79.4 million users
In 2024, 90% of YouTube subscribers came from less than 5% of channels17.
Additionally, 550,000 YouTube channels had at least 100,000 subscribers, while around 60,000 channels had at least 1 million subscribers.
YouTube engagement statistics
Between March and May 2024:
- YouTube had the highest number of monthly active users, ahead of Chrome Browser and Google.
- In terms of total time spent, YouTube took the lead, ahead of Facebook and WhatsApp.
- When it came to consumer spend, YouTube was second, just behind TikTok.
With 32 billion total average monthly visits, YouTube was the second most visited website in the world between April and June 2024.
This was behind Google.com which had 84 billion total average monthly visits. YouTube also had an average of 1.9 billion unique visitors. Visitors spent an average of 20 minutes and 9 seconds per visit and visited an average of 12 pages per visit.
As of July 2024, YouTube was the second most searched term on Google.
This was only behind the term “Google” and ahead of the term “Weather.”
In a ranking of the mobile apps with the most significant quarterly (March 2024 to May 2024) growth in terms of total time spent, YouTube ranked third.
This was just behind TikTok and JioCinema.
Between March and May 2024, YouTube was the most popular social media app among smartphone users, scoring a perfect 100 on Data Reportal’s engagement index.
Close contenders included WhatsApp with a score of 85, as well as Facebook with a score of 83.
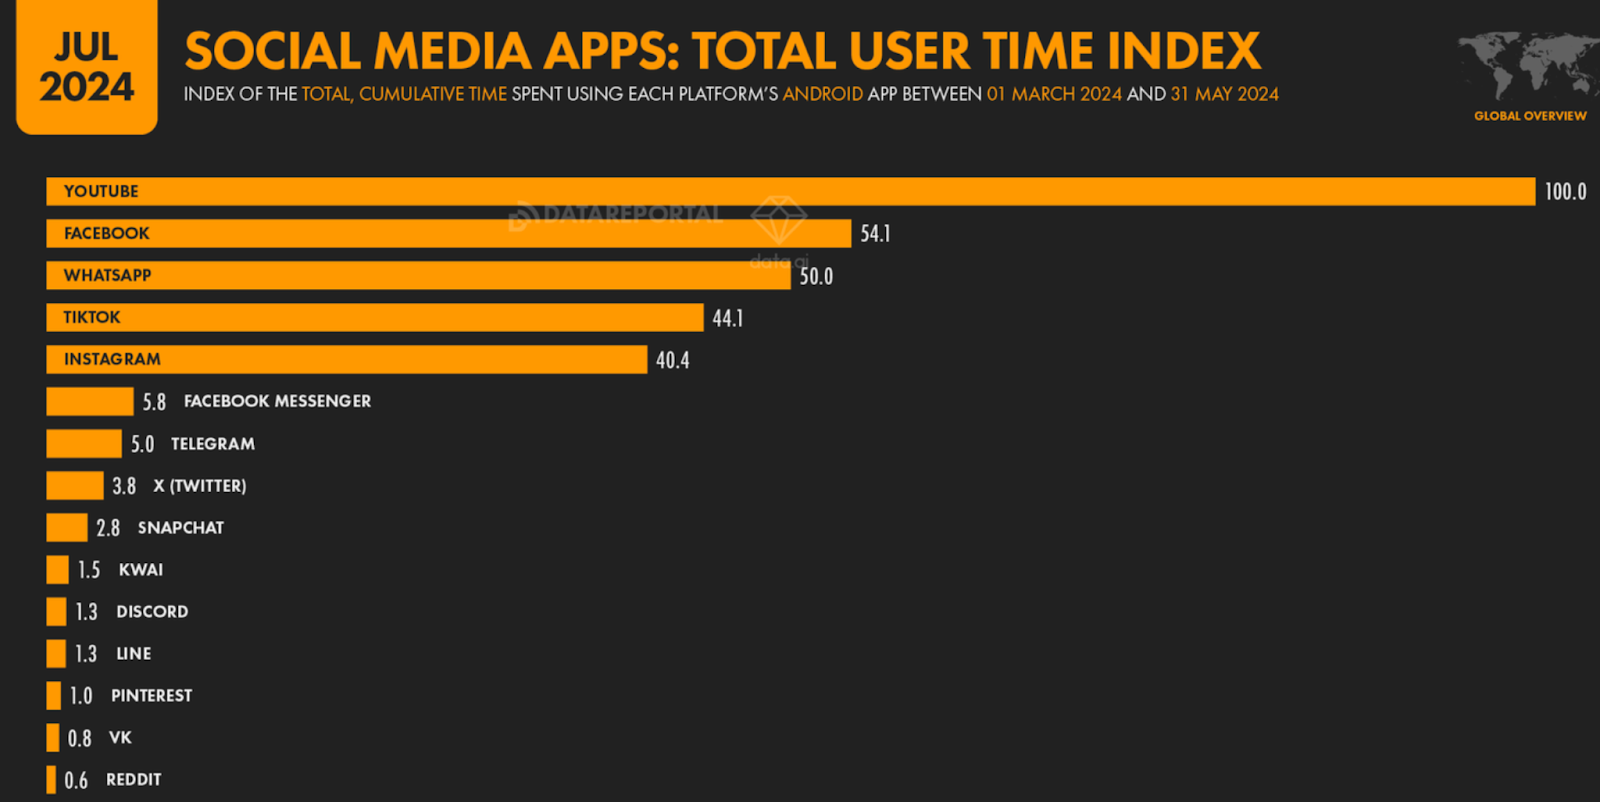
YouTube was also the app mobile users spent the most time on. Again, the app scored 100 on Data Reportal's total user time index.
YouTube beat Facebook, WhatsApp, and TikTok which scored 54, 50, and 44 on the index, respectively.
Active YouTube users spent an average of 28 hours and 41 minutes on average per month on the app between March and May 2024.
This placed YouTube just behind TikTok, where active users spent an average of 31 hours and 43 minutes on the app per month.
Compared to:
- Facebook (18 hours and 45 minutes), YouTube users were 53% more engaged.
- Instagram (16 hours and 56 minutes), YouTube users were 69% more engaged.
- WhatsApp(16 hours and 32 minutes),YouTube users were 74% more engaged.
As of July 2024, YouTube had a 64% daily open rate, this was just behind Whatsapp’s daily open rate of 83%.
YouTube had a daily open rate higher than:
- Facebook - 63%
- Instagram - 62%
- Line - 61.3%
- TikTok - 61%
The average YouTube user opened the app an average of 222 times per month.
This placed YouTube in 6th place behind WhatsApp (912 times), Instagram (348 times), Line (327 times) and TikTok (311 times).
While YouTube lagged based on the number of monthly sessions, it took the top spot in terms of average session duration. YouTube users spent an average of 7 minutes and 46 seconds on the app each time they opened it.
This was just ahead of TikTok and Facebook where the average session duration was around 6 minutes and 4 minutes, respectively.
In the first six months of 2024, over 70% of YouTube users accessed the platform via their mobile devices18.
Meanwhile, 30% accessed the platform via desktops.
At 15.3%, the US drove the most traffic to YouTube’s website. This was followed by South Korea at 8.7%
67% of traffic from the US was from mobile while 33% was from desktop. In South Korea, mobile traffic took the lead with over 90% of users accessing the platform via their mobile devices.
YouTube usage statistics
The top two reasons for using YouTube were to relax and to feel entertained19.
As such, the top four content categories watched by YouTube users were comedy, music, entertainment/pop culture, and “how to”.
76% of YouTube users agree that YouTube provides diverse content and perspectives.
72% say they value the diversity of content and perspectives they find on YouTube.
75% of adults watched YouTube at home on their mobile devices.
Additionally, 70% of YouTube users defaulted to horizontal viewing when watching videos on their phones.
YouTube mobile users were 2x likely to pay attention while watching YouTube versus watching TV.
On mobile alone, YouTube reached more adults 18 and older during prime time than any other cable network.
31% of Americans preferred YouTube over any other streaming service, up from 27% in 202220.
This was highest among Gen Z users at 35%, followed by Millenials and Gen X at 33%. Even Boomers showed a preference for YouTube with 27% selecting it over Netflix.
26% of users said YouTube was more relaxing and entertaining than TV, streaming, and movies.
Notably, this sentiment was highest among Gen Z with 42% citing YouTube as more entertaining and 39% selecting it as more relaxing to watch.
39% of YouTube users felt YouTube was more relatable.
In particular, this was also highest among Gen Z, with 56% saying YouTube was more relatable.
In 2024, 33% of viewers said YouTube was more influential than traditional TV, streaming, or movies.
Again, this was highest among Gen Z at 47%.
Compared to Netflix, YouTube made users feel 2x smarter.
YouTube also made them feel more amused (45%), culturally aware (26%) and globally aware (25%).
92% of YouTube users reported using YouTube to gather information and knowledge.
The same percentage reported learning how to fix practical problems on YouTube.
Viewers selected YouTube video content as the most engaging in 2024.
In particular, 45% of users ranked short videos under 5 minutes as the most engaging format. Conversely, 21% said long videos were more engaging while 11% said live streams.
As of July 2024, the YouTube channel with the highest number of subscribers was Mr Beast, with 305 million subscribers and 35 billion channel views.
In second place was T-Series with 270 million subscribers and 261.4 billion channel views. This was followed by Cocomelon with 179 million subscribers and 184.8 billion channel views.
YouTube advertising statistics
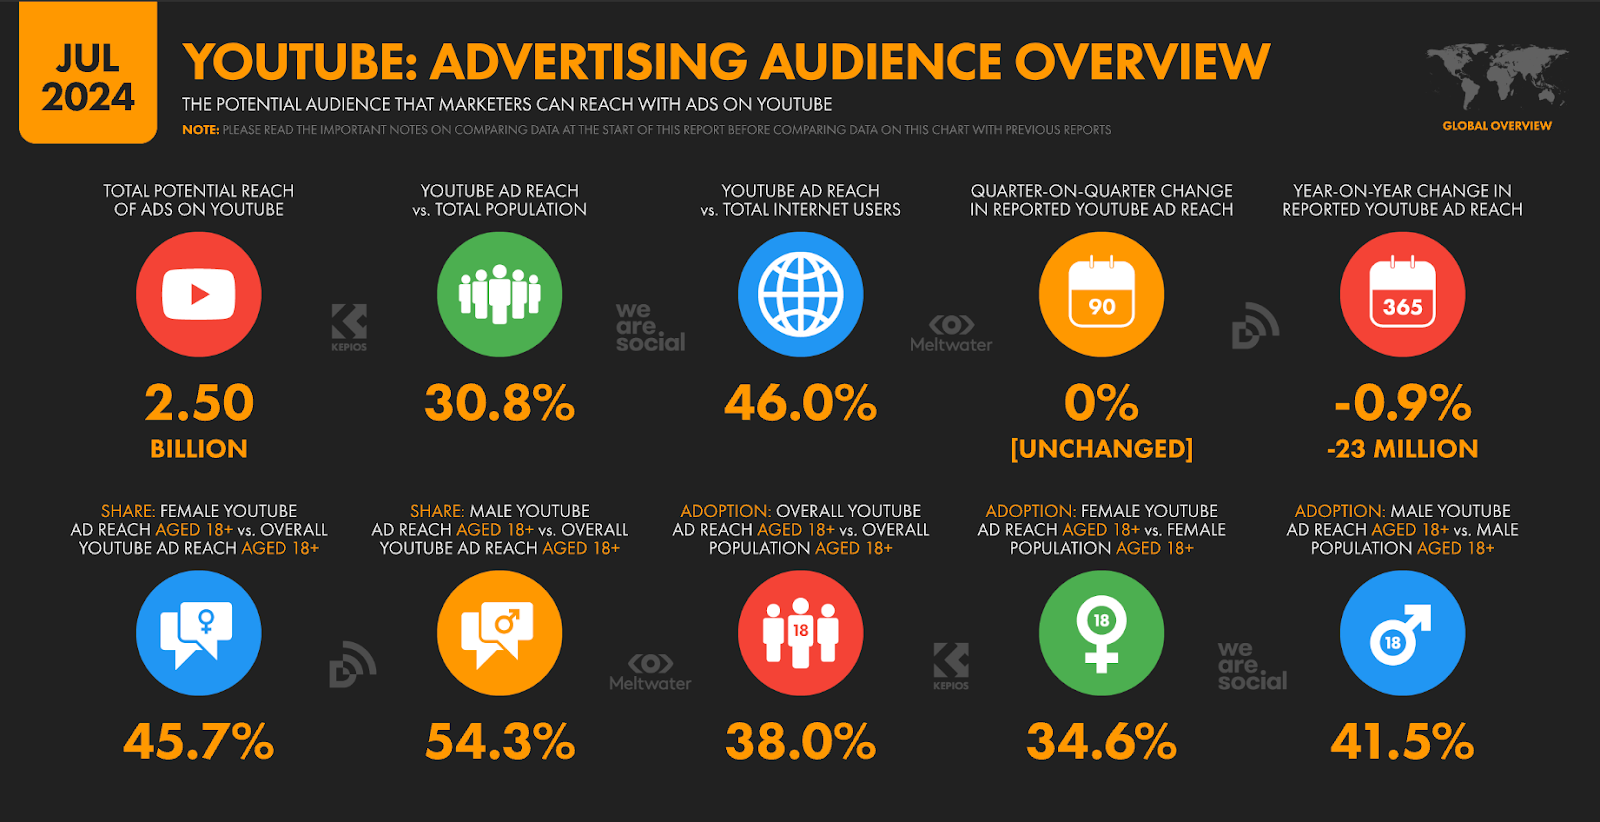
As of July 2024, YouTube had a total potential ad reach of over 2.5 billion and 2.17 billion amongst users aged 18 or older.
This placed YouTube in the top spot ahead of Facebook (2.24 billion), Instagram (1.68 billion) and TikTok (1.6 billion).
YouTube’s total ad reach was 31% of the world’s population and 46% of total internet users.
Additionally as of July 2024:
- YouTube’s advertising reached 54% of male and 46% of female internet users.
- YouTube had an overall reach rate of 42% among male and 35% among female internet users.
- There was a 0.9% drop in YouTube ad reach year-over-year.
Countries where YouTube ads reached the greatest share of the population aged 18 and above were:
- Bahrain with a reach vs population rate of 102%
- Lebanon with a reach vs population rate of 100%
- Oman with a reach vs population rate of 99%
- Qatar with a reach vs population rate of 96%
As of July 2024, only 1.1% of YouTube users were unique to the platform. A majority of YouTube users also used other popular social platforms.
In terms of audience overlaps, 77% of YouTube users were also active on Instagram, while 76% were also active on Facebook.
Additionally:
- 71% were also WhatsApp users
- 49% were also TikTok users
- 49% were also Telegram users
- 40% were also Twitter (X) users
- 37% were also Pinterest users
- 31% were also LinkedIn users
- 30% were also Snapchat users
- 16% were also Reddit users
- 15% were also Discord users
YouTube accounted for 10% of social media-driven web traffic in 2024, placing it in third place in terms of referrals to external websites.
This was behind leader Facebook which drove 63% of social media web traffic and Instagram which drove 11%.
As of 2024, YouTube’s CPM or cost per 1,000 ad views across selected categories was:
- $0.09 for Shorts21
- $1.36 for the Music
- $1.82 for Entertainment, Pets and Animals
- $4.55 for Gaming
- $6.36 for People & Blogs/ How To /Style
- $9.09 for Education
- $14.55-$36.36 for Digital Marketing/ Finance
59% of YouTube users said that YouTube ads were more relevant than ads on linear TV or other streaming apps22.
Across generations, more consumers preferred YouTube ads over traditional ads, particularly:
- 49% of Gen Z
- 43% of Millennials
- 32% of Gen X
Boomers were the exception, with 24% saying they preferred traditional TV ads.
YouTube marketing statistics
In 2024, 52% of marketers made use of paid ads on YouTube23.
Meanwhile, 48% did not.
In 2024, Marketers held varied perceptions of YouTube’s ROI: 32% of marketers didn’t have a YouTube marketing budget while 21% allocated over 51% of their marketing budget to YouTube.
14% of marketers allocated 1-5% of their budgets to YouTube.
Additionally:
- 11% allocated 6-10% of their budgets
- 6% allocated 11-20% of their budgets
- 6% allocated 31-40% of their budgets
- 6% allocated 41-50% of their budgets
- 5% allocated 21-30% of their budgets
Highlighting YouTube’s reach and engagement capabilities, 65% of marketers planned to increase their YouTube marketing budgets in the next year.
18% of marketers planned to maintain their budgets and 7% were uncertain. On the other hand, 10% planned to decrease their investment.
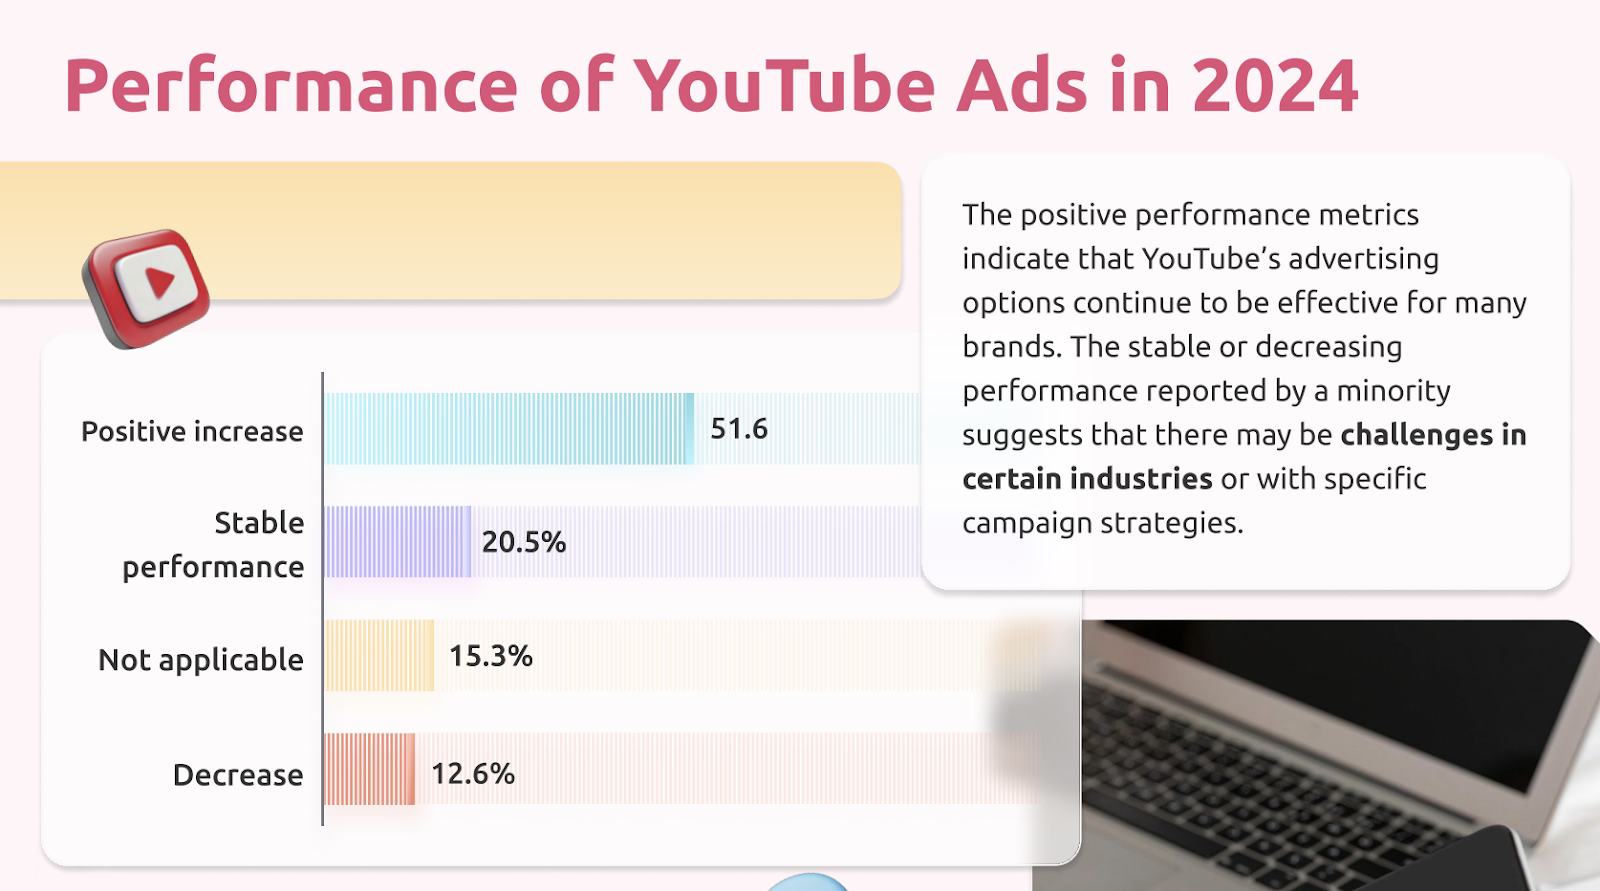
52% of Marketers noted a positive increase in the performance of their YouTube ads in 2024.
21% reported stable performance meanwhile, 13% noted a decrease.
52% of marketers stated that their primary goal with YouTube was top-of-funnel (brand awareness).
27% stated that their primary goal was bottom of funnel (conversions) while 22% planned to take the balanced approach.
51% of marketers measured the success of their YouTube marketing campaigns through engagement rates.
This was followed by conversion rates at 16%, brand awareness at 13% and return on investment (ROI) at 5%. Meanwhile, 15% of marketers used other metrics to measure the success of their campaigns.
At 26%, influencer marketing was the most common type of marketing strategy used on YouTube.
This was followed by:
- Organic content marketing at 25%
- Paid advertising at 14%
- Sponsored content and collaborations at 10%
- Product Placements at 7%
- Affiliate marketing at 4%
Additionally, when asked about the effectiveness of influencer marketing on YouTube, 53% of marketers rated it as somewhat to very effective.
Around 20% rated it as somewhat to very ineffective.
64% of marketers made use of multi-format campaigns on YouTube.
Multi-format campaigns involve the combined use of long-form videos, Shorts, and live streams. Around 36% of marketers stuck to one format.
Of those who used multi-format campaigns, a key challenge among 42% of marketers was integrating cohesive messaging.
This was followed by effective budget allocation (26%) and measuring performance across formats.
Since 2023, YouTube has taken measures against ad blockers, positively impacting performance metrics like ROI and impressions. In fact, 45% of marketers saw a noticeable improvement in performance.
Meanwhile, 24% saw some improvement in the effectiveness of their campaigns.
38% saw improvement in their ROI due to anti-ad blocker measures.
Other improvements included:
- Impressions at 37%
- Click-through rates at 15%
- Engagement rates at 10%
83% of small businesses with a YouTube channel agreed that the platform played a role in growing their customer base and reaching new audiences.
78% stated that the platform was essential to their business growth. A further 83% stated that having a YouTube channel helped them develop a following.
YouTube shorts statistics
In 2024, YouTube Shorts averaged over 70 billion daily views24.
This is up 40% from 50 billion daily views in 2023 and 133% from 30 billion in 202225.
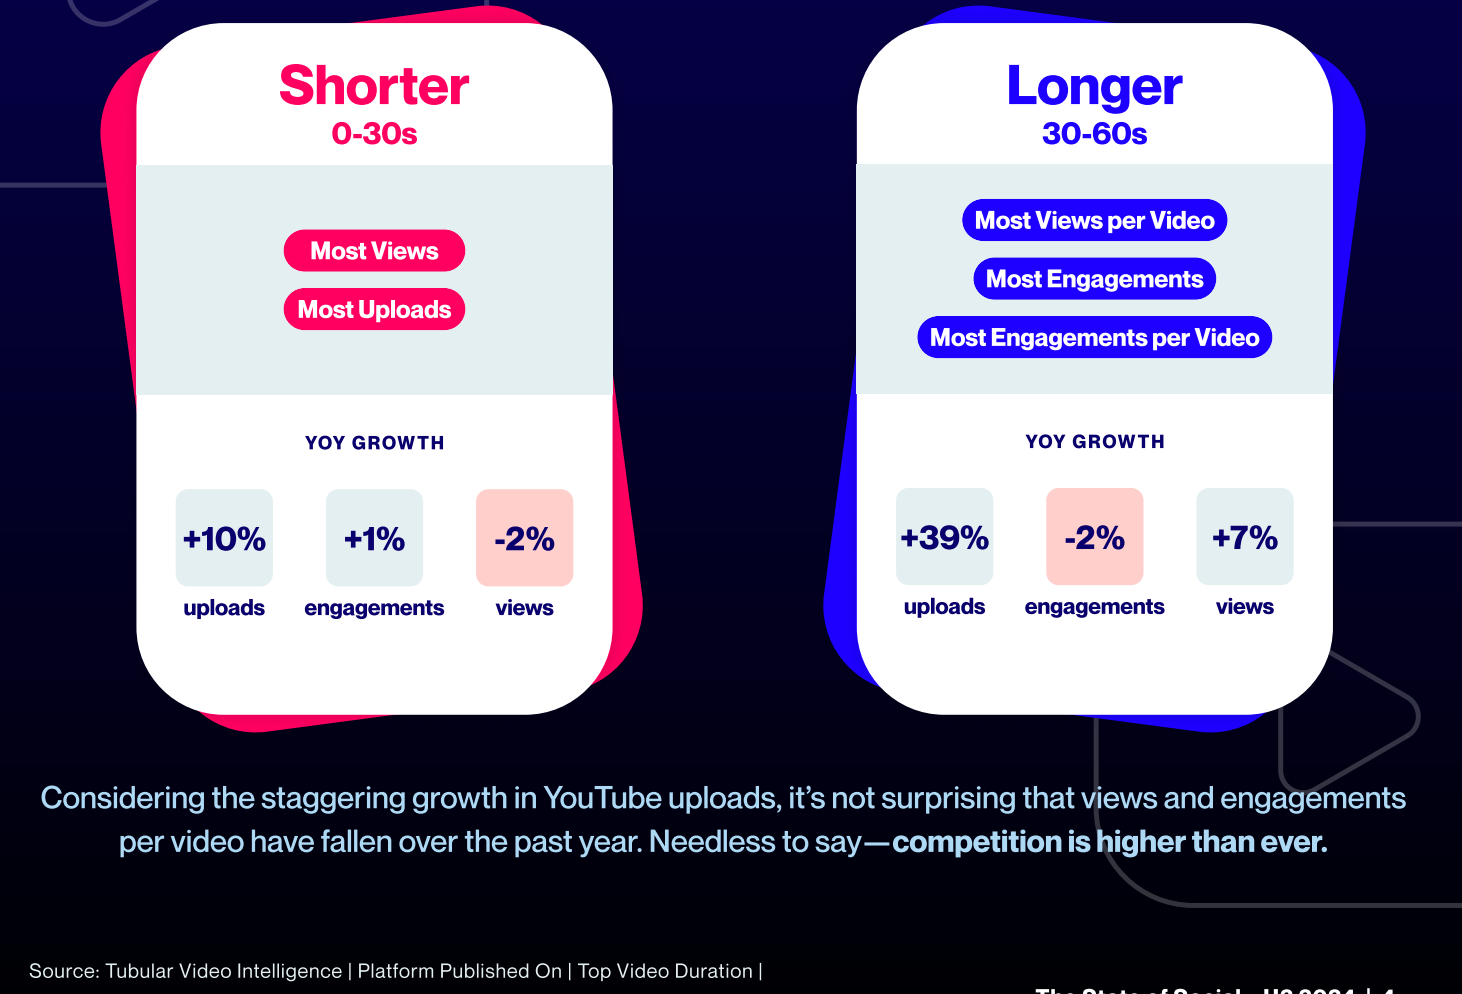
In the first half of 2024 (H1 2024), 30-60s second Shorts experienced a 39% increase in uploads26.
Meanwhile, 0-30 second Shorts experienced a 10% increase in uploads.
Shorter (0-30s) Shorts saw a 1% increase in engagements over the same period.
However, 30-60s Shorts saw a 2% drop in engagement levels.
Longer (30-60s) Shorts saw a 7% uptick in views over H1 2024.
On the other hand, shorter formats (0-30s) saw a 2% drop in views.
The primary goal for using YouTube shorts was to increase brand visibility (46%).
This was followed by targeting a specific demographic (24%), concise format promotion (17%), and driving traffic to longer content (14%).
YouTube ecommerce statistics
68% of YouTube users watched YouTube to help them make a purchase decision.
As of 2024, YouTube users watched over 30 billion hours of shopping-related videos. YouTube also saw a 25% increase in watch time for videos that help people shop on YouTube27.
39% of consumers were more likely to make purchases directly on YouTube28.
At 68%, Gen Z consumers were even more likely to shop on YouTube.
51% of consumers prepared a new food or beverage because of a YouTube video.
In addition:
- 41% learned something interesting
- 40% discovered a new musical artist or group
- 35% purchased something
- 35% repaired or assembled something
- 26% discovered a new brand
- 25% started a new routine or habit
86% of consumers used YouTube at least once a week to consume creator content29.
This was just behind Instagram (69%), Facebook(68%) and TikTok (57%). A further 85% of consumers interacted with brands they discovered on YouTube.
92% of consumers used YouTube to find product information.
Additionally, 34% ranked YouTube as their first choice for product reviews and information.
43% of marketers in 2024 stated that YouTube’s shopping collections feature significantly boosted their sales.
A further 23% said that it improved visibility and conversion rates, while 21% noted no major impact on their sales strategy.
38% of marketers considered YouTube's shopping collections feature as a highly effective and major sales channel.
Meanwhile:
- 21% considered it moderately effective, and able to complement other strategies
- 17% considered it slightly effective
- 8% said it was not effective
YouTube creator statistics
Excluding social platforms, YouTube generated 50% of the revenue in the broader creator economy in 2024.
In addition to ad revenue, there were 9 other monetization levels content creators could pursue. This included:
- Premium
- Super Chat
- Super Stickers
- Super Thanks
- Memberships
- Merchandise
- Ticketing
- Brand Connect
As of 2024, YouTube had close to 100 million creators.
In 2022, YouTube paid out $16 billion to content creators via its YouTube Partner Program.
On average, content creators received 55% of the revenue generated on their channels in 202430.
YouTube collected around 45% of creator revenue. After paying platform fees, the global average revenue per creator amounted to about $150 per year. Depending on the niche and other factors, creators in the US topped the revenue chart with around $0.018 per view or $18 for every 1000 views.
Content Creators in the US made the most money with a Revenue Per Mile (RPM) of around $12.03 as of 30 October 202431.
In second place was Australia with $9.87 RPM and in third place was Switzerland with $9.65 RPM.
This was followed by:
- Norway at $8.17
- New Zealand at $7.42
- Canada at $7.14
- Denmark at $7.13
- UK at $6.88
- Germany at $6.58
- Netherlands at $6.35
The category with the highest RPM for creators was Digital Marketing and Finance at $8 to $20.
Education came in next at $5 RPM. People & Blogs /How To & Style followed with a $3.50 RPM.
Other profitable categories included:
- Gaming at $2.50
- Entertainment/Pets & Animals at $1
- Music at $0.75
Typical Shorts had an RPM of $0.05.
83% of creators who earned money from YouTube in 2022 agreed that the platform provided an opportunity to create content and earn money that they wouldn’t get from traditional media.
69% also stated that YouTube was an important source of income for them.
Make money with YouTube and Whop

YouTube is a great way to share your content, but the route to native monetization on YouTube can be a difficult one. As a creator you have to reach subscriber and viewer thresholds before you can start earning from your videos.
There is another way - enter Whop.
Whop is a social commerce platform with which you can monetize any digital product or service, including videos. Simply create your own whop (online hub) in just a few minutes and start directing your viewers to your whop. With your whop you can create a paid community, sell online courses, sell ebooks, digital downloads, host private livestreams, and more. Use YouTube to share your content and Whop to monetize it.
FAQs
How much does YouTube pay per 1000 views?
On average, YouTube pays anywhere between $0.01 to $0.03 per view. This equates to around $10-$30 per 1000 views.
Which age group uses YouTube the most?
The 25 to 34 age group uses YouTube the most.
What percentage of YouTubers are successful?
Around 10% of YouTubers are successful.
Sources
References
- Infrastructure Investor
- NBC News
- NY Times
- Bloomberg
- Statista
- CNBC
- Statista
- Oxford Economics
- USA Today
- Reuters
- Yahoo
- Variety
- Alphabet
- Alphabet
- Alphabet
- Data Reportal
- Citifirst
- Semrush
- NewConsumer
- IsThisChannelMonetized
- ROIrevolution
- Influencer Marketing Hub
- YouTube
- Business Insider
- Tubular
- Techcrunch
- Modern Retail
- CMS Wire
- Influencer Marketing Hub
- IsThis Channel Monetized


