Discover all you need to know about digital products with this comprehensive report featuring over 100+ digital product statistics for 2026.
Key takeaways
- Digital products now represent a $2.5 trillion industry, creating massive opportunities for creators and entrepreneurs.
- Video games dominate digital spending at 50%, while streaming services lead in consumer adoption at 32%.
- Digital product transactions surged 70% between 2022-2024, signaling accelerating consumer demand across all categories.
The demand for digital products is growing at an unprecedented rate and commanding a greater share of consumer spending each year.
One thing is certain: opportunity abounds in this multi-billion-dollar industry.
Whether you’re looking to cash in or simply curious at heart, we’ve gathered all there is to know about digital products.
Keep reading as we unpack 100+ digital product statistics, including the most popular digital product categories, key buyer characteristics, and more.
Digital products statistics highlights
- As of 2025, digital products created more than $2.5 trillion in value per year.
- 68% of internet users aged 16+ paid for any kind of digital content each month in 2025.
- Internet users spent over $560 billion on digital media such as videos, epublishing, digital music, and video games in 2024.
Digital products statistics
Digital products are intangible goods and services such as ebooks, apps, and streaming services delivered over the internet.
According to a study of digital products across multiple countries, digital products created more than $2.5 trillion in value per year1.
This was roughly equivalent to nearly 6% of the countries’ combined GDP.
According to Mastercard, the volume of digital product transactions increased by almost 70% between 2022 and 20242.
The growth of the digital products industry is due to factors such as:
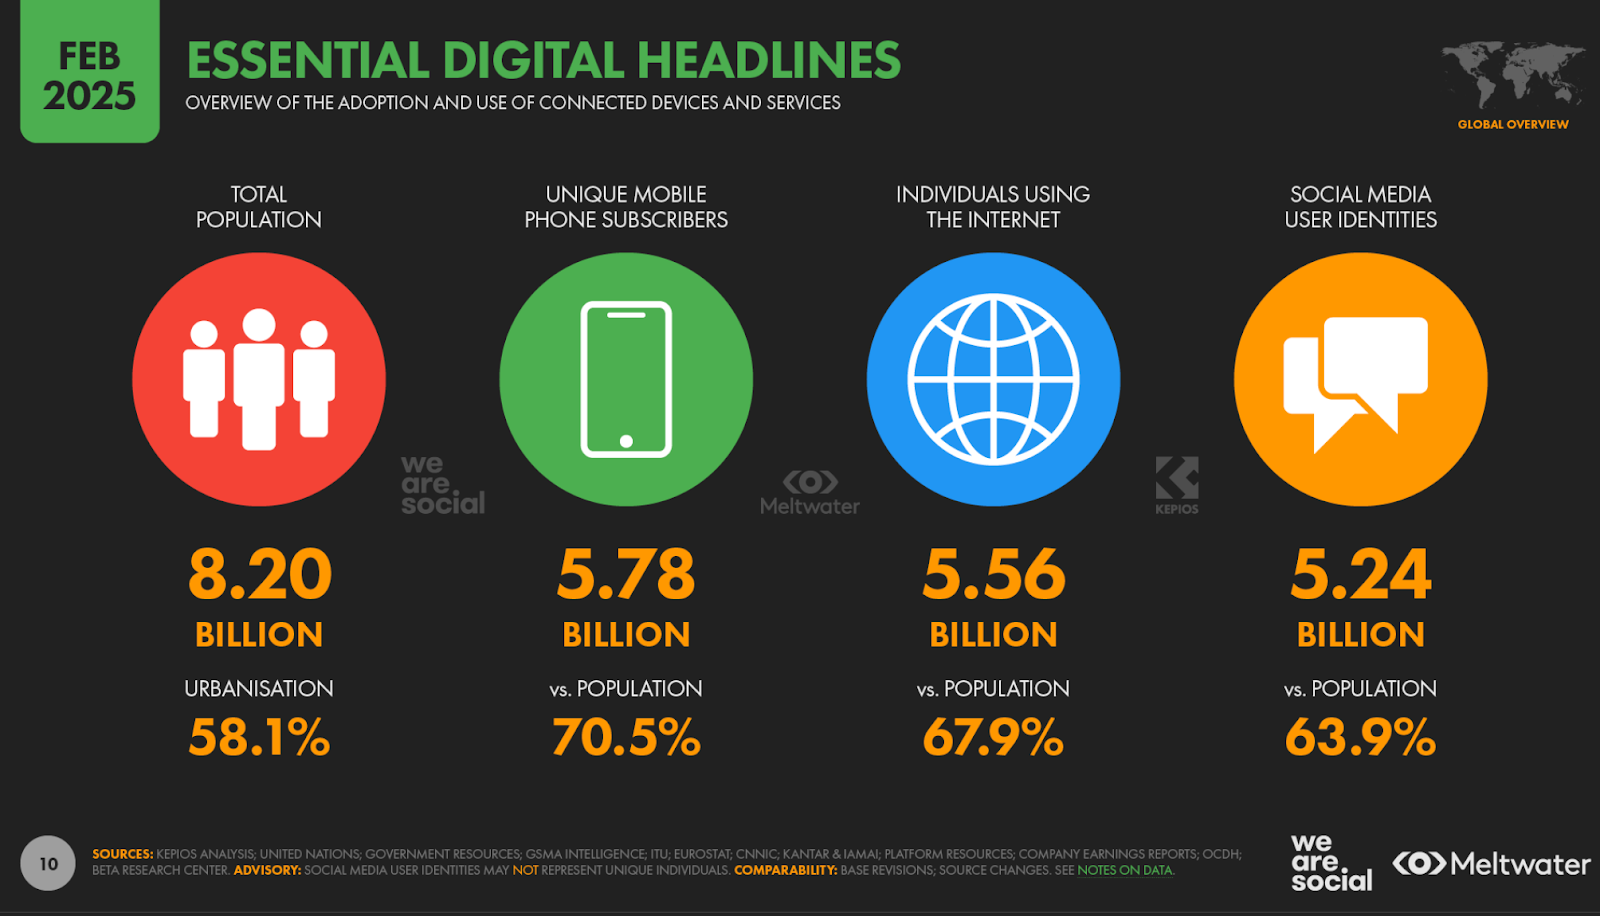
- Internet adoption - 68% of the global population was on the internet in 20253.
- Mobile device adoption - 71% of the global population owned a mobile device in 2025.
- Social media use - 64% of the global population was active on social media in 2025.
Globally, internet users spent over $560 billion on digital media in 2024, up 12.5% year-over-year.
Video games accounted for over $282 billion, or 50% of this spending, while:
- Video on demand accounted for 33% or $182 billion
- epublishing accounted for 10% or $55 billion
- Digital music accounted for 7% or $41 billion
The average internet user spent $189 per year on digital media, up 7.1% from 2023.
At $215 per year, spending per internet user was highest on video games . This was followed by video on demand at $61.50, epublishing at $37.49, and digital music at $29.34.
As of 2025, an average of 68% of internet users aged 16+ paid for any kind of digital content each month.
This is up from around 67% in 2024.
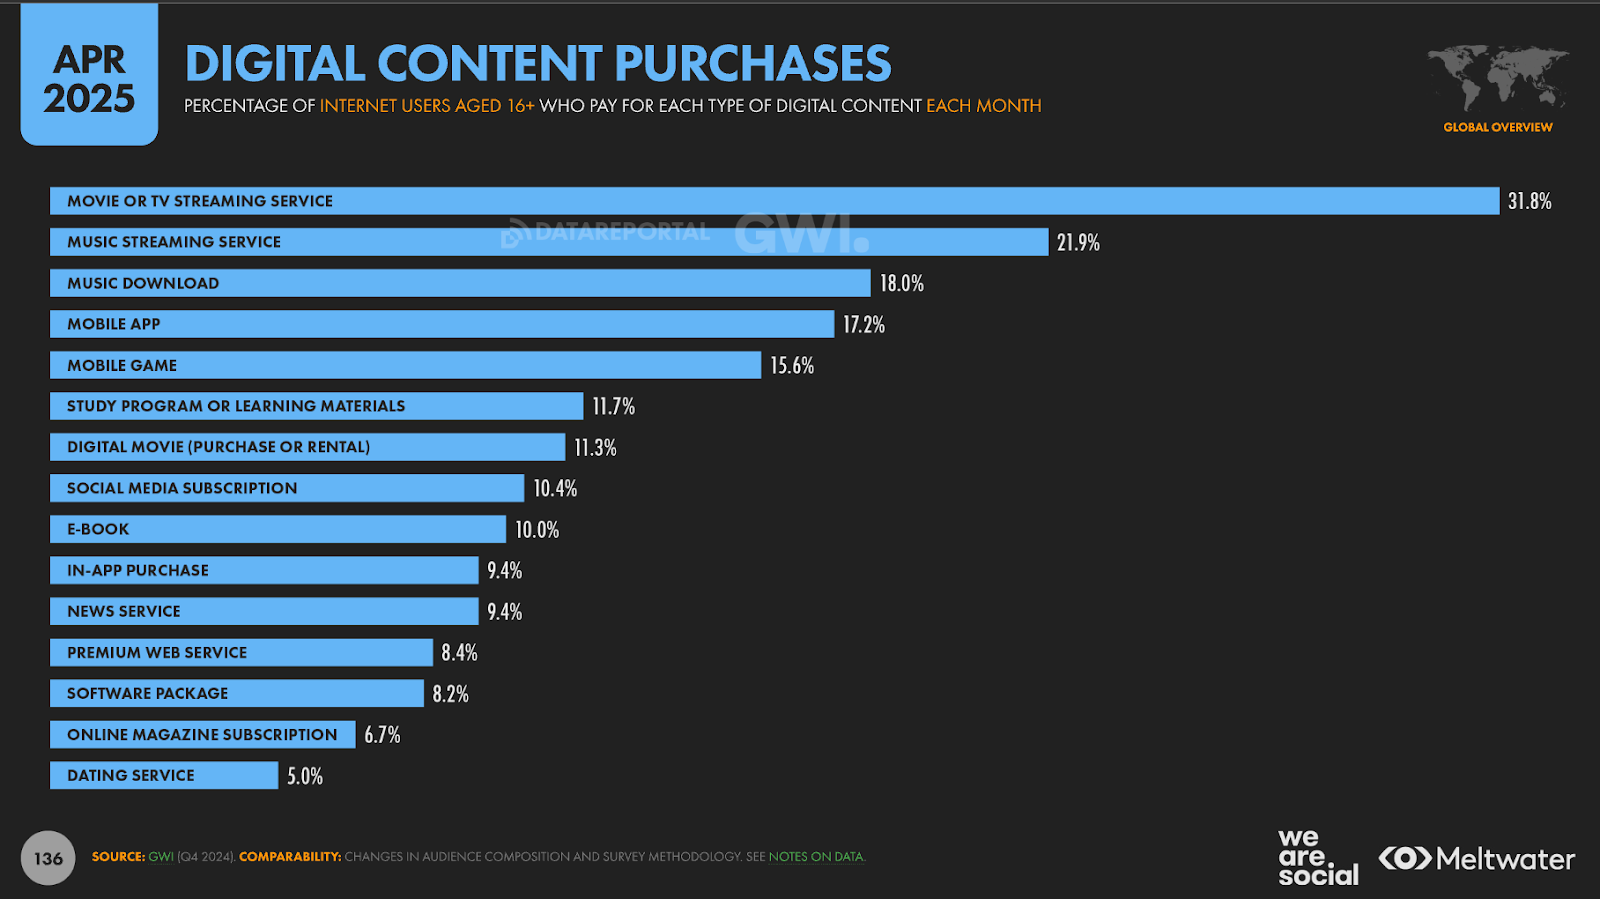
At 32%, streaming services were the most popular type of digital content that internet users paid for in 2025.
This was followed by
- Music streaming - 23%
- Music downloads -18%
- Mobile apps - 17%
- Mobile games - 16%
- E-Learning - 11%
- Digital movies - 11%
- eBooks - 10%
According to McKinsey, global spending on digital goods was expected to exceed $135 billion by 20244.
Global spending on virtual goods surpassed $110 billion in 2021, more than double the total spend in 20155.
Daily active users of digital products surged by 54% between January 2020 and August 20216.
This is up from usage rates of 19% in April 2019. In 2020 alone, 2 billion consumers purchased digital products.
Ebooks
The ebooks market generated $14.9 billion in 2025, an increase of 2.1% from 20247.
In terms of revenue, the US took the lead, generating over $5.4 billion in 2025.
Additionally, the market will grow at a CAGR of 1.2%, leading to an estimated market volume of close to $16 billion by 2030.
In addition, the number of ebook readers will surpass 1.1 billion, displaying a global adoption rate of 13.7%, up from 13.3% in 2024.
As of December 2023, Statista reported that the most popular platform for selling ebooks was Amazon, with close to 70% of respondents in the US, UK, and Germany buying e-books there8.
The Apple ebooks store was used by 18% of US ebook readers, while less than 15% of global ebook readers bought ebooks directly from a publisher’s website.
Music streaming
By 2030, the music streaming market is projected to grow at a CAGR of 4.8% to exceed $44.8 billion9.
The music streaming market was worth around $35 billion in 2025, up 6% from 2024. Additionally, the US accounted for most of this revenue, bringing in close to $14 billion.
The global adoption of music streaming is expected to hit 14.7% by 2030, up from 13.3% in 2025.
The number of global users in the music streaming industry will reach 1.2 billion users in 2030, up from over 713 million users in 202510.
Subscription audio streams generated over 51% of the global music industry’s revenue in 202411.
Streaming platforms alone accounted for 69% of the industry’s total revenue.
Audiobooks
Revenue in the audiobook market exceeded $9.8 billion in 2025, up 24% from $7.4 billion in 202412.
Globally, revenue is expected to grow at a CAGR of 6.2%, leading to an estimated market volume of $13.3 billion in 2030.
In addition, the US led revenue generation, accounting for over $4.26 billion of global audiobook revenue in 2025.
Further, revenue in the US is expected to grow at a CAGR of 10.55% between 2024 and 2029, resulting in a market volume of $5.63 billion.
The number of audiobook readers is expected to hit 1.8 billion by 2030.
The global adoption rate is also expected to increase to 22%. Meanwhile, the average revenue per user is expected to be $6.20 that year.
In the US alone, 51% of consumers listened to an audiobook in 202413.
The use of audiobooks was driven by an increase in piracy. A survey also found that 35% of audiobook listeners had listened to an audiobook on YouTube, up from 27% in 2023.
The number of non-listeners who were interested in listening to an audiobook increased to 38% from 32% in 2023.
While the consumption and number of AI-narrated audiobooks have increased, consumer willingness to try AI-narrated audiobooks fell from 77% in 2023 to 70% in 2025.
Podcasts
As of June 22, 2025, there were over 4.58 million podcasts globally according to the Podcast Index14.
346,321 shows were published in the last 30 days, and 427,027 in the last 60.
The number of podcast listeners is expected to surpass 600 million in 202615.
That's up nearly 24% from 485 million consumers worldwide in 2020.
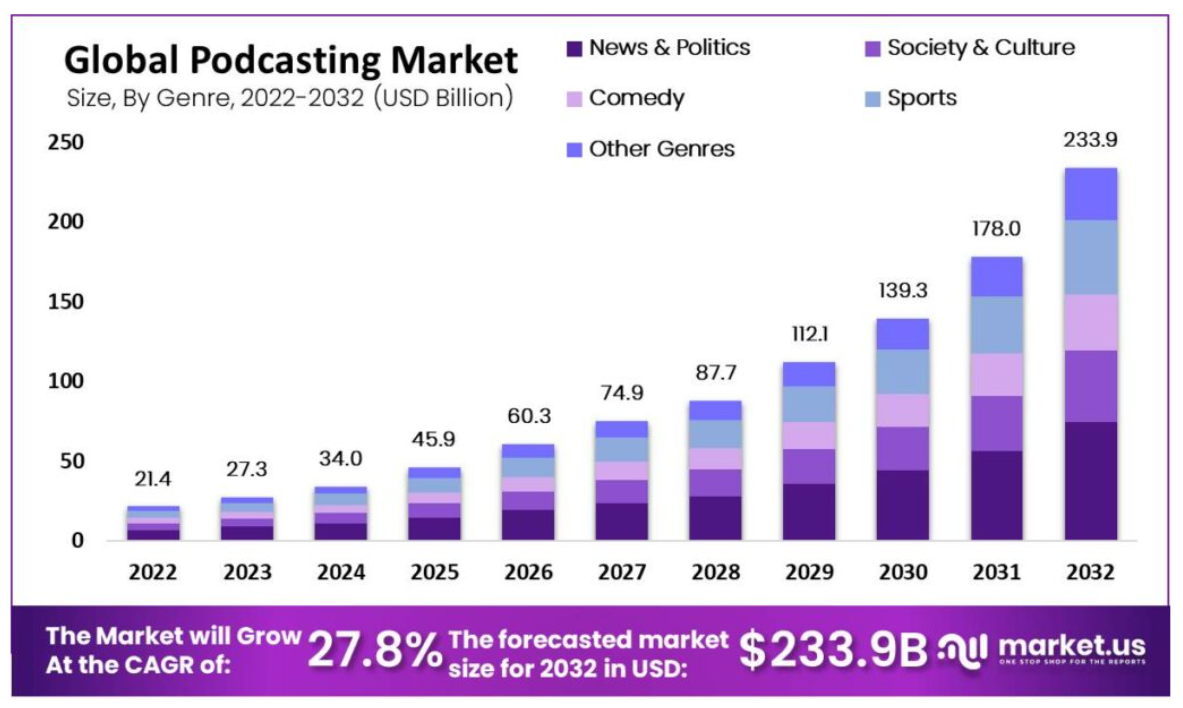
In 2025, the global podcasting market was worth over $45.9 billion, up 35% from $34 billion in 202416.
Driven by the growth of podcasting platforms and smartphone use, the market is estimated to grow at a CAGR of 27.8% to nearly $234 billion by 2032.
According to a 2024 report, of the 35% of consumers accessing podcasts, 13% accessed a show related to news and current affairs in 202417.
The same report found that podcast users were:
- More likely to be men than women (39% vs 32%).
- Younger, with over 55% aged 18-34.
- Better educated, with over 47% holding a degree.
- More likely to be higher than lower income earners (44% vs 29%).
Within the podcasting market, the News and Politics segment was the most popular, accounting for close to 32% of total market share18.
Interviews dominated the industry with a market share of nearly 31% and a CAGR of 27.8%. Additionally, solo podcasts were the fastest-growing segment, with a market share of around 26% and a CAGR of 28.2%.
Video streaming
The global video streaming market exceeded $119 billion in 202519.
This represents a revenue growth rate of 9.8% from $108 billion in 2024.
In 2025, the US generated over $47.9 billion in video streaming revenue, emerging as the market leader.
The US market was dominated by Netflix, which has a large range of original content and a large global subscriber base.
The average revenue per user in the video streaming market was $78.97 in 2025, up from $76.58 in 2024.
In addition, the global rate of adoption was 19.3% in 2025 and is expected to reach 21.1% by 2030.
According to projections, the video streaming market will experience a CAGR of 6.7% between 2025 and 2030, resulting in a market volume of over $164 billion by 2030.
This will be driven by the growth in video streaming users, who will exceed 1.8 billion by 2030.
In 2024, audiences in the US alone spent over 12 trillion minutes streaming, which is about 8.4 billion days or 23 million years20.
This represents a 10% increase from the 21 million years they streamed in 2023.
Video streaming audiences had access to over 90 different streaming platforms at the end of 2023, up from 51 in 202021.
Together, these platforms offered audiences just under 1 million unique titles and existing favorites to choose from.
Online learning
The online learning market was worth over $217 billion in 2023 and is projected to be worth $842 billion by 203022.
Growing at a CAGR of 18.6% the industry presents massive opportunities for technology providers, instructional material publishers, and more.
Meanwhile, online education was estimated to be worth $204 billion in 202523.
Additionally, in 2025:
- The most revenue was generated in the US ($100 billion).
- The average revenue per user amounted to $218.77.
- Global adoption of e-learning was around 15.9%.
By 2029, the market is expected to grow by a CAGR of 8.2% to exceed $279 billion.
The number of users is also set to hit 1.1 billion by 2029.
Revenue in the MOOC market was valued at $23.2 billion in 2023 and will grow at a CAGR of 40% to exceed $483 billion in 203224.
Between 2011 and 2021, the number of learners reached by massive open online courses (MOOCs) increased by a staggering 73,233% from 300,000 to 220 million25.
Software
The global software market generated revenue of over $742 billion in 2025, a 5.5% increase from 202426.
The US accounted for the highest revenue at $379 billion, while enterprise software led market volume at $316 billion.
By 2030, the software market is projected to exceed $902 billion.
This represents a CAGR of 3.9% between 2025 and 2030.
The global SaaS market was worth over $428 billion in 2025, up over 20% from 202427.
In the same year, the majority of revenue will be generated in the US, amounting to over $221 billion in 2025. By 2030, revenue will grow at a CAGR of 15.65% to $887.05 billion.
The Metaverse
By 2030, the metaverse is expected to surpass $507 billion28.
The number of users is expected to reach 2.6 billion users, while the average revenue per user will hit $92.
Blending physical and digital worlds, the metaverse market is expected to grow at a CAGR of 41.6% between 2023 and 203029.
Additionally, Gartner predicts that by 2026:
- 25% of people will spend at least one hour a day in the metaverse for work, shopping, education, and entertainment.
- 30% of organizations will have products and services ready for the metaverse.
A McKinsey report estimated that the potential impact of the Metaverse would be $5 trillion by 2030 and that this would vary across industries30.
For example:
- Ecommerce - $2 trillion to $2.6 trillion impact.
- Academic Virtual Learning - $180 billion to $270 billion impact.
- Advertising - $144 billion to $206 billion impact.
- Gaming - $108 billion to $125 billion impact.
The metaverse market was worth over $103 billion in 2025, up 39.2% from 2024.
With a projected market volume of over $32 billion, the US generated the most revenue in the market.
Global metaverse usage among consumers was around 17% in 2025.
By 2030, the global adoption rate is expected to increase to 40%.
According to a 2025 survey, 26% of consumers had used the metaverse in the last 12 months, and this increased to 80% among VR headset owners31.
In addition:
- 50% of consumers played free video games.
- 47% streamed online content.
- 34% connected with friends or other users in virtual spaces.
Cryptocurrencies
As of April 2025, 10% of internet users aged 16 to 64 owned cryptocurrency32.
Consumers in Turkey had the highest ownership rate at 27%, followed by Nigeria (26%) and Argentina (23%).
Meanwhile, China (3%) and Morocco (3%) had the least. Additionally, consumers aged 25 to 24 were more likely to own cryptocurrency compared to consumers aged 55 to 64.
The cryptocurrency market was worth $86 million in 2025, with the highest revenue coming from the US ($16.1 billion)33.
Revenue is expected to grow at a CAGR of 11% to over $93 billion by 2026. Total users in the crypto market are also expected to reach close to 1 billion in the same year.
Additionally:
- Global adoption was 11.8% in 2025 and is projected to hit 12.2% by 2026.
- The average revenue per user in the cryptocurrency market was $92.90 in 2025, up from $61.80 in 2024.
Global cryptocurrency app usage increased in 2024, with total session counts rising by 37% year over year34.
The fastest-growing markets for crypto apps included:
- Germany, up 91%
- Indonesia, up 54%
- Brazil and France, both up 47%
NFTs
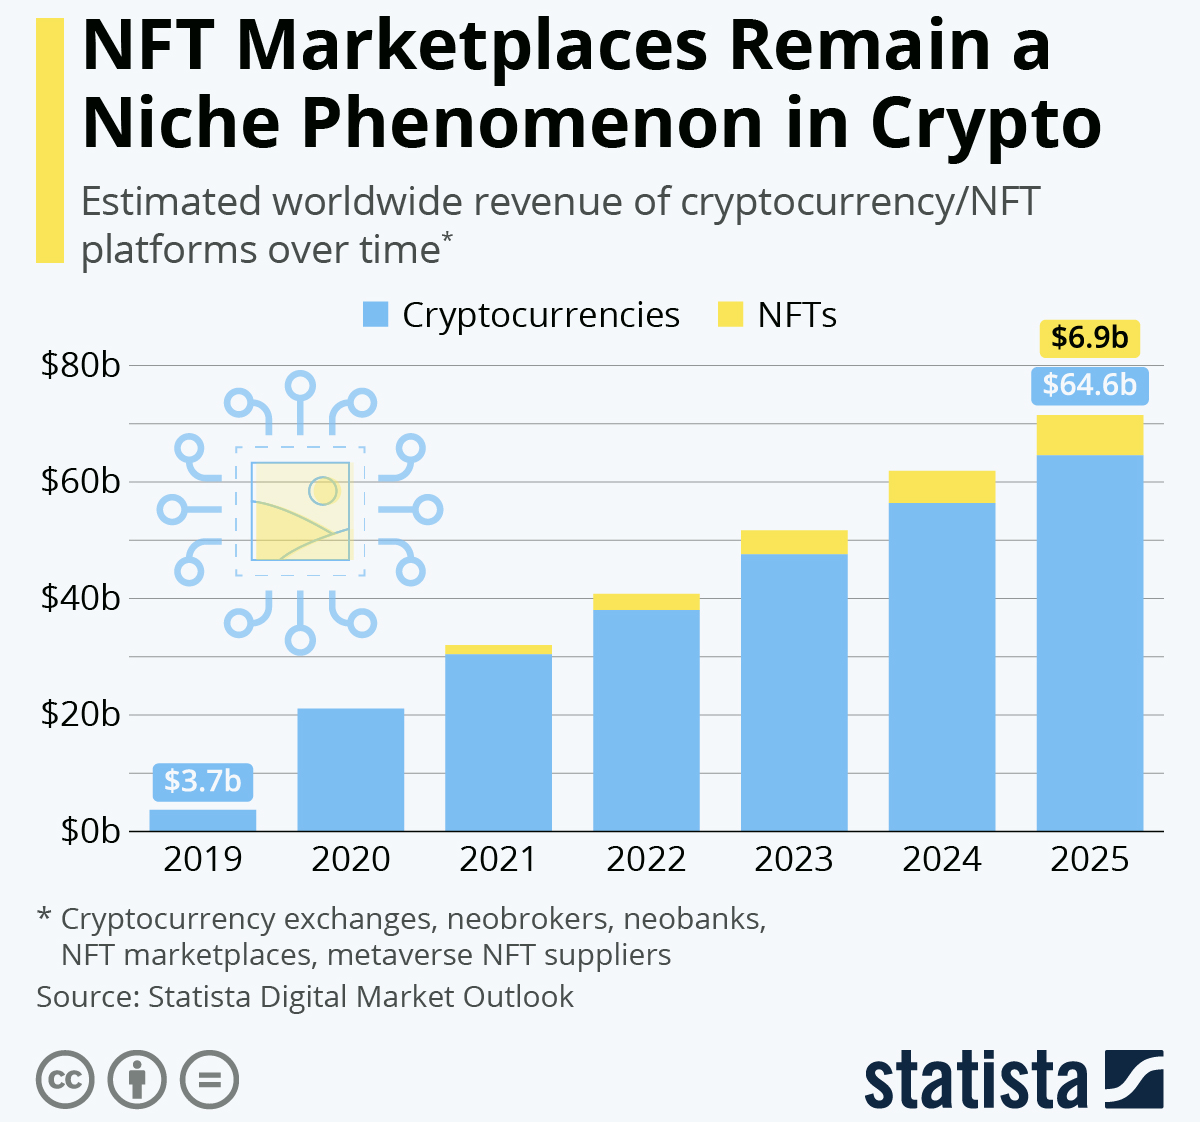
The NFT market was worth close to $504 million in 2025, down from $1.6 billion in 202335.
Over $88 million of this revenue will be generated in the US.
The market is projected to generate $479 million in revenue by 2026, representing a negative CAGR of -5%.
In the same year, the number of NFT users is expected to surpass 11 million, with a global user adoption rate of around 0.15%.
The NFT market surged by 750% between 2018 and 2021, increasing from $41 million to a staggering $25 billion.
However, by next year, the hype had died down, with trading volume on Open Sea, one of the biggest marketplaces at the time, falling by 80% between February and March 2022.
Mobile apps
The global mobile app market was valued at $330.6 billion in 2025 and is expected to grow at a CAGR of 14.3% to reach $1.1 trillion by 203436.
Fueling the mobile app market is the number of global mobile phone users. There were over 5.7 billion unique mobile phone users as of February 2025. This equated to over 70% of the world’s total population.
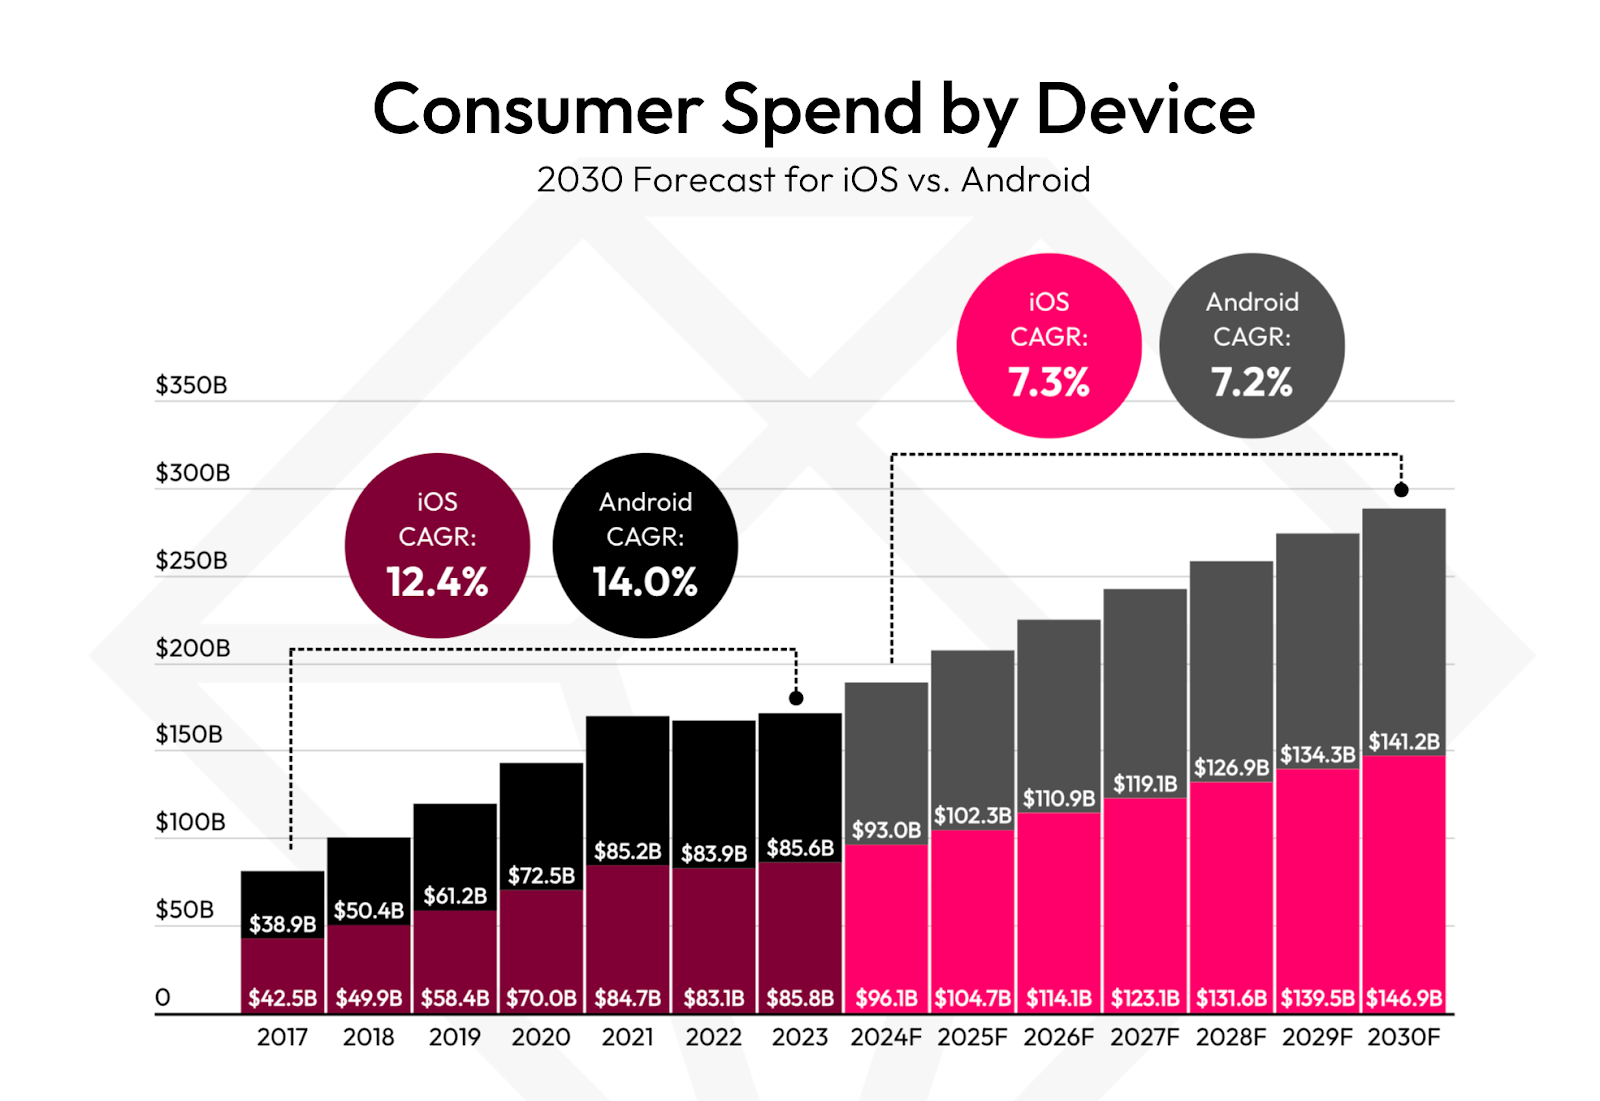
Global consumer spending on premium apps, in-app purchases, and subscriptions across iOS and Android will be over $288 billion per year by 203037.
This is almost 1.7 times what consumers spent in 2023.
In addition:
- iOS consumer spending will grow at a CAGR of 7.3% to $147 billion by 2030.
- Android consumer spending will grow at a CAGR of 7.2% to $141 billion by 2030.
- Spending across non-game apps will reach $226.9 billion (4.6% CAGR), while mobile games will reach $119.7 billion (4.8% CAGR).
- Asia will lead global spending at $130 billion by 2030.
Additionally, global app downloads across iOS and Android will grow at a CAGR of 4.7%, exceeding 347 billion by 2030.
The largest increase in downloads will come from Android devices at a CAGR of 4.8% to 297.4 billion by 2030. Meanwhile, iOS downloads will see a growth rate of 3.9% to 49.2 billion.
A 2025 report found that there were 136 billion new mobile app downloads across iOS and Android in 2024.
This was around 258,000 apps downloaded per minute.
According to the same report, mobile app users spent $150 billion or $285,000 per minute on in-app purchases in 2024, up 12.5% from 2023.
Mobile game in-app purchases accounted for 54% or $80.9 billion of total in-app spending, up 4% from 2023.
Mobile app users spent 4.2 trillion hours on mobile apps in 2024, up 5.8% from 2023.
This was an estimated 500 hours for every person on Earth in 2024.
On average, mobile app users spent 3.5 hours per day or 13 minutes per hour on mobile apps in 2024, up 2.9% from 2023.
Additionally, mobile app users used 26 apps per month or 7 unique apps per day, up 9.2% year-over-year.
Mobile apps mentioning AI were downloaded 17 billion times in 2024, up 240% from 5 billion in 2019.
This accounted for 13% of all app downloads in the year. Revenue from AI apps increased by a whopping 4,567% from $30 million in 2022 to over $1.4 billion in 2024.
Gaming
The global gaming industry generated over $522 billion in 2025, up 12.6% from 202238.
The industry will grow at a CAGR of 7% to over $733 billion in 2030.
Additionally:
- Global adoption is expected to increase to 27.6%.
- The number of users will reach 2.2 billion.
- The average revenue per user is expected to be $1,840.
As of 2025, the video game market was worth $282.3 billion, up 13% from 2024.
At over 50%, video games accounted for the largest share of digital media revenue. The Big 3 in the video gaming industry, Nintendo, Microsoft, and Sony, generated over $60 billion of this revenue.
Global revenue in the online games market was $29 billion in 2025, up 5.4% from 202439.
The majority of revenue was generated in China ($6.9 billion).
Additionally, in 2025:
- Average revenue per user was around $24.59.
- Over 15.3% of people globally played video games.
By 2030, the market is expected to grow at a CAGR of 4.8% to over $37 billion.
Global adoption will increase to 16.4% by 2030, while the number of users is projected to hit 1.3 billion by 2030.
The market for gaming skins surpassed $70 billion in 2024, up from $40 billion in 2020.
In 2021, 30% of spending on virtual goods was attributed to virtual fashion. In a notable case, Gucci sold a virtual version of its Dionysus bag for the equivalent of $6 on Roblox. This later led to bids of more than $4,000 per bag when they were resold on the secondhand market.
Digital news
Over 41% of internet users aged 16+ accessed news sites and apps per month in 2025.
9% of internet users aged 16+ paid for digital news services every month in 2025.
A 2024 report revealed that the average proportion of consumers who pay for online news has remained at 17% since 2021.
News subscription rates were highest in Norway (40%) and Sweden (31%), while Japan (9%) and the UK (8%) had the lowest.
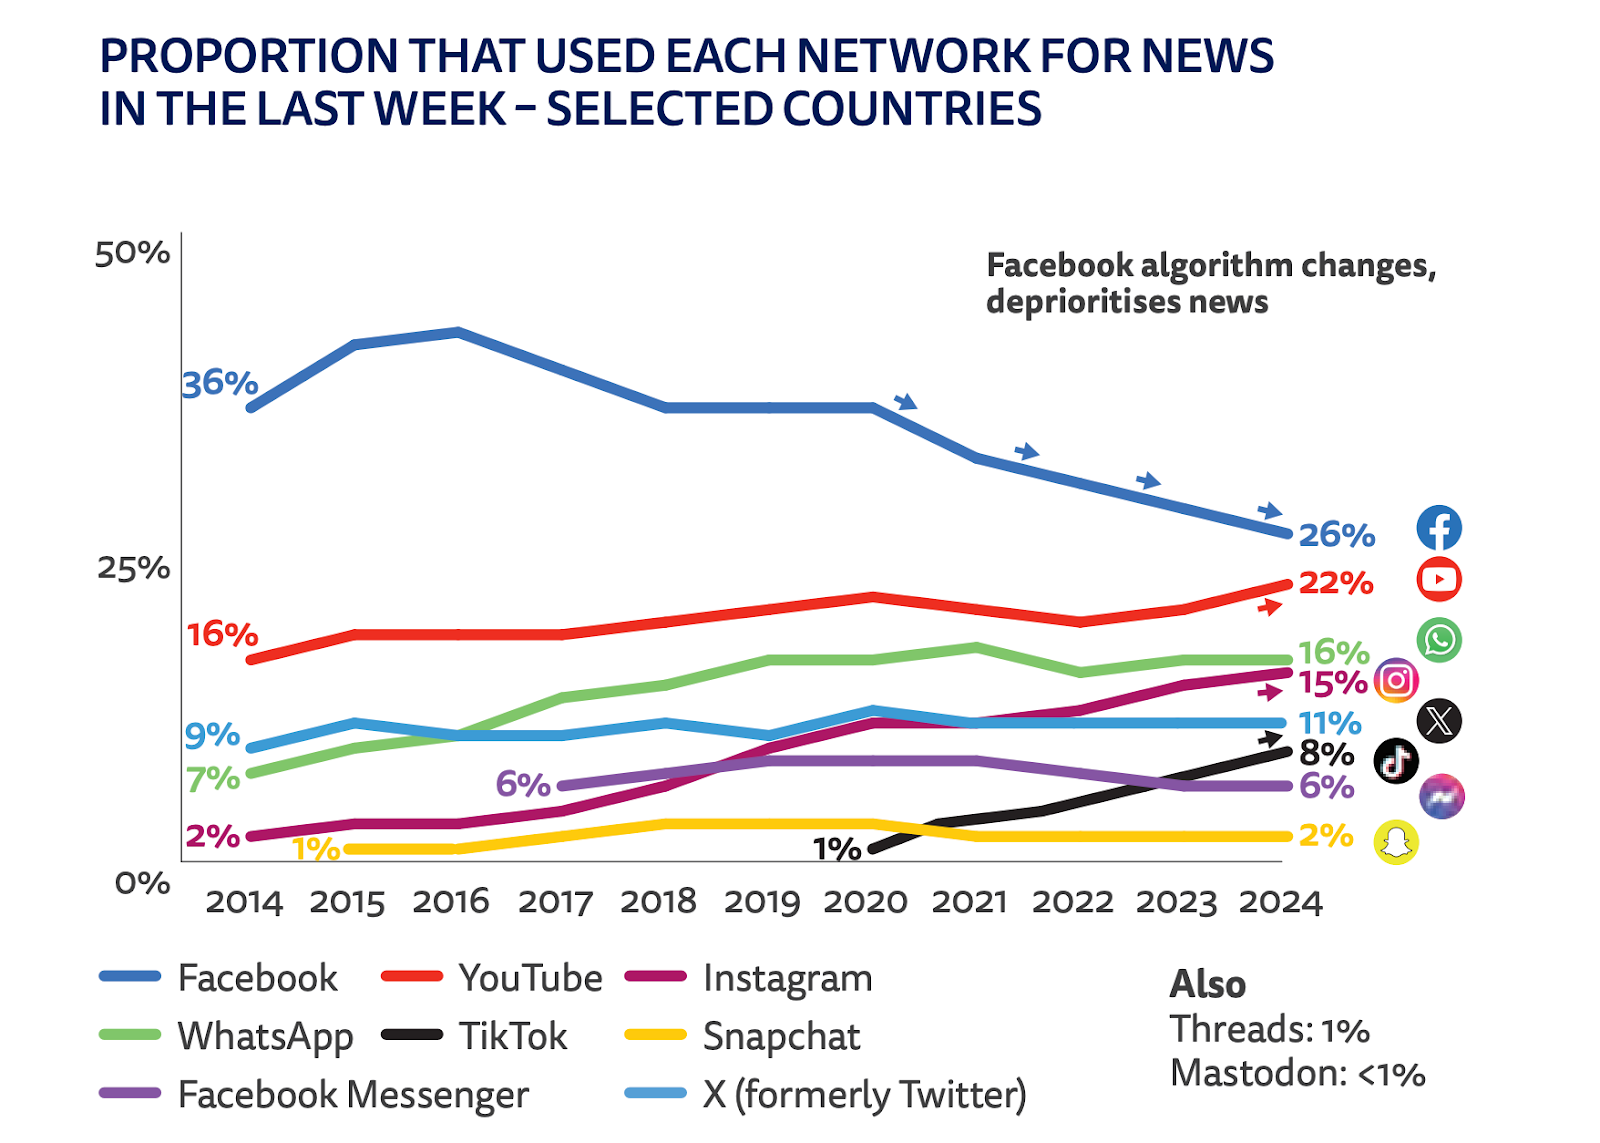
The same report found that over the last decade:
- 26% of consumers used Facebook for news, down from 36%.
- 22% used YouTube for news, up from 16%.
- 16% used WhatsApp for news, up from 7%.
- 15% used Instagram for news, up from 2%.
As of 2024, video became the most popular source of online news, especially with younger groups.
Short news videos were accessed by 66% of consumers each week, with longer formats attracting around 51%.
Meanwhile, 22% of consumers preferred to access news via a website or app in 2024.
That’s down 10% since 2018, pointing to younger consumers’ preference for accessing news through social media, search, and mobile aggregators.
Digital products buyer statistics
As of April 2025, 96% of internet users aged 16+ accessed the internet via mobile phone.
Meanwhile, 61% accessed the internet via laptop or desktop.
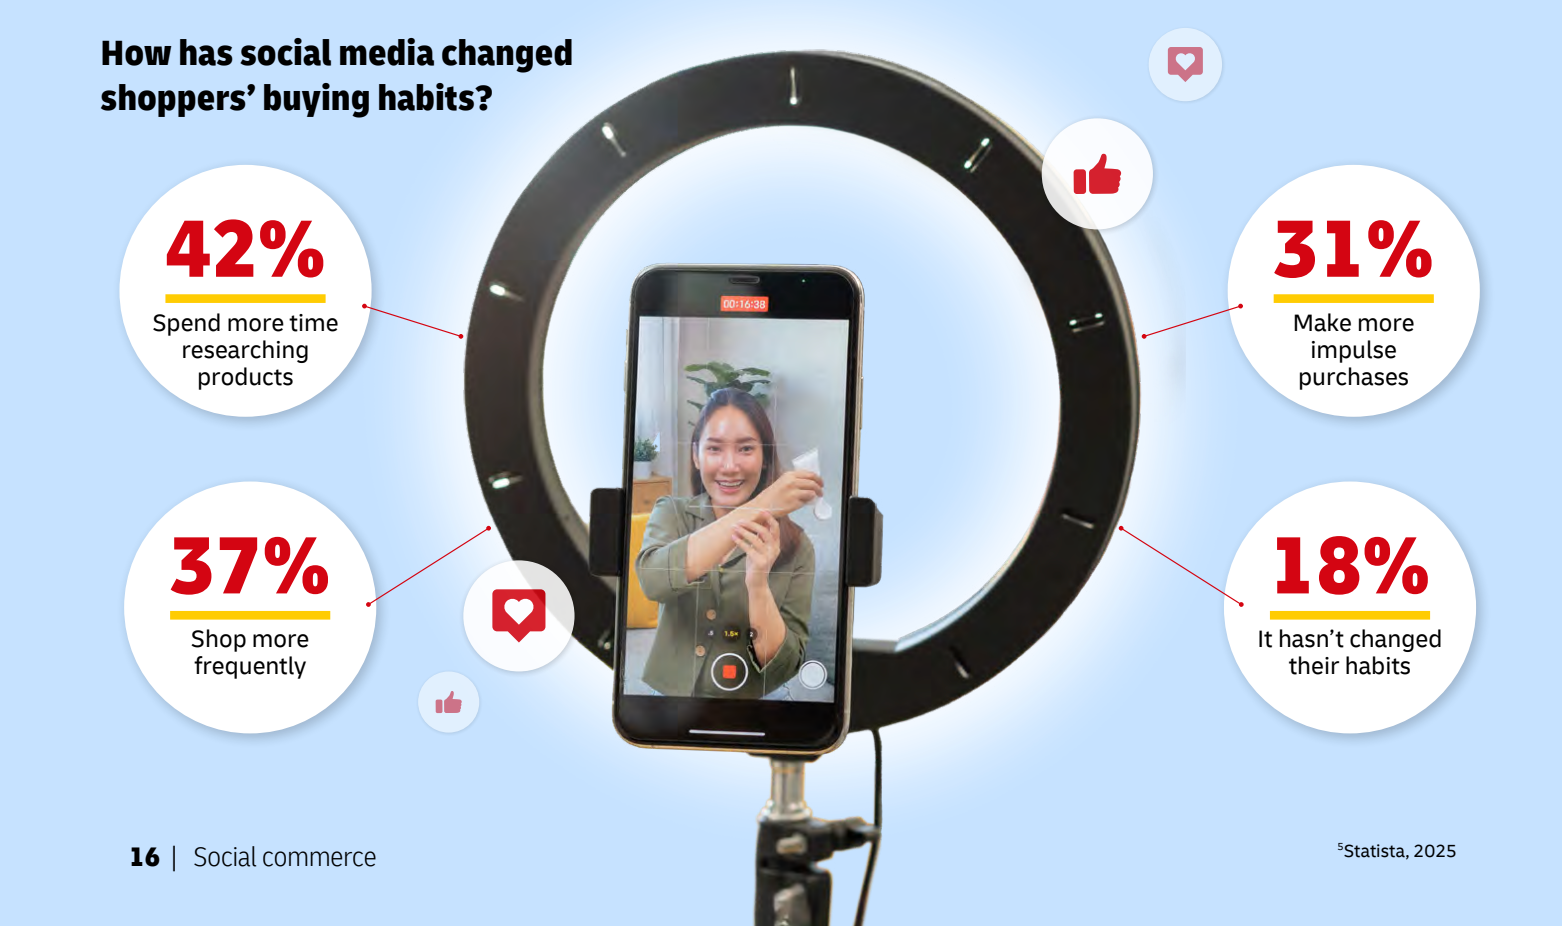
A 2025 report on buyer behavior revealed that in 202540:
- 90% of consumers were influenced by customer reviews.
- 70% of consumers made a purchase on social media.
- 82% of consumers were influenced by trending or viral products.
- 59% of consumers were likely to use BNPL for online purchases.
- 56% of consumers used social media to discover new products.
A 2025 report found that 92% of internet users aged between 16 and 64 watched any kind of online video each week.
In addition:
- 78% accessed news content online.
- 76%% listened to music streaming services.
- 53% listened to podcasts.
- 50% played video games.
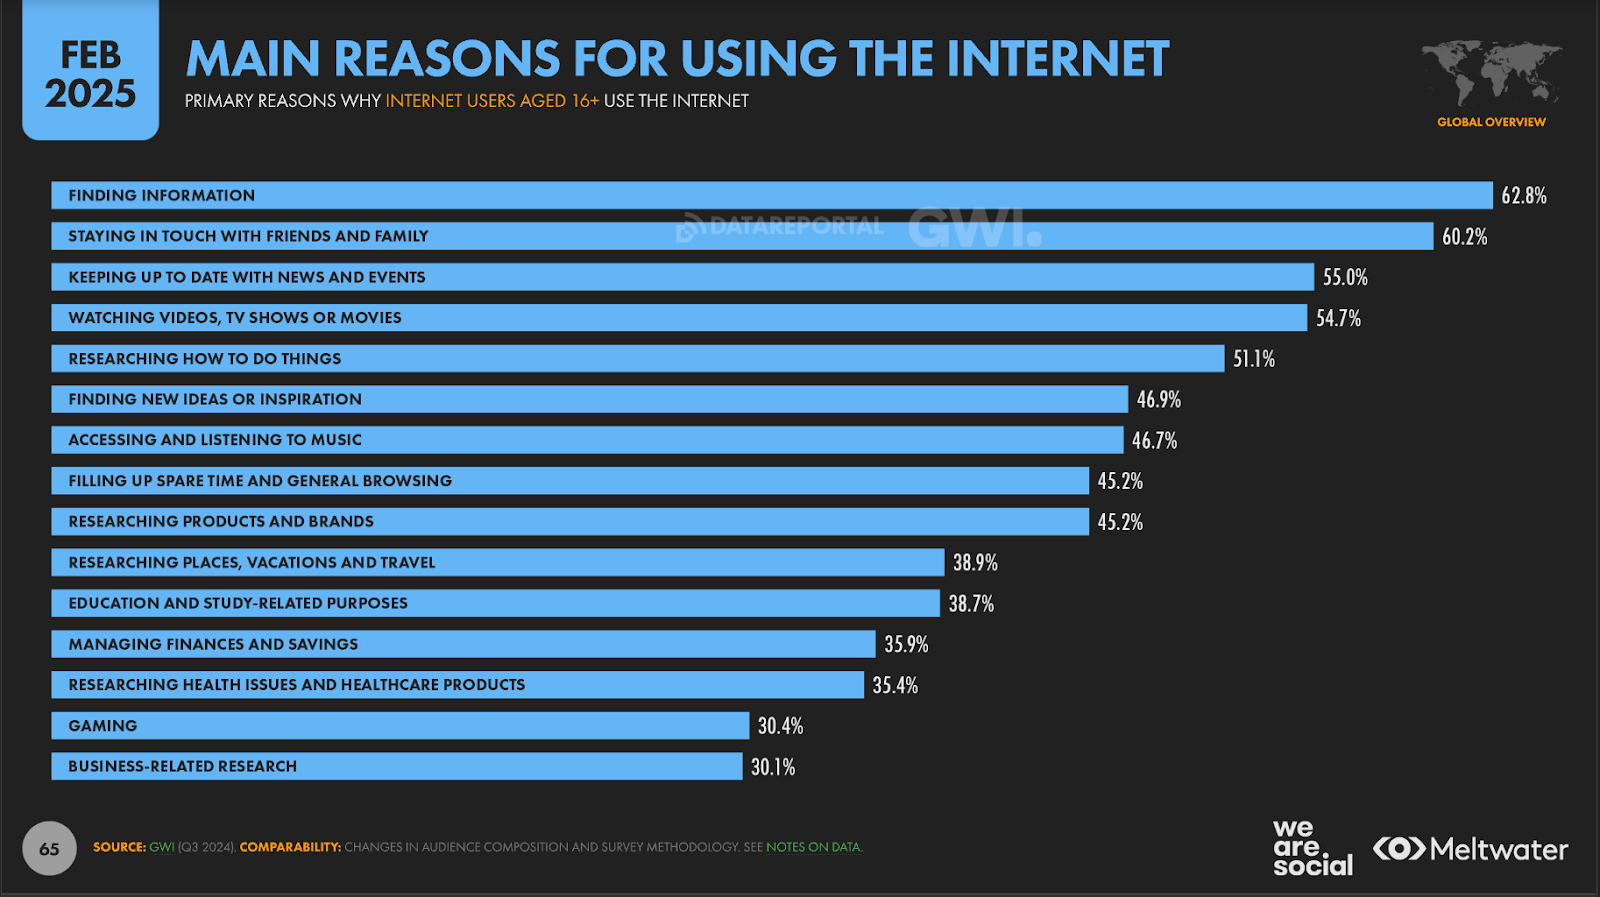
As of February 2025, the typical internet user spent 6 hours and 38 minutes online each day.
During this time, internet users split their time between various digital products related to:
- Finding information - 63%
- Keeping in touch with loved ones - 60%
- Watching videos, TV shows, or movies - 55%
- Keeping up with news and events - 55%
- Learning how to do things - 51%
- Finding new ideas or inspiration - 47%
- Listening to music - 47%
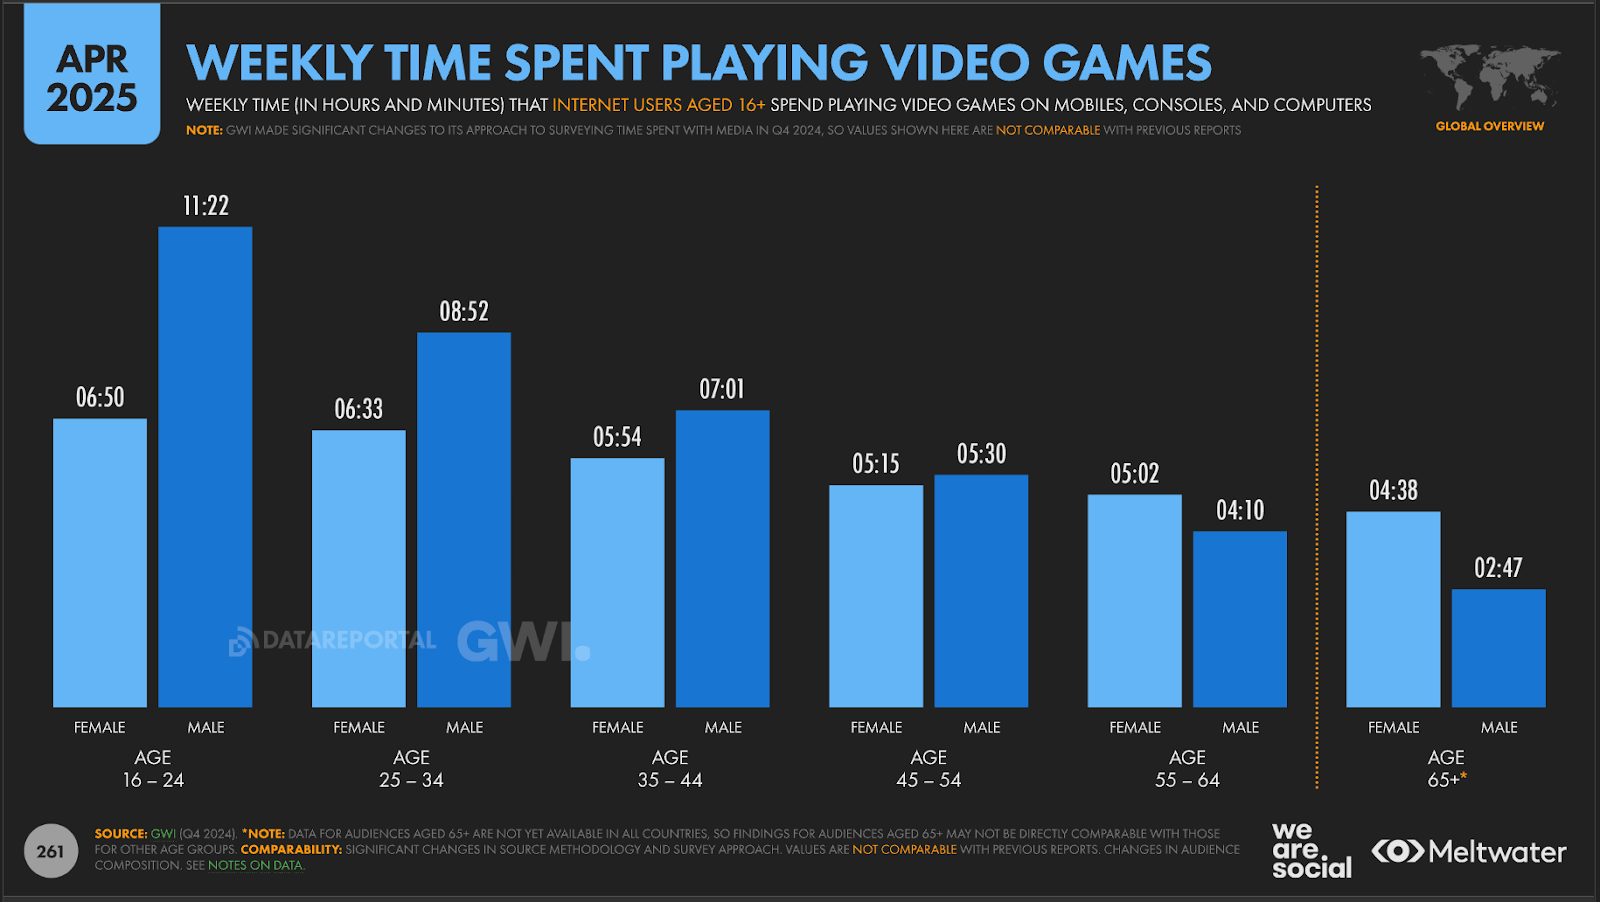
Internet users spent an average of 11 hours and 38 minutes per week on online videos as of April 2025.
They also spent:
- 2 hours 56 minutes reading online press media.
- 4 hours 51 minutes on music streaming services.
- 4 hours and 17 minutes on video games.
- 1 hour and 54 minutes listening to podcasts.
- 2 hours and 38 minutes gaming.
The same report also found that as of April 2025, 32% of internet users aged 16 to 64 paid for TV streaming services each month.
- 22% paid for music streaming.
- 17% paid for mobile apps.
- 16% paid for mobile games.
- 12% paid for e-learning.
- 10% paid for ebooks.
- 9% paid for news.
- 8% paid for software.
In 2025, US households spent an average of $175 per month on digital services like internet connectivity, mobile plans, cloud storage, and antivirus protection41.
72% of consumers expect to keep their spending on tech services and subscriptions steady over the next year. Meanwhile, 14% plan to increase their spending and 10% plan to decrease it.
According to Deloitte, digital products accounted for 3% of US consumers' wallets in 202342. Spending on digital products was much higher for younger consumers, accounting for as much as 3.2% of Gen Z's monthly spending43.
The demand for digital goods and services is fast approaching major categories such as clothing and electronics, where consumers spend 3.8% and 3.4% of their monthly budgets, respectively.
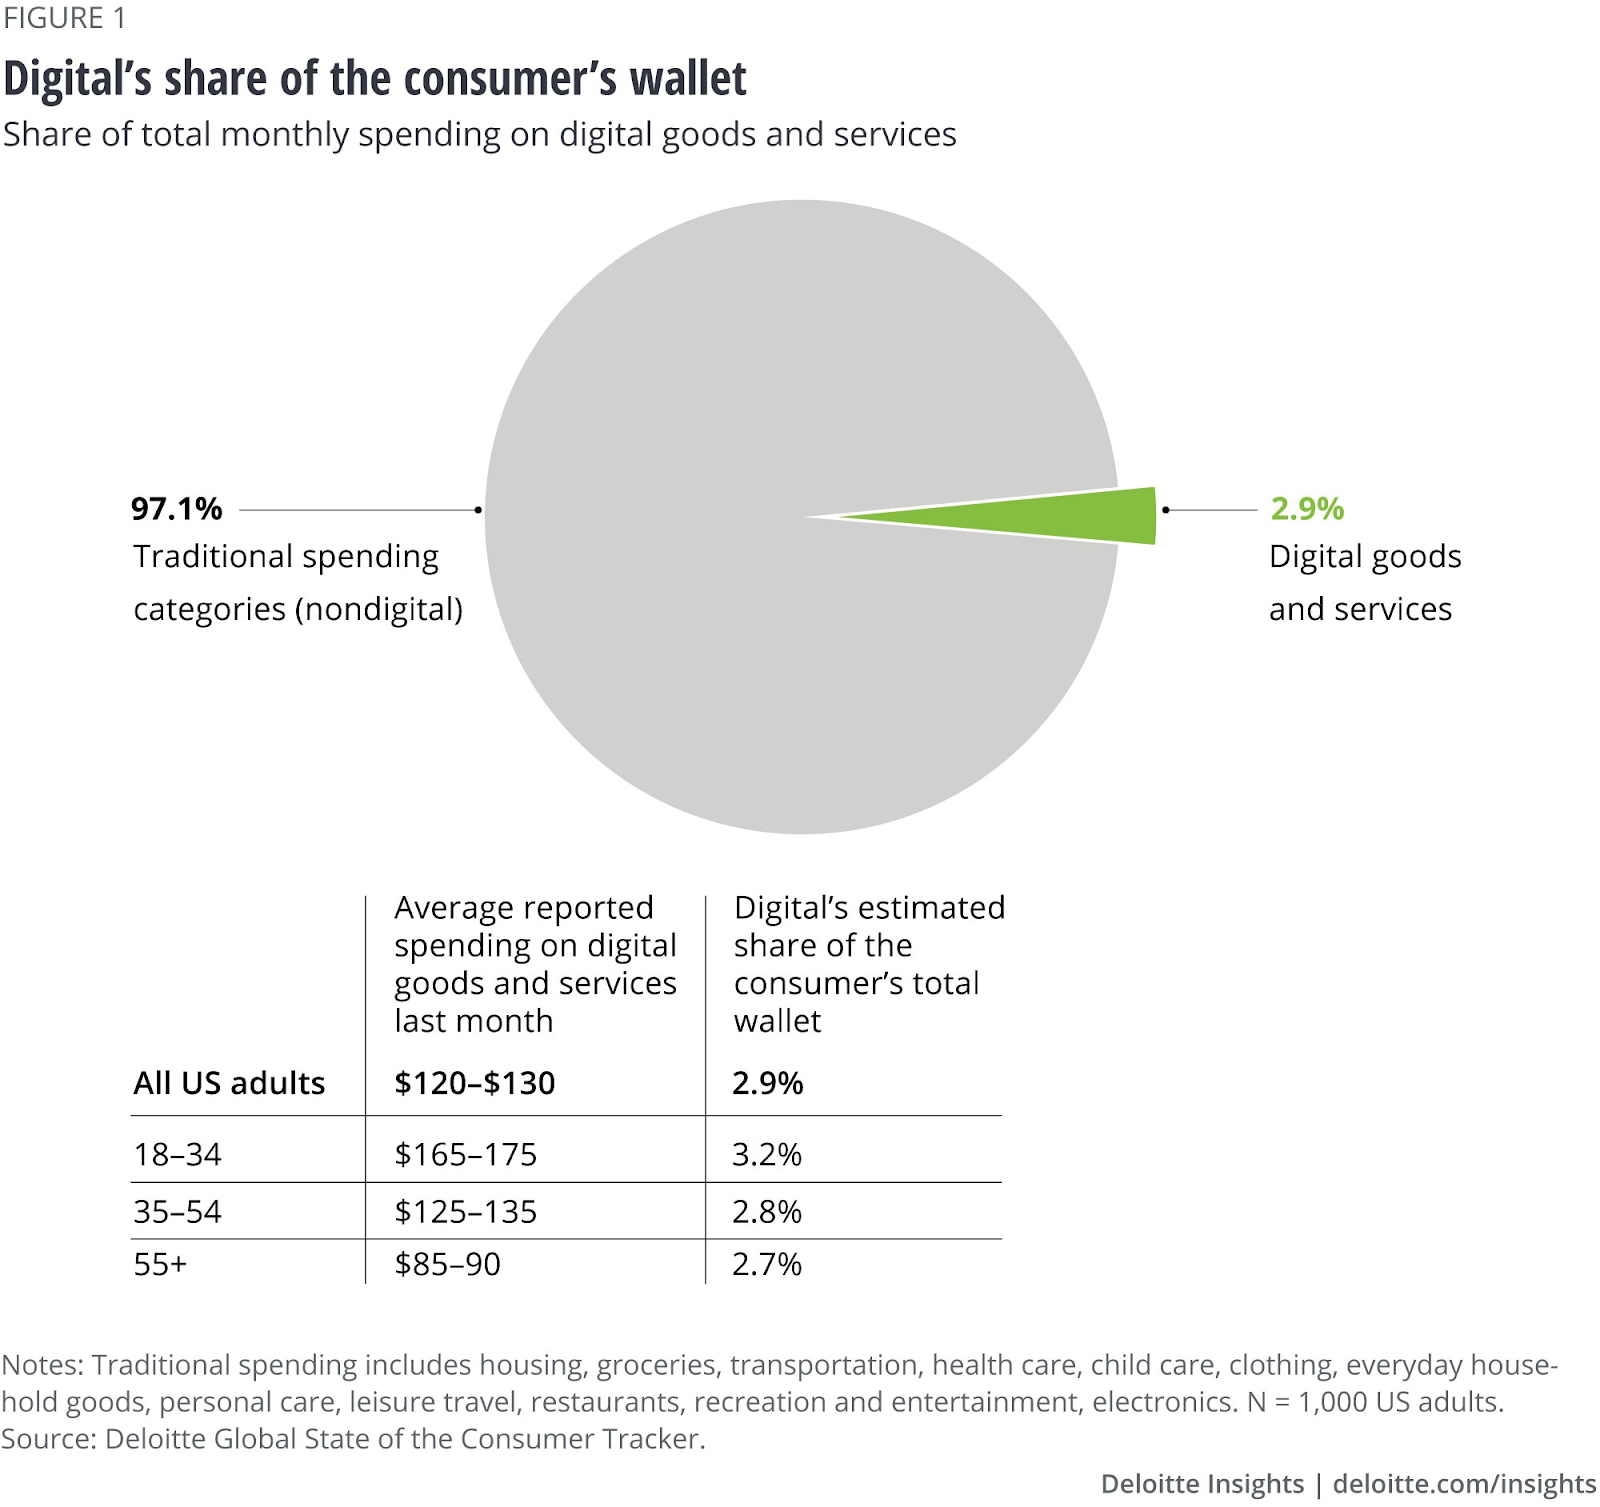
US adults spent between $120 and $130 per month across 12 digital product categories.
- Consumers aged 18 to 34 spent the most, at 3.2% of their monthly budgets, or between $165 and $175.
- Consumers aged 35 to 54 spent between $125 and $135, or 2.8% of their monthly budgets.
- Consumers over 55% spent the least, at 2.7% of their monthly budgets, or between $85 and $90.
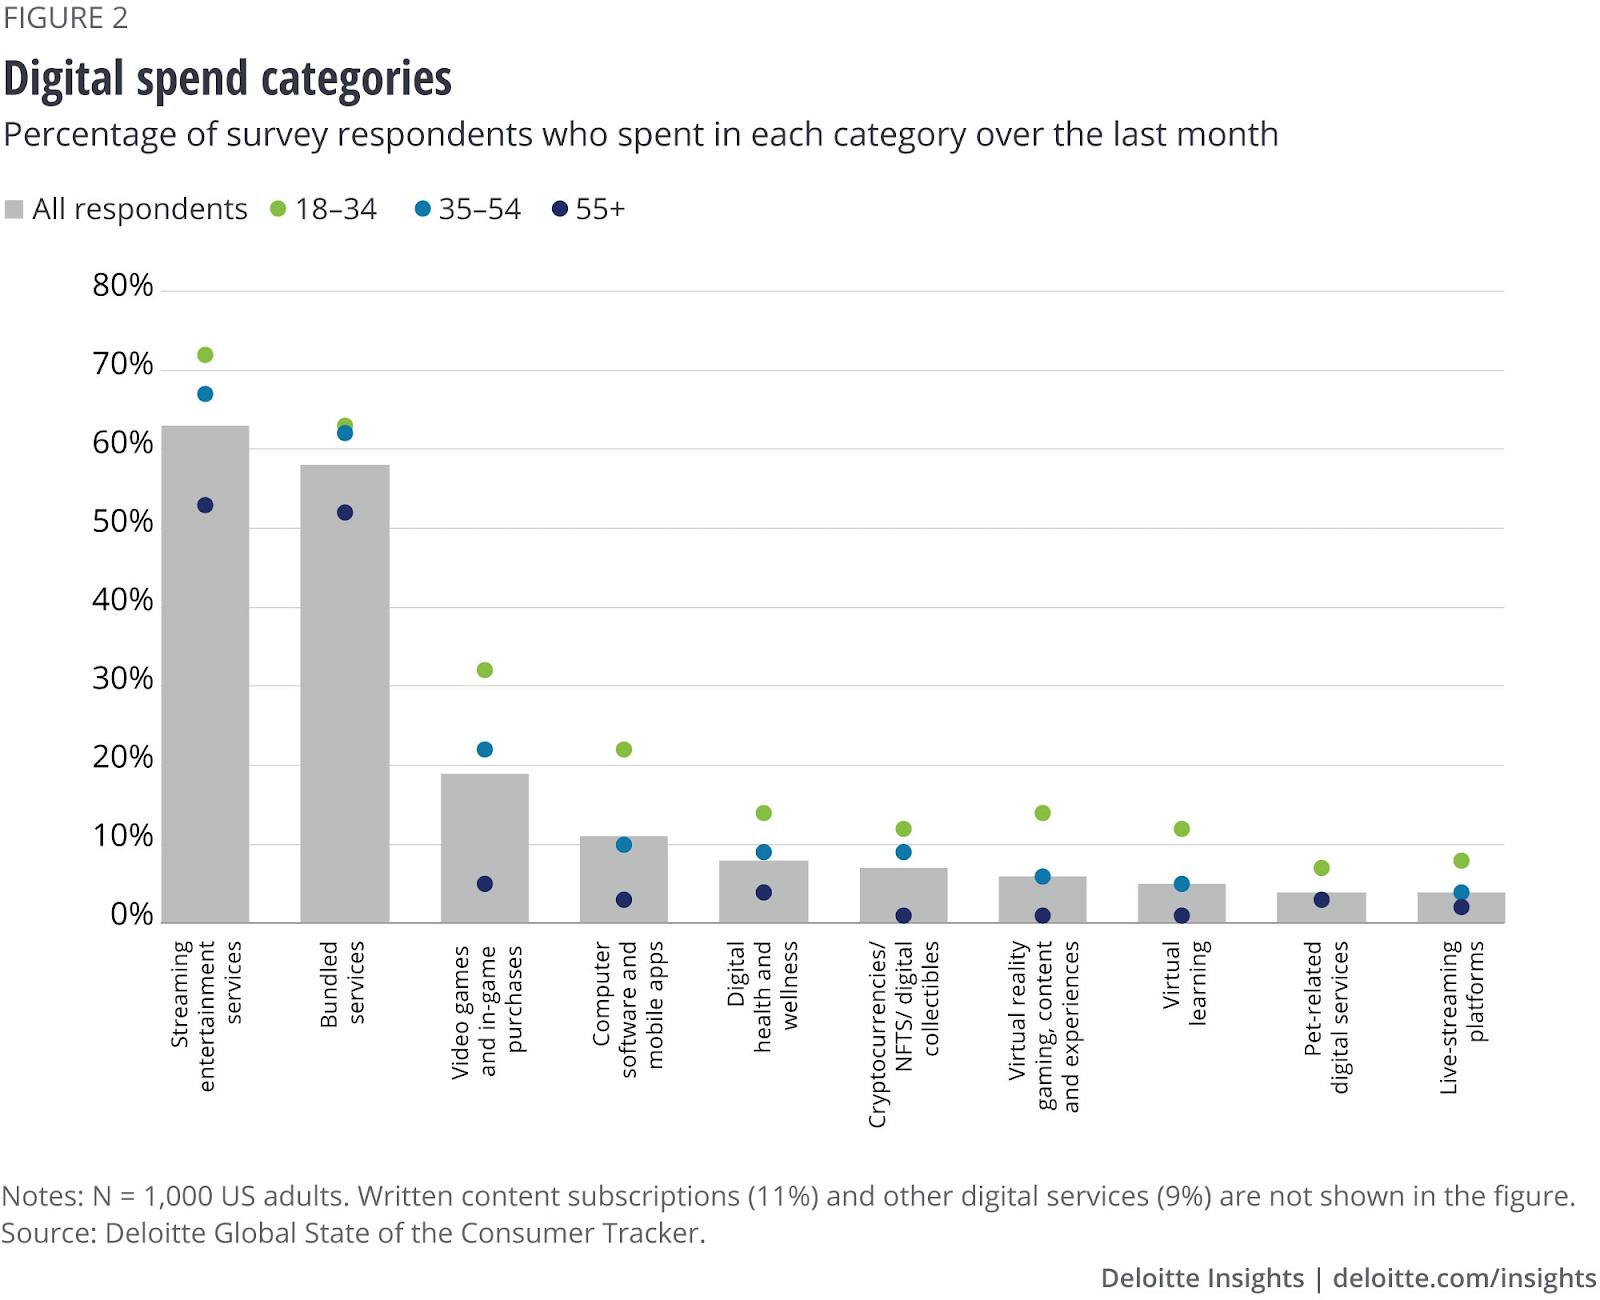
Overall, between December 2022 and January 2023, digital products accounted for 12% of consumers' discretionary spending.
The digital product categories consumers spent on included:
- Streaming and entertainment services - over 60%
- Bundled services - close to 60%
- Video game and in-game purchases - close to 20%
- Computer software and mobile apps - over 10%
In terms of the actual value of spending, consumers spent an average of $40 monthly on streaming platforms, as well as:
- $83 in VR content experience.
- $90 in crypto and digital collectibles.
- $55 in gaming and in-game purchases.
Digital products marketing statistics
Knowing the best marketing channels to use is crucial to your success. We explore some of the most effective strategies for marketing digital products.
Hubspot reported these key digital marketing statistics for 2025:
- The average website had a click-through rate of 13%44.
- The average conversion rate across all ecommerce sites was under 2%.
- Email marketing was one of the most effective channels for driving conversions, with a 2.8% conversion rate for B2C brands and a 2.4% conversion rate for B2B brands.
- Companies with active blogs produced an average of 67% more leads per month than companies that didn’t.
- 86% of consumers recalled podcast ads more than any other channel.
According to a Hubspot report, the marketing channels with the highest ROI for B2B brands in 2025 were:
- Website/ blog and SEO45
- Paid social media content
- Social media shopping tools
For B2C brands, the channels with the best ROI were:
- Email marketing
- Paid social media content
- Content marketing
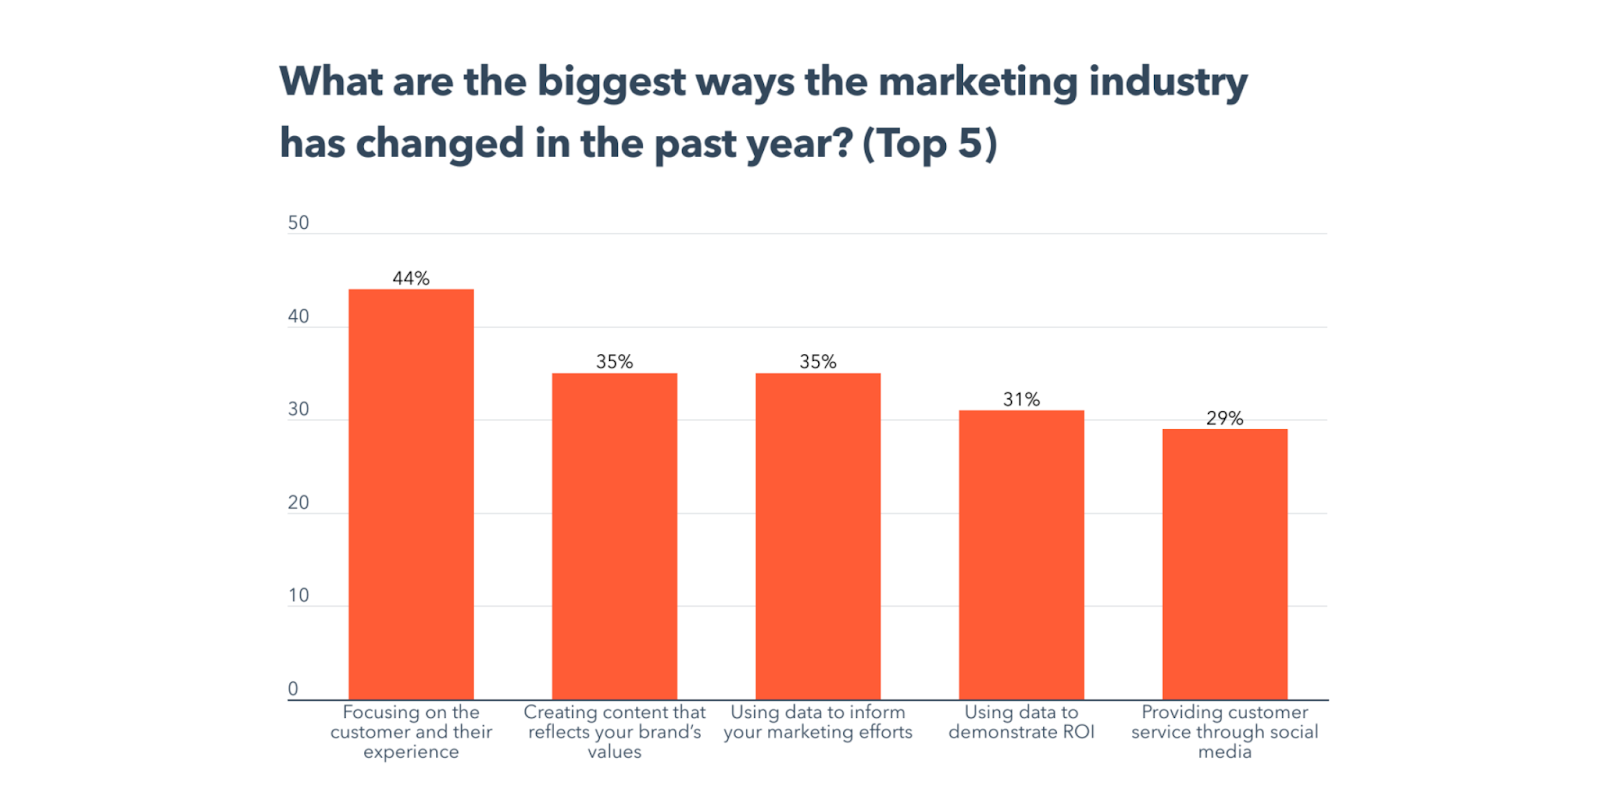
When asked how the marketing industry had changed within the past year, 44% of marketers noted a greater focus on customer experience.
35% cited creating content that reflects brand values, and the same percentage reported using data to inform marketing efforts. 31% pointed to the importance of using data to demonstrate ROI.
Over 20% of marketers selected short-form video as the content format with the highest ROI. This was followed by images (19%) and live-streamed videos (16%). More marketers planned to invest more in these formats in 2025.
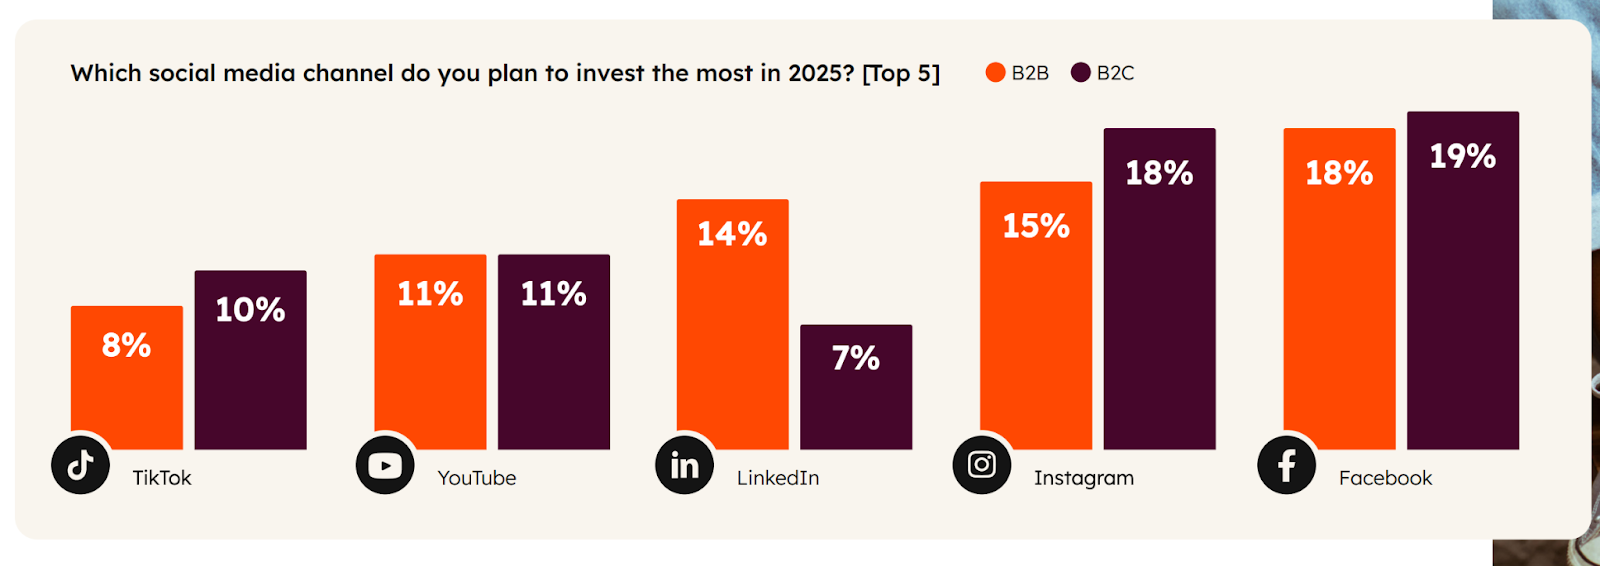
The top 7 media formats leveraged in 2025 included:
- Short-form video at 30% for both B2C and B2B brands.
- Images at 29% for B2B and 30% for B2C brands.
- Interviews at 24% for B2B and 21% for B2C brands.
- Blog posts at 23% for B2B and 20% for B2C brands.
- Long-form video at 19% for B2B and 18% for B2C brands.
- UGC at 18% for B2B and 21% for B2C brands.
- Live streaming video at 17% for B2B and 22% for B2C brands.
In 2025, 92% of marketers planned to maintain or increase investments in brand awareness.
A further 91% planned to do the same for podcasts and audio content.
As of April 2025, there were over 5.3 billion social media users worldwide, representing nearly 65% of the total global population.
This positioned social media as a prime marketing channel for brands supplying both physical and digital products.
The potential ad reach and average costs per 1000 impressions (CPM) for the biggest social networks in 2025 were:
- Facebook - 2.34 billion users with an average CPM of $8.1546.
- YouTube - 2.54 billion users with an average CPM of $2.16.
- Instagram - 1.84 billion users with an average CPM of $8.15.
- TikTok - 1.84 billion users with an average CPM of $2.97.
- LinkedIn - 1.24 billion users with an average CPM of $6.59.
24% of marketers used influencer marketing in 2024 and spent 50% to 74% of their marketing budgets on influencers or content creators.
Both B2C and B2B brands found the most success with micro influencers (10K-100K followers). They also saw the highest ROI with Facebook (28%), Instagram (22%), and YouTube (12%).
50% of marketers stated that consumer use of AI for search had impacted their search traffic positively.
Notably, 31% of Gen Z consumers reported that they used AI platforms and chatbots to find information online. Over 33% of consumers stated that they hoped AI would be more helpful for online research in the future.
In 2024, 87% of marketers planned to increase their investment in mobile messaging through channels like SMS, Facebook Messenger, and WhatsApp.
20% of marketers globally used mobile messaging, with 10% calling it a major driver of ROI. Additionally, personalized messaging had:
- 120x ROI.
- 50% better customer re-engagement.
- 21% increase in sales conversions.
Digital products piracy statistics
Online video content piracy costs the global media sector $75 billion yearly47.
This figure is expected to almost double to over $125 billion by 2028, representing an annual growth rate of 11%.
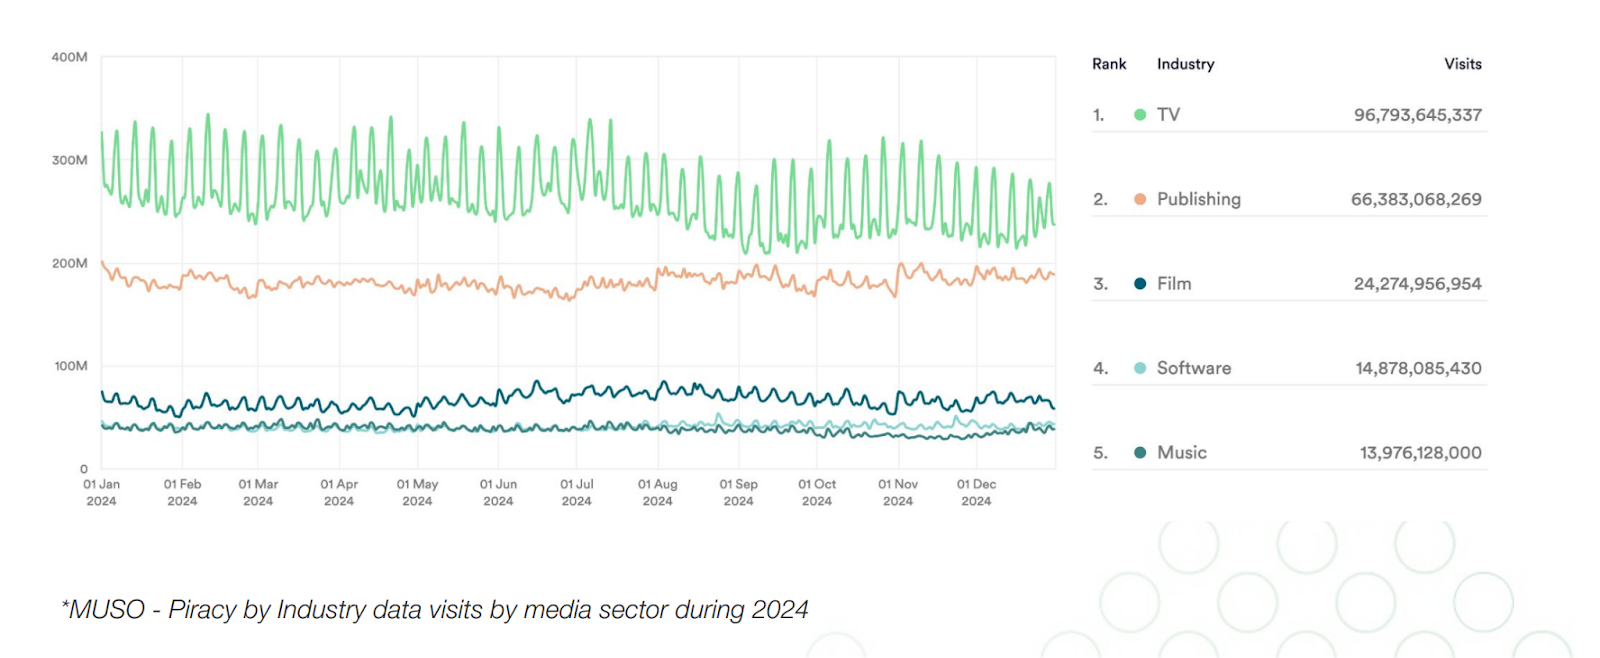
In 2024, there were 216.3 billion visits to piracy websites, down from 6% in 202348.
- TV piracy took the lead, accounting for 45% or 96.8 billion visits globally, down 6.8% year over year.
- Publishing piracy accounted for 31% or 66.4 billion visits, up 4.3% year over year.
- Film piracy accounted for 11% or 24.3 billion visits, down 18% year over year.
- Software piracy accounted for 7% or 14.9 billion visits, down 2.1% year over year.
- Music piracy accounted for 6% or 13.9 billion visits, down 18.6% year over year.
The US led the charge with a 12.3% share in global pirate site visits in 2024.
- India followed closely behind with an 8% share.
- Russia had a 7% share.
- Indonesia had a 6% share.
- Vietnam had a 3% share.
At 70%, Manga accounted for all publishing piracy.
Meanwhile, films and TV shows accounted for 60% of TV piracy.
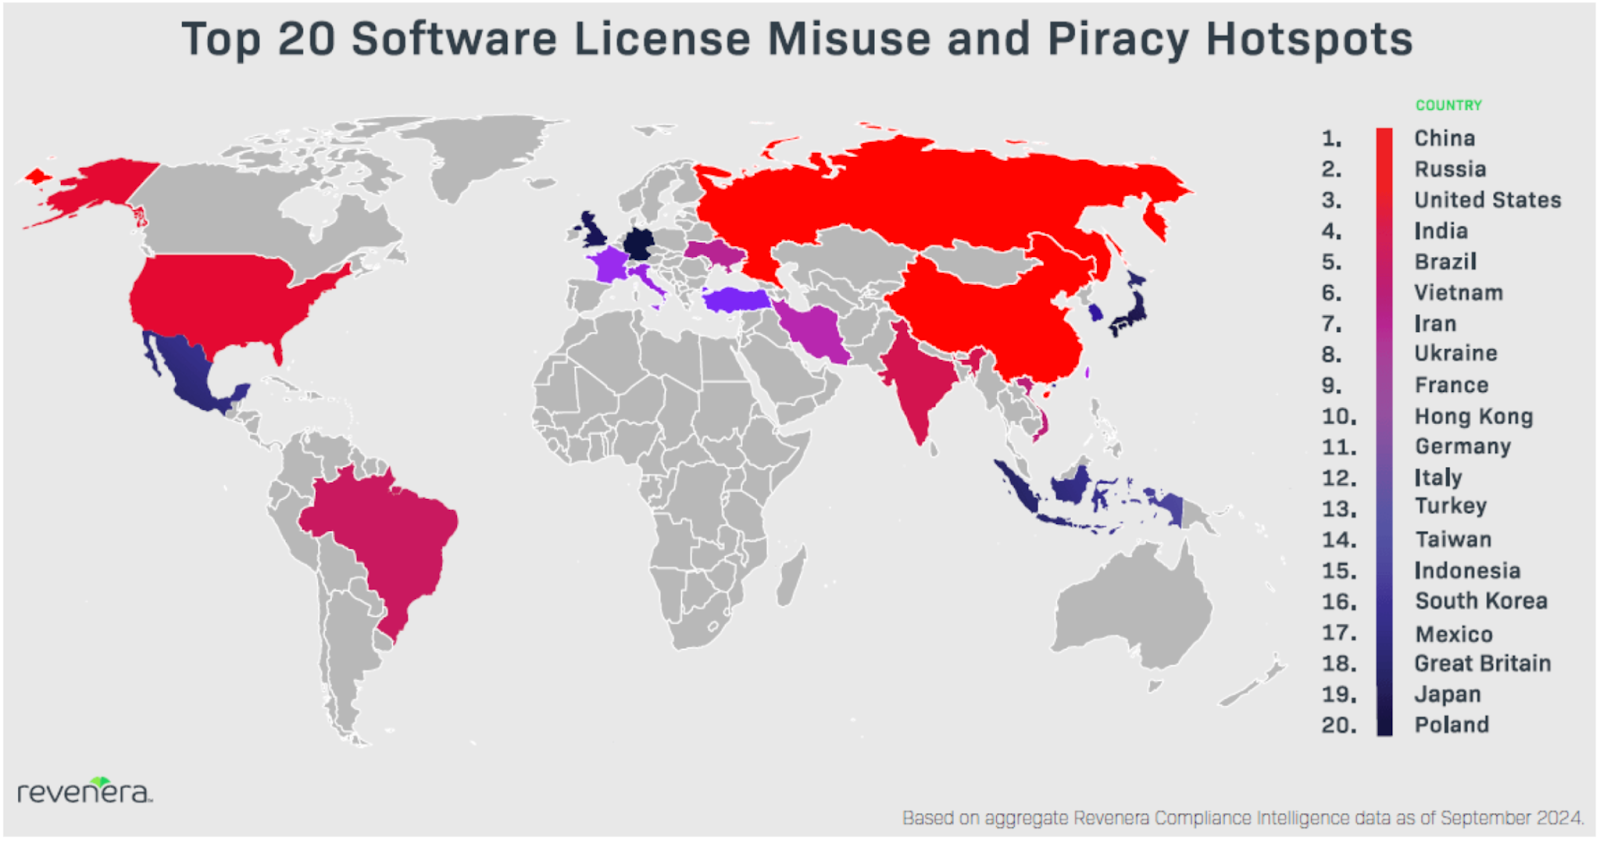
37% of software worldwide was unlicensed in 202449.
Additionally, the global commercial value of unlicensed software was $46.3 billion. The commercial value of unlicensed software in North America and Europe alone was $18.7 billion, or 41% of the global value. This was despite both regions having below-average piracy rates (16% and 26% respectively).
In a separate survey of over 400 global technology leaders, 33% cited software piracy as a major problem in 2024, down from 40% reported in 2023.
The same report found that as of September 2024, the top 5 countries using pirated software were:
- China
- Russia
- United States
- India
- Brazil
Digital products fraud statistics
In 2025, over 25% of digital transactions were a fraud attempt50.
Chargeback fraud cost merchants over 3.5x their initial loss.
More than 77% of chargebacks classified as fraud were actually friendly fraud.
Friendly fraud is when a customer disputes a charge for a digital product they have already received. The most common reasons for digital goods chargebacks were:
- 10.4 - Other fraud, card absent environment at 62%.
- 4837 - No cardholder authorization at 17%.
- 13.2 - Cancelled recurring transaction at 11%.
A report by Nsure found that:
- Digital currency gift cards were targets of fraud at 5x the typical rate51.
- Downloads (apps and music) were targets of fraud at 3x the typical rate.
- Console games (PlayStation, followed by Xbox and Nintendo) experienced fraud attacks at 2x the typical rate.
Monthly fraudulent transactions increased by 37%, almost double the rate of fraudulent transactions for physical-only goods in 2020.
US merchants selling digital goods were the hardest hit by these fraud attempts.
Sell digital products with Whop
The digital product economy is booming — generating over $2.5 trillion in value annually as of 2025.
In 2024 alone, internet users spent $560 billion on digital media like videos, ebooks, music, and games. And with 68% of people aged 16+ paying for digital content each month, the demand is only growing.
Whop makes it easy to tap into this thriving market. As a digital product marketplace, Whop lets you create, sell, and manage everything from templates and courses to memberships and app access.
You can start selling in under 10 minutes — Whop takes care of payments, order delivery, and customer support.
If you're ready to turn your ideas into income, Whop is the place to start.
FAQs
How big is the market for digital products?
While it is difficult to say due to the fragmented nature of digital products, the market is massive, exceeding $600 billion globally.
Can I make money selling digital products?
Yes, you can make money online selling digital products. Not only are they highly profitable, but digital products such as ebooks, online courses, or digital designs are scalable and can be produced without any additional financial or time investment.
What are examples of digital products?
Examples of digital products include ebooks, video games, music, movies, and apps – so, any intangible product that is distributed online.
Sources
References
- Heinz College
- Mastercard
- DataReportal
- McKinsey
- Business of Fashion
- Shop Circle
- Statista
- Statista
- Statista
- Statista
- Statista
- Statista
- Publishers Weekly
- Podcast Index
- Statista
- Market
- Reuters Institute
- Market
- Statista
- Worldscreen
- Nielsen
- Research and Markets
- Statista
- Globenewswire
- McKinsey
- Statista
- Statista
- Statista
- Gartner
- McKinsey
- YouGov
- Data Reportal
- Statista
- Sensor Tower
- Statista
- Precedent Research
- Sensor Tower
- Statista
- Statista
- DHL
- Deloitte
- Deloitte
- Deloitte
- Hubspot
- Hubspot
- Guptamedia
- MUSO
- MUSO
- Revenera
- Kount
- Nsure