Keep up with the latest developments in ecommerce with this comprehensive report featuring 120+ ecommerce statistics.
Key takeaways
- Mobile commerce is rapidly dominating ecommerce, with smartphones driving 80% of retail website visits and expected to reach 50% of US sales by 2026.
- Amazon's dominance is staggering, holding 65% market share among top publicly traded ecommerce companies and generating 49% of their total revenue.
- AI automation is reshaping ecommerce employment, with job demand expected to drop 13% by 2030 while major companies have already laid off thousands.
We’ve come a long way since the first ecommerce transaction in 19941 when entrepreneur Dan Kohn sold a Sting CD for $12.48 plus shipping. Today, ecommerce is a global phenomenon that shows no signs of slowing down. With over 5 billion internet users worldwide flocking to online marketplaces, mobile apps, and social media platforms to shop, it's no surprise that the industry is set to exceed revenues of $6.3 trillion in 2025.
Whether you're on the buying or selling side, keeping up with the ecommerce industry and all its developments can be challenging. That's why we've done all the heavy lifting to deliver 120+ ecommerce statistics for 2026. Keep reading to discover key industry trends, marketplaces, consumer preferences, technology shifts, and more.
Ecommerce industry snapshot
| Share of Global Retail Sales | 21% |
|---|---|
| Global Revenue (2024) | $ 6.3 trillion |
| Average revenue per user | $1.079 |
| Market Penetration | 53.9% |
| CAGR (2024 - 2028) | 9.83% |
Ecommerce outlook statistics
- In 2025, ecommerce revenue is expected to exceed $7 trillion2 with a 25% share of total global sales3.
- By 2026, mobile commerce will account for up to 50% of all US ecommerce sales4.
- In 2027, ecommerce will make up over 25% of total global retail sales5, a 6% increase from 2022 when ecommerce sales accounted for just 19% of retail sales worldwide.
- By 2028, the number of users in the ecommerce market will hit 4.5 billion, at a penetration rate of 63.2%.
- The US, which has the world’s highest ecommerce ARPU will see an increase of 32.6%6 or $971 between 2024 and 2028 to hit a new high of $3953.
- By 2030, ecommerce logistics alone will generate 25 million metric tons of carbon emissions7.
- The global retail ecommerce market will exceed 17 trillion8 in 2032.
- US ecommerce sales will more than double at a CAGR of 8% over the next decade9 to exceed $2.2 trillion.
Ecommerce industry statistics
The ecommerce industry has empowered businesses to reach customers worldwide and broadly consists of 14 different industries, namely:
- Beverages
- Food
- Tobacco
- Household essentials
- Beauty and Personal care
- Fashion
- Eyewear
- Electronics
- Furniture
- OTC Pharmaceuticals
- Toys and Hobby
- Luxury Goods
- DIY and Hardware
- Media
Globally, the ecommerce market is worth $6.5 trillion and is expected to expand at a CAGR of 9.8%10 between 2024 and 2028.
On an individual country level, the US is projected to take the lead in terms of ecommerce market development with a growth rate of 11.8% during the same period. Followed by:
- India with a CAGR of 11.79%
- Mexico with a CAGR of 11.79%
- Argentina with a CAGR of 11.71%
- Brazil with a CAGR of 10.49%
- China with a CAGR of 10.38%
- Turkey with a CAGR of 9.95%
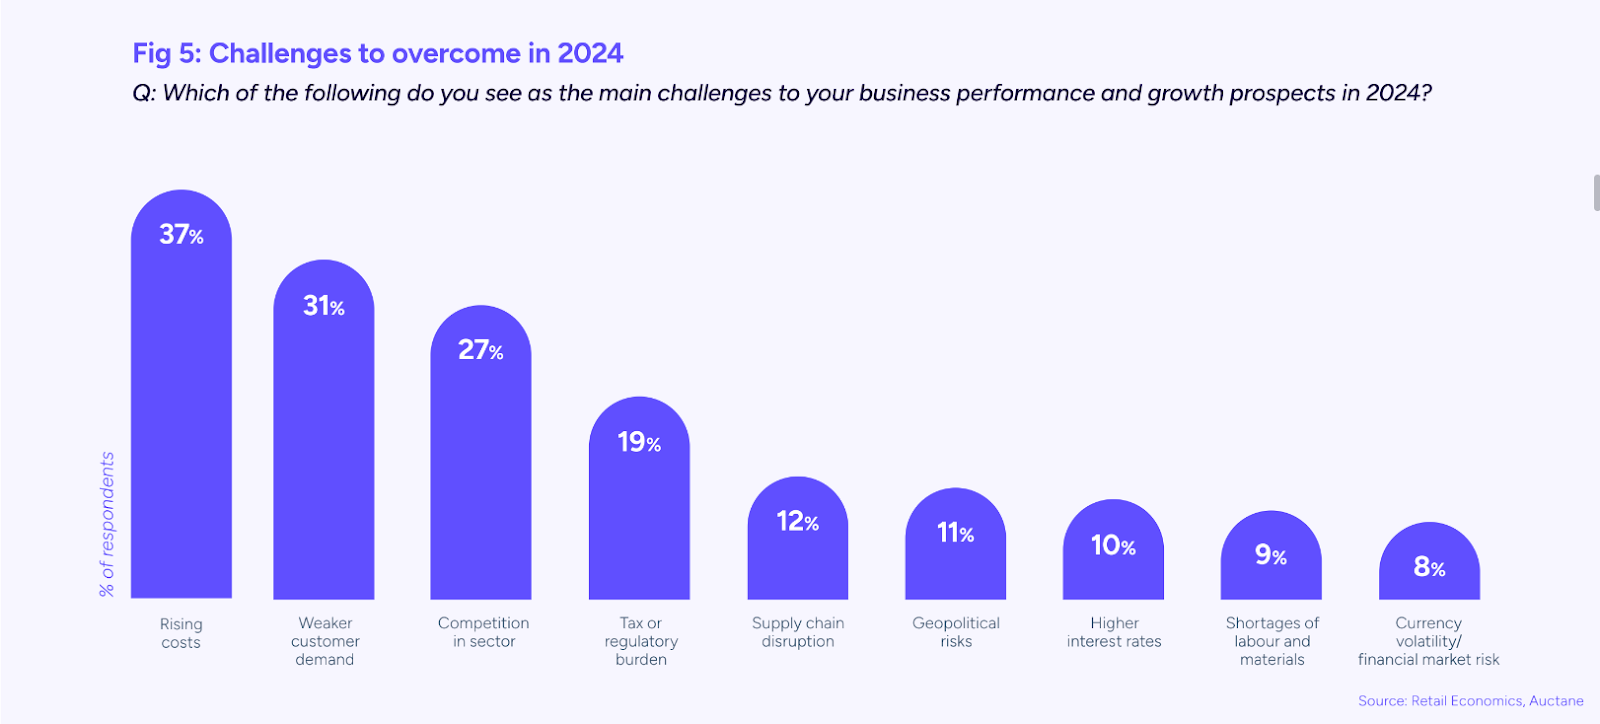
While 2024 has a brighter economic outlook compared to 2023, a report by Retail Economics11 found that 37% of online merchants remain concerned about rising costs.
Other key business performance and growth challenges identified included:
- Weaker customer demand - 31%
- Increased competition - 27%
- Tax/Regulatory burdens - 19%
- Supply chain disruptions - 12%
Ecommerce accounted for between 40% and 50% of total retail sales growth in 2023.
Following a brief post-pandemic lull resulting in 26% sales growth in 2021 and 22% sales growth in 2022, ecommerce sales growth trended upwards in 2023—accounting for 42% of all retail sales growth globally.
Ecommerce market share was around 21% in 2023.
In 2020, year-over-year growth of ecommerce as a share of total retail sales saw record growth globally.
- In the UK, ecommerce as a share of total retail sales grew 4.5x.
- In the US ecommerce as a share of total retail sales grew 3.3x.
- In China, ecommerce as a share of total retail sales grew 1.6x.
Asia led ecommerce sales in 2023, with total revenues of over $1.7 trillion12, most of this revenue could be traced back to China which racked in revenues of over $935 billion.
This was over $800 million more than the ecommerce revenues in the Americas, Australia, and Oceania, reflecting Asia’s well-developed ecommerce market.
The top 5 biggest publicly traded ecommerce companies by market cap13 as of 24 February 2024 were:
1. Amazon - $1.8 trillion
2. Alibaba - $ 191 billion
3. Pinduoduo - $170 billion
4. Shopify - $98 billion
5.MercadoLibre - $82 billion
Out of a total market cap of $2.77 trillion, Amazon held an impressive 65% share of the 97 top publicly traded ecommerce companies globally.
The ecommerce giant also held the top spot in terms of revenue. In 2023, Amazon’s revenue was $575 billion, or 49% of the total revenue of the top 97 publicly traded ecommerce companies by revenue. The top 5 revenue earners ranked in order are listed below:
1. Amazon - $575 billion
2. Jingdong Mall - $ 152 billion
3. Alibaba - $131 billion
4. Meituan- $37 billion
5. Pinduoduo - $82 billion
Ecommerce employment statistics
As of February 2024, the average ecommerce employee salary ranged between $42,000 and $63,00014 per year.
- The average ecommerce manager salary in the US ranged between $78,109 and $142,749 per year.
- The average ecommerce director's salary fell between $124,996 and $200,000 per year.
As generative AI, higher levels of automation, and economic pressures sweep through the ecommerce industry, the demand for ecommerce jobs is expected to drop by 13%15 between 2023 and 2030.
As of 2023, the increased use of in-store channels, rising inflation, and supply chain issues slowed down ecommerce growth. In response, major players in the industry downsized, laying off thousands of employees. Notably:
- eBay laid off 1000 workers while PayPal cut 2500 jobs in January 2024
- In the UK, Amazon closed 3 major distribution centers, while Walmart laid off 2000 employees working at ecommerce-related warehouses in 2023.
- Similarly, Amazon laid off 17,000 workers, while Shopify laid off 2300 employees in 2023.
- In Europe, Flink laid off 8100 employees in 2023.
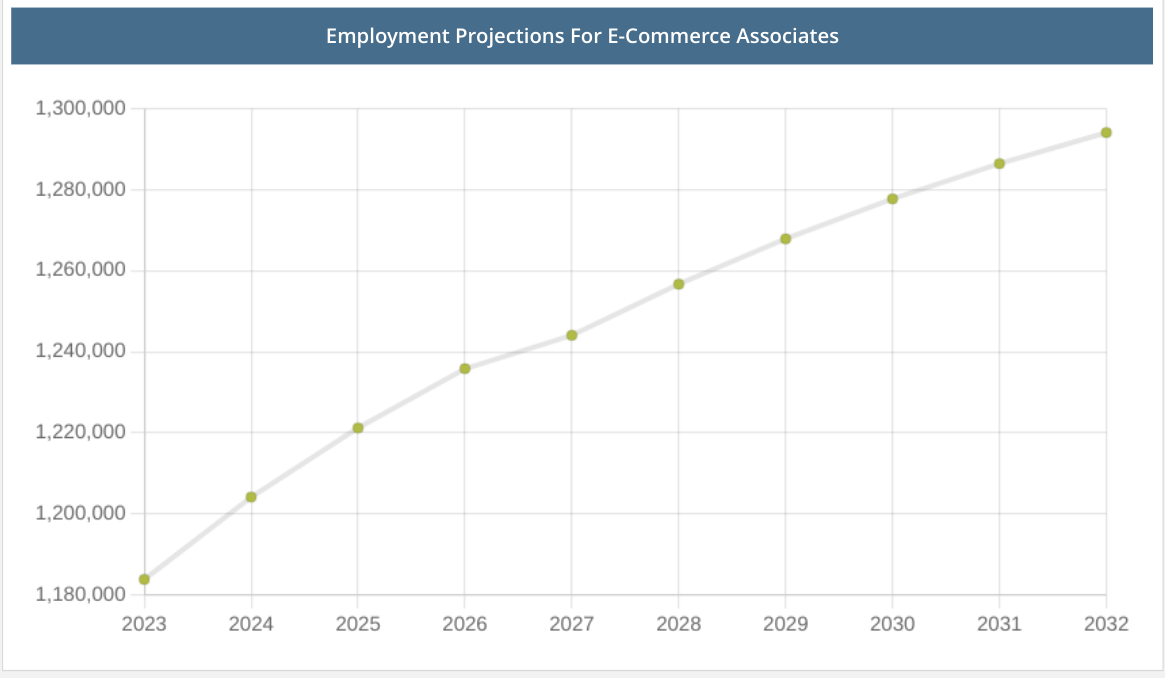
There were over 1,18 million jobs for ecommerce associates16 in the US in 2023, and it’s projected that 135,497 jobs will be added over the next decade, representing an 11.7% increase every year.
Between December 1997 and December 2016, employment in the ecommerce industry increased by 80%. In 2018, the US Bureau of Labor and Statistics estimated that there would be 450,000 jobs in the US17 by 2026.
Ecommerce marketplace statistics
Ecommerce marketplaces are websites that bring buyers and sellers together. As of January 2024, Amazon was the most visited ecommerce and shopping website globally18 with over 2.5 billion visits.
In second place was eBay with over 737 million visits. Moving up 5 positions to the fourth spot on Similarweb’s rankings was rising star Temu with over 503 million visits.
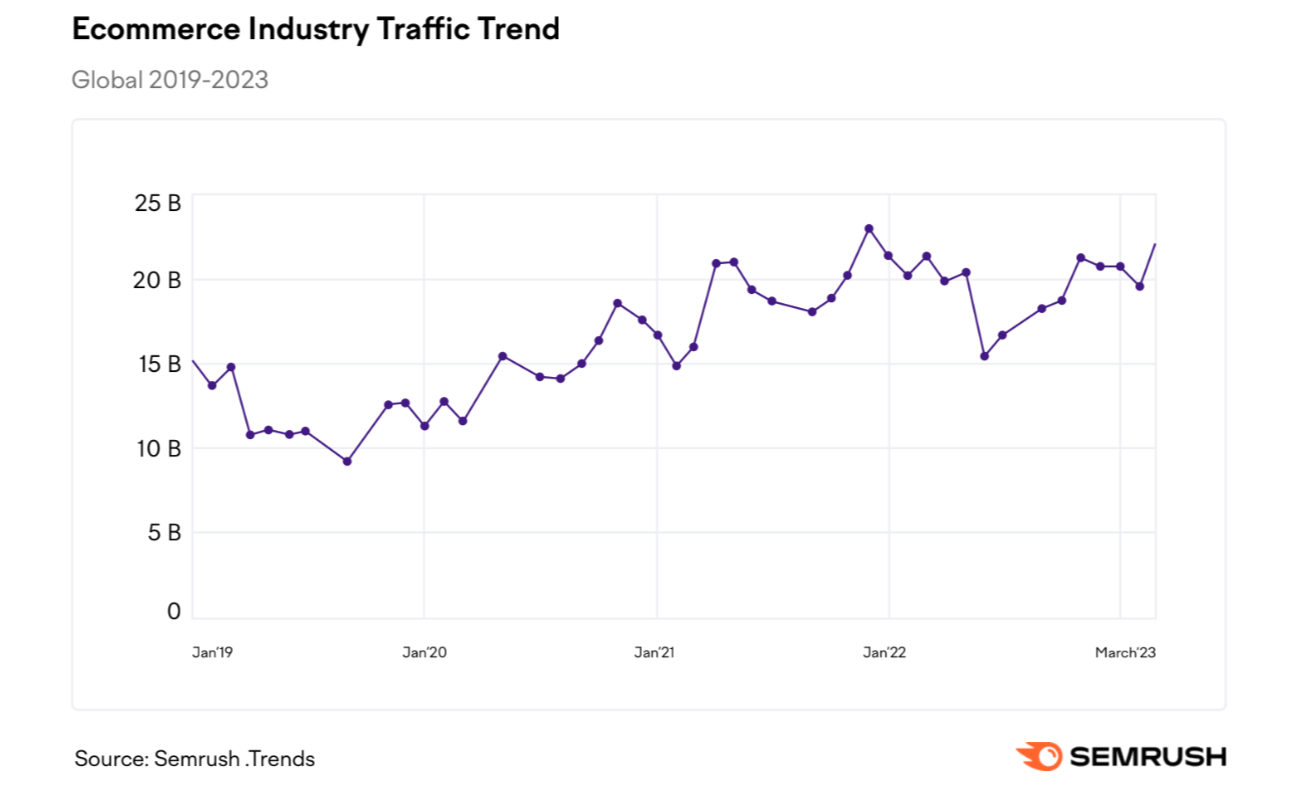
According to a 2023 report by Semrush19, global ecommerce traffic went up from 15 billion in January 2019 to over 22 billion in March 2023.
Overall, between 2019 and 2023, traffic to ecommerce marketplaces increased by over 47%
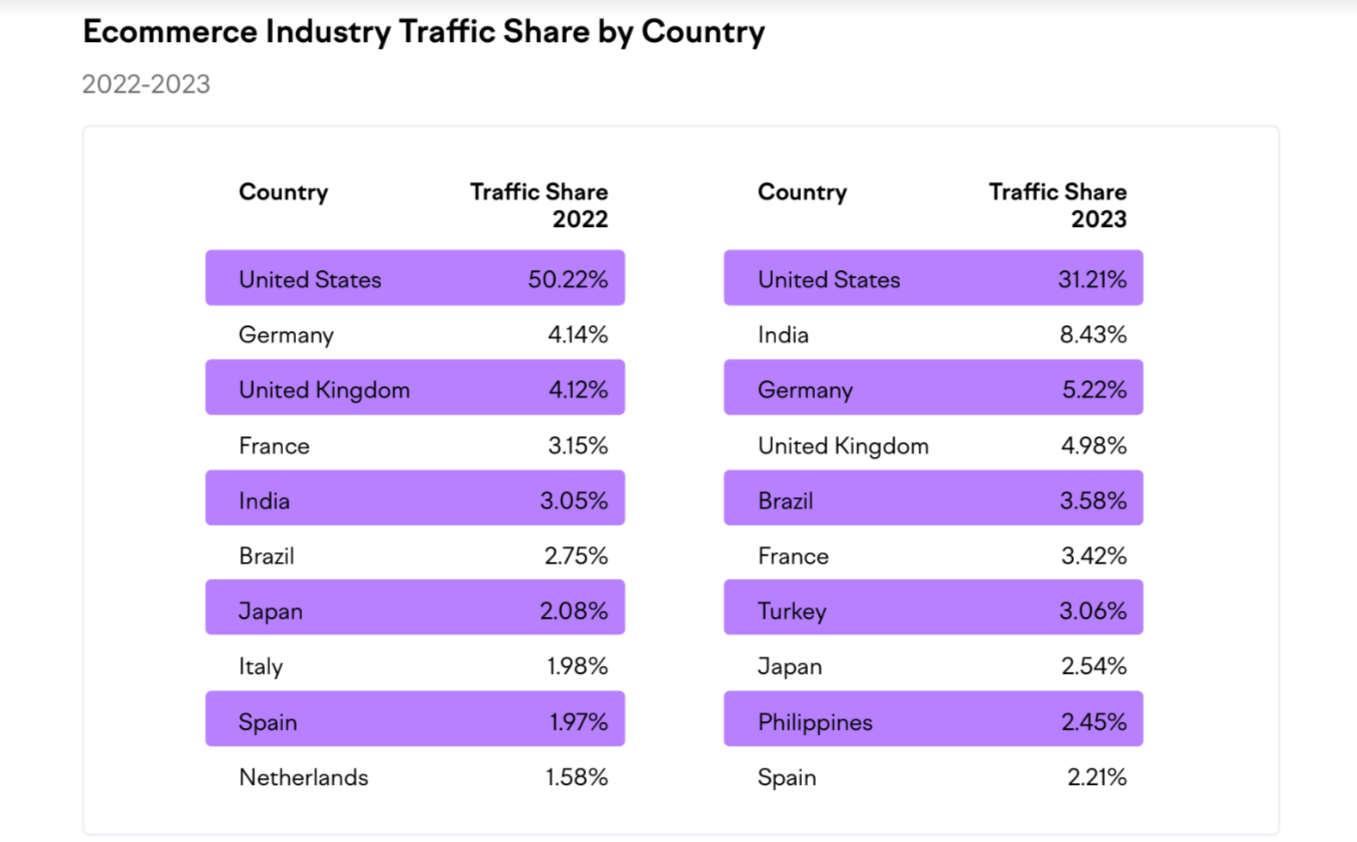
Looking at visits to ecommerce domains by country, the same report revealed that:
- The US, while in the lead, saw a 19% decrease in traffic from 50% in 2022 to 31% in 2023.
- India, in second place, saw the biggest jump in traffic from 3% in 2022 to over 8% in 2023.
- In third place, Germany’s traffic share increased from 4% to 5% in 2023.
- The UK, in fourth place, saw a slight increase in traffic share from 4.1% to 5%.
Additionally, with 2.5% of global traffic share in 2023, the Philippines entered the top 10 list for web traffic to ecommerce domains, representing one of the fastest-growing ecommerce markets in the world.
Meanwhile, EU countries Spain, Netherlands, and Italy all saw their traffic shares decrease in 2023, losing their positions on the top 10 list.
In terms of the top 10 ecommerce industry players, Amazon.com had the largest share of traffic with over 1.92 billion average monthly visits in March 2023. This was followed by Walmart with over 712 million monthly visits and eBay with over 478 million visits.
Among the three traffic giants, Walmart experienced the biggest boost in traffic share with a 39% increase in visits between 2022 and 2023. This was followed by eBay which saw a 13% increase in traffic during the same period. While it holds the top spot in traffic share, Amazon experienced a 9% drop in traffic share year-over-year.
In December 2023, The Temu app drove more engagement20 than major competitors such as Amazon and AliExpress.
Temu users spent an average of 18 minutes shopping on the app in Q2 2023, almost 2x the amount of time spent on:
- Amazon - 10 minutes
- AliExpress - 11 minutes
- eBay - 11 minutes
Younger consumers in particular spent an average of 19 minutes on Temu’s app.
The key to Temu’s impressive engagement includes the use of games that give users a chance to win rewards.
As of Q4 2023, the most popular online marketplace in the US was Amazon with over 53% of consumers21 shopping on the site.
In second and third place were Walmart.com and Temu with 33% and 14% of US consumers respectively.
As of Q3 2023, 25% of US consumers shopped on Temu and Shein.
Newcomer sites Shein and Temu were considered the fastest-growing competitors in the US ecommerce space.
Ecommerce platform statistics
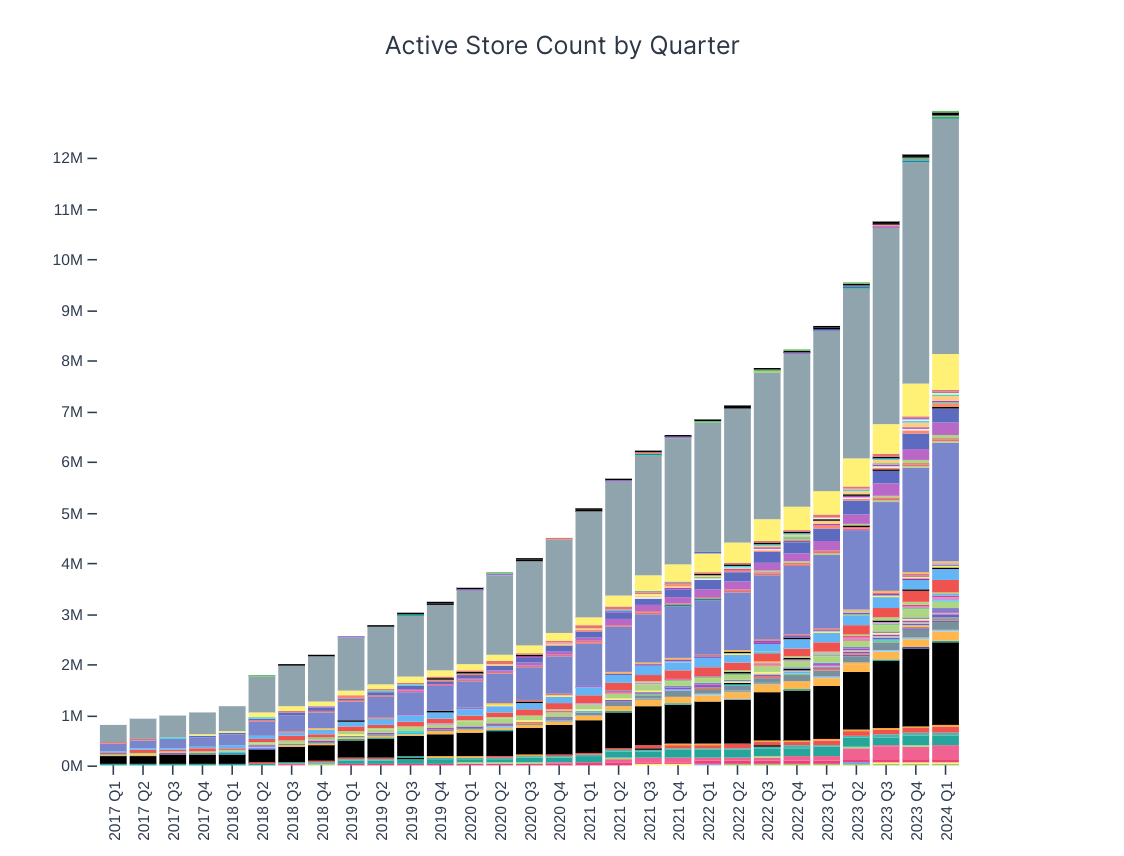
Ecommerce platforms empower online merchants of all sizes with the necessary infrastructure to sell their goods and services online. According to a 2024 Store Leads report22, where 12.9 million live online stores running on 100 different ecommerce platforms were tracked:
- WooCommerce was the leading ecommerce platform with 35% or around 4.7 million active stores.
- Shopify followed at 18% or over 2.3 million active stores. It also had the fastest growth rate, higher mindshare, and larger merchants on average.
- In third place with 12.7% or 1.63 million active stores was Custom Cart.
- With 682,800 active stores the Wix platform came in fourth place.
Additionally, quarter-over-quarter growth across all platforms increased by over 1000%.
In Q1 2017, 74,334 stores were added across all platforms. By Q1 2024 this had skyrocketed to over 869,676 stores.
According to the same report, the top 5 ecommerce stores worldwide were all powered by Custom Cart and were ranked as follows:
1. Amazon
2. Walmart
3. The Depot
4. Target
5. eBay
Mobile ecommerce statistics
As of 2023, smartphones accounted for almost 80% of all visits23 to retail websites.
The use of mobile devices in ecommerce grew at an unprecedented rate, surpassing online orders from desktops and tablets. In fact, the channel grew twice as fast as PC.
Data from Salesforce shows that as of Q4 2023, mobile traffic growth grew by 9%. This is contrasted by PC traffic which contracted by 5%.
Order value volumes on mobile also grew by 6%. On the other hand, order value growth on PCs fell by 3%.
Mobile ecommerce or m-commerce accounted for over 66% of total online sales in China and South Korea.
While mobile shopping is particularly popular in Asia it is yet to take hold in other regions.
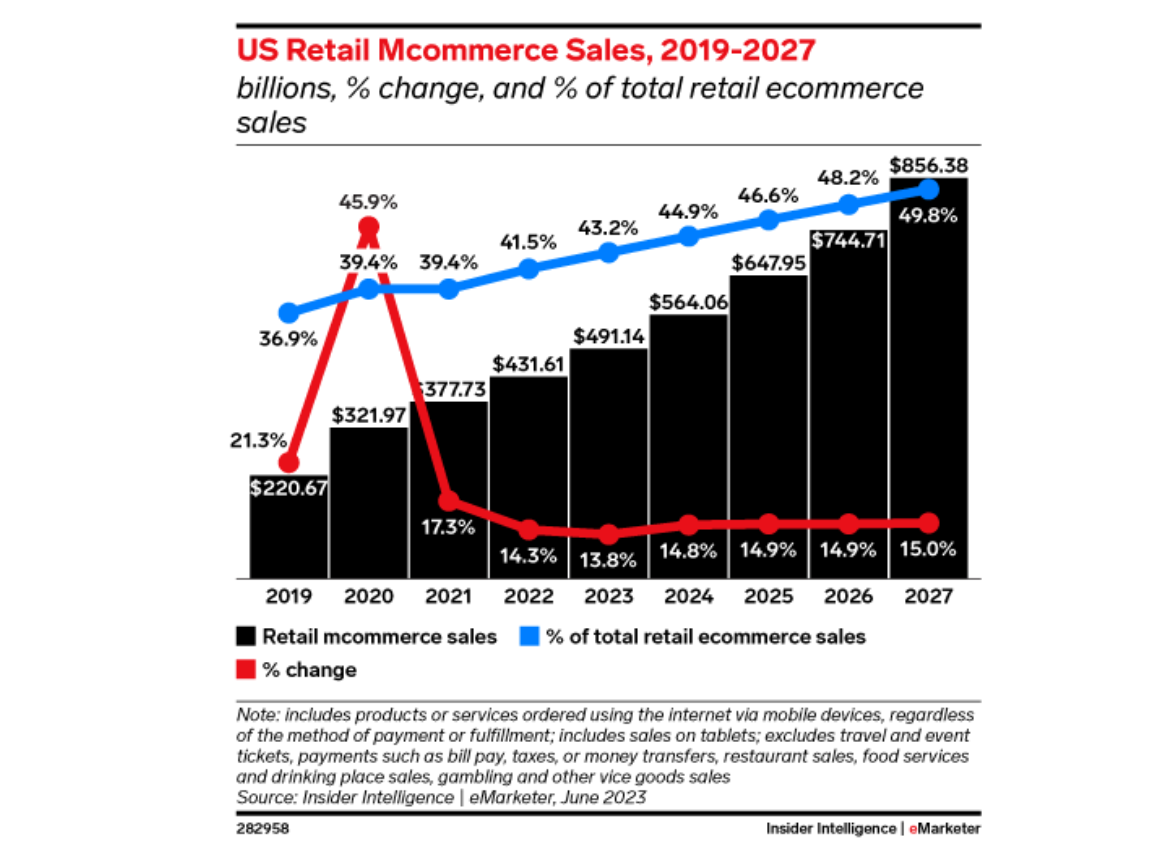
US retail mobile commerce sales increased by 123% from $221 billion to $492 billion between 2019 and 2023.
The largest percentage change during the period occurred between 2019 and 2020 when retail ecommerce sales increased by 45,9% from $221 million to $322 million. Conversely, the biggest dip in retail ecommerce sales came in 2021 when growth rates fell below 18% and stabilized.
Ecommerce marketing statistics
In 2024, 48% of online merchants plan to increase their marketing activity, while 38% intend to launch new products and services.
The exponential growth of ecommerce platforms, as well as the rising popularity of social and mobile commerce, has created a fiercely competitive 'attention economy.' Ecommerce players find themselves under immense pressure to engage and acquire customers.
Between 2019 and 2024, ecommerce spending on digital advertising in the US alone increased by 207%.
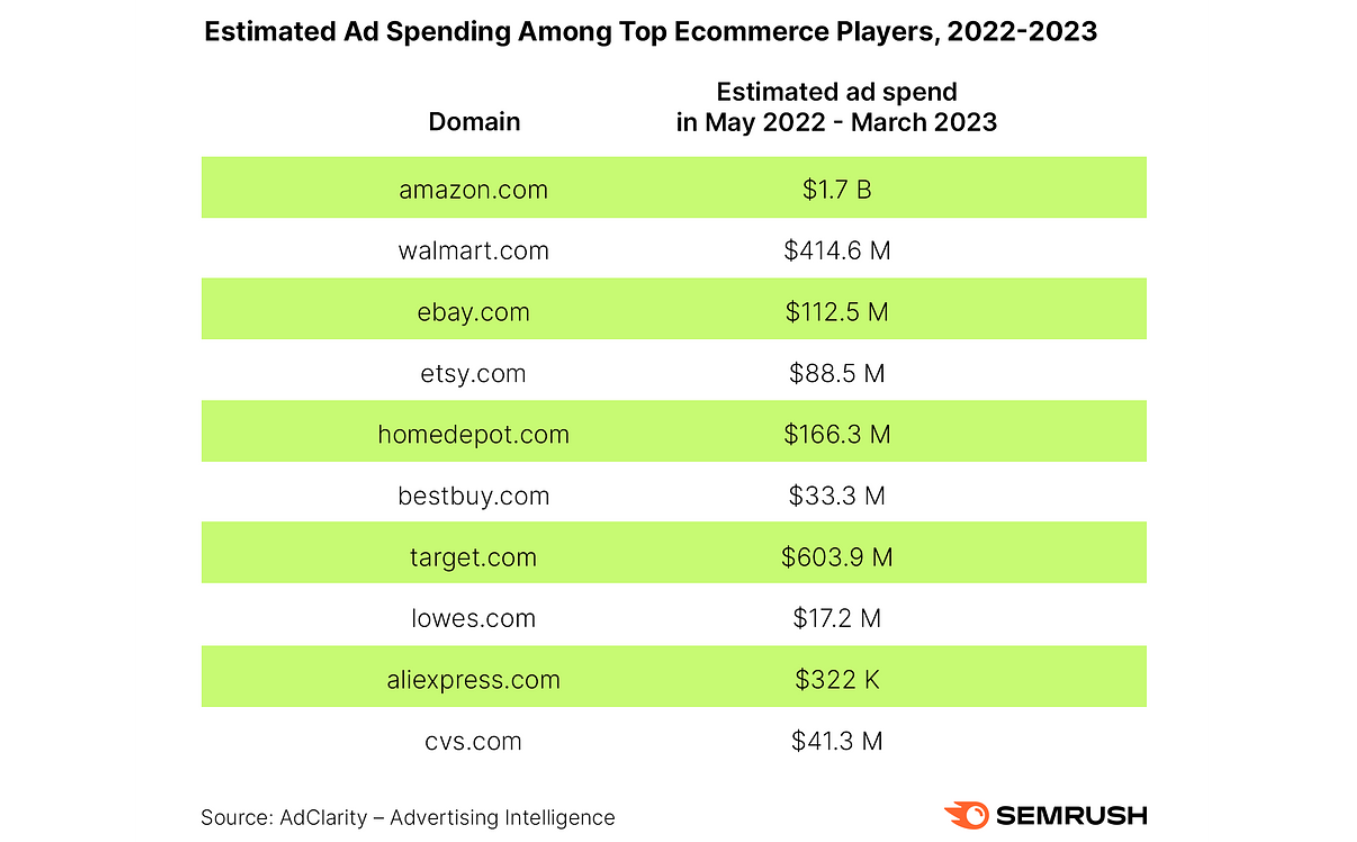
In line with steady industry growth, ecommerce ad spending in the US more than tripled from $12.5 billion in 2019 to $38.4 billion in 2024. Major spenders included top ecommerce players such as:
- Amazon - $1.7 billion
- Target - $603.9 million
- Walmart - $414.6 million
- Home Depot - $166.3 million
- eBay - $112.5 million
- Etsy - $88.5 million
Each major ecommerce marketplace has its own ad triggers that drive engagement and conversions. A Semrush report found that across all domains, “free shipping” and “store pickup” were effective trigger words. Examples of the key emotional triggers used in the digital ads of the top 3 ad spenders in the US include:
- Amazon
- Find deals
- Bestsellers
- Find best
- Target
- Free shipping
- Day delivery
- Store pick up
- Walmart
- Free shipping
- Low prices
- Store pickup
As of February 2024, email was the most used promotional channel by over 47% or 6.3 million of all active online stores tracked by Store Leads.
This was followed by channels such as:
- Phone (SMS) - 44%
- Instagram - 39%
- Facebook - 35%
- YouTube - 11%
- Twitter - 10%
- LinkedIn - 5%
- TikTok - 4%
- Pinterest - 4%
- WhatsApp - 4%
Data from Salesforce24 showed that despite its popularity, email lost ground from an 88% share of messages sent across all verticals in Q4 2021 to 84% in Q4 2023.
Meanwhile, the share of push, SMS, and over-the-top (OTT) grew from 12% in Q4 2021 to 16% of all messages sent in Q4 2023.
In terms of performance, the email channel remained relatively stable, with open rates between 19% in Q3 2022 and 21% in Q4 2023.
Click rates and bounce rates also remained stable at 0.7% and 0.4% respectively for the last quarter of 2023.
Overall, in the final quarter of 2023, the global conversion rate remained stable at 2.2%
The highest conversion rates were seen in the UK (3%), Netherlands (2.8%), and USA (2.6%). Additionally, the verticals with the highest conversion rates were:
- Food and Beverage - 3.7%
- Beauty and Skincare - 3.3%
- General Apparel - 2.6%
Social commerce statistics
Brands in China achieve conversion rates of up to 30% on social platforms.
This is up to ten times higher than the conversion rates in conventional ecommerce. Social commerce, which got its start in China, is driven by partnerships with social media influencers, and live-stream shopping.
In 2021, consumers in China spent 13% of total ecommerce gross merchandise value or $352 billion on social commerce.
That same year $37 billion in goods and services were purchased through social commerce channels in the US. In 2023, this number exceeded $80 billion or 5% of total US commerce.
Ecommerce technology statistics
According to Store Leads, the top third-party technologies run on online stores as of February 2024, were:
- Cloudflare - 4 million stores
- Google Tag Manager - 3.9 million stores
- Google Adsense - 3.7 million stores
- Cloudflare CDN - 3.6 million stores
- Facebook Pixel - 3.2 million stores
In a 2023 GFK report, 81% of online-only retailers25 planned to invest in AI and Machine learning, while 44% planned to invest in robotics. A further 33% planned to invest in AR and VR, beyond 2023.
The expected benefits of AI and ML as selected by the online retailers surveyed included:
- Demand Forecasting - 65%
- Personalization - 79%
- Pricing Strategy - 60%
- Optimizing Logistics - 54%
- Automating Inventory management - 54%
23% of global consumers26 used the metaverse to make purchases online in 2023.
A further 22% said they hadn't used the metaverse to buy products online but intended to in the future. 34% said they had never used the metaverse and that they didn’t intend to use it in the future.
When it came to programmatic commerce or AI re-ordering on behalf of consumers, 14% of consumers27 said they currently used it to support their purchases.
15% of consumers said they had used AI in this manner in the past, while 31% said they had never used AI to support their purchases and never would.
Ecommerce and AI statistics
As of Q3 2023, 97% of commerce organizations28 considered the use of AI.
However, challenges around strategy, security, and data management stood in the way of implementation.
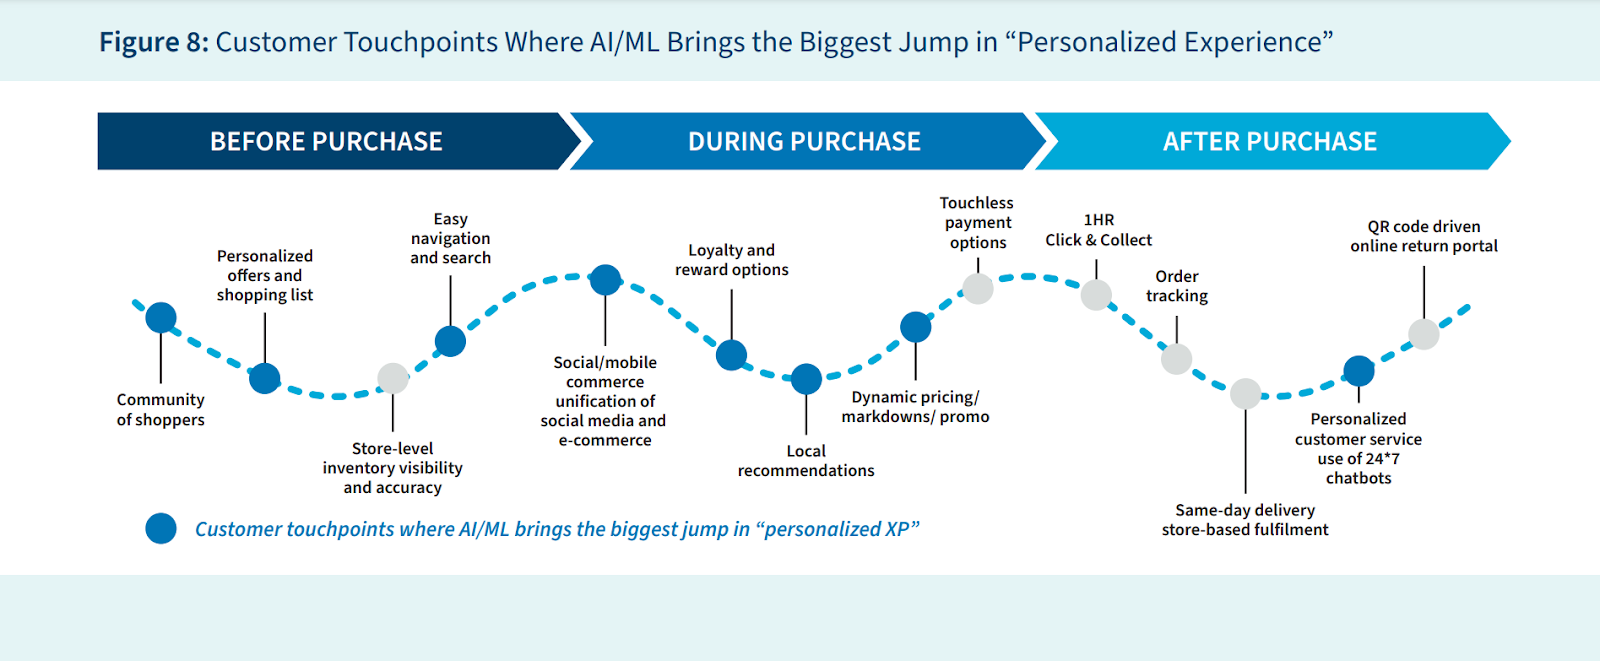
In a 2023 research report by FTI Consulting, around 80% of online shoppers were open to AI-driven personalization and believed it would enhance their shopping experience.
AI-powered personalization presents a cutting-edge opportunity for industry players to reach, target, and convert more consumers.
- 75% of consumers were very interested in receiving personalized experiences.
- 70% were likely to switch to competitors that offered better personalized experiences.
- 77% of respondents were interested in personalized content focused on discounts, while 69% were interested in local recommendations and offers.
The same report also revealed that despite the high interest levels in AI-driven personalization, only 48% of consumers felt comfortable sharing their personal data.
In addition, only 38% of respondents felt retail platforms could be trusted with personalization. A further 51% of respondents were also concerned about racial/gender recommendations.
To manage these concerns, 62% of consumers said they preferred the ability to control personalization via privacy settings.
Additionally, 58% preferred to have businesses provide them with the flexibility to control data collection and usage, while a further 58% preferred to have the ability to opt out of receiving personalized content
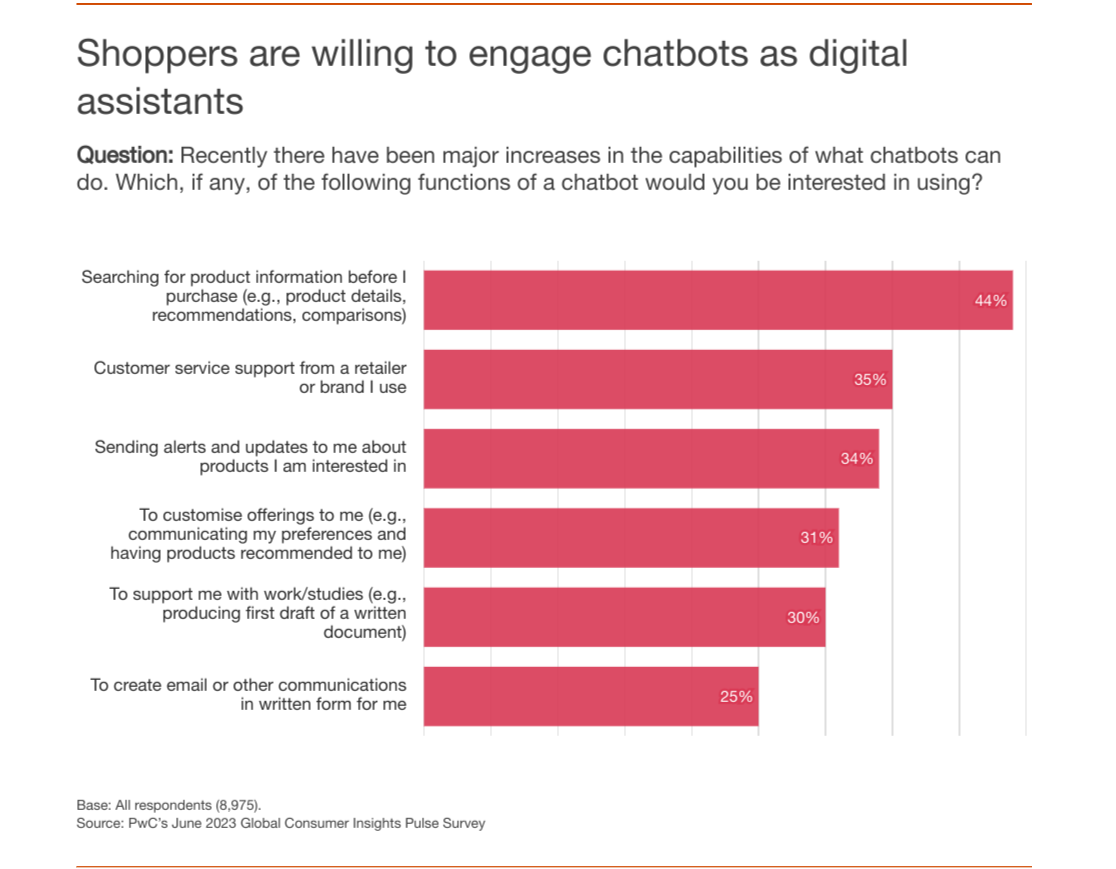
2023 research conducted by PwC revealed that a notable 44% of consumers were interested in using chatbots29 to search for product information before buying.
In terms of consumers' willingness to adopt generative AI:
- 35% said they would use chatbots for customer support.
- 34% said they would look to chatbots for alerts about delivery times and product availability.
- 31% were interested in AI for personalized communications.
B2C ecommerce statistics
93% of consumers30 in 2023 expected online shopping to be better than in-person shopping.
However, 91% of consumers encountered problems shopping online. These included:
- Poor site performance - 33%
- Lack of findability - 32%
- Missing product information - 27%
- Disorganized navigation - 26%
- Lack of mobile-friendliness - 25%
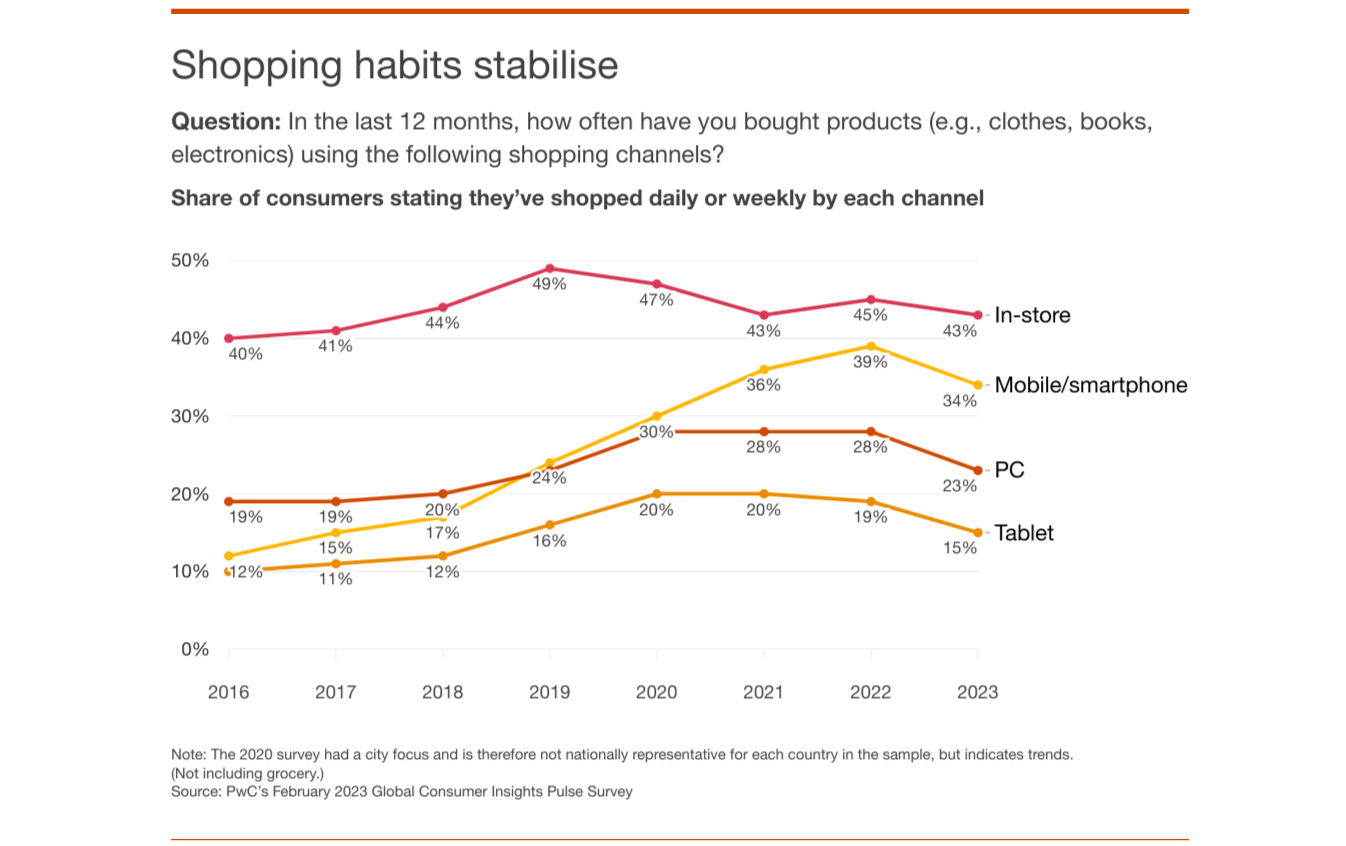
In a 2023 PwC survey, 72% of consumers used online channels for their weekly shopping.
Of these online channels:
- 34% shopped on mobile/smartphone
- 23% shopped on PC.
- 15% shopped on a tablet.
35% of all online shopping globally happened on marketplaces in 2023, down from 42% in 2021.
In second place were supermarkets and grocers, where 15% of all online shopping occurred. This was followed by branded websites ( Nike, Apple, Samsung, etc)
In June 2023, 50% of consumers said they intended to boost their online spending over the next 6 months.
In a similar study by Jungle Scout, 19% of consumers increased their overall spending in Q4 2023 while more budgets (45%) leveled than decreased, marking the highest percentage in two years.
Additionally, consumers bought more groceries (26%), clothing (16%), and cleaning supplies (14%) in Q4 2023.
Meanwhile, consumers bought less:
- Electronics (35%)
- Home and kitchen (34%)
- Garden and outdoor (32%)
As of Q4 2023, 60% of Gen Z and 55% of Millennial consumers expected to shop on Black Friday, compared to 30% of Boomers and 36% of Gen Xers.
The above stats represent a shift in the market; major sales events such as Black Friday and Cyber Monday are attracting younger shoppers.
In 2023, 91% of shoppers said that ratings, reviews, and testimonials were very important31 when deciding what to buy online.
At 20%, family members had the most influence on consumers' online spending decisions. This was followed by friends (17%) and social media influencers/bloggers (16%).
Ecommerce delivery statistics
As of 2024, 55% of consumers across all markets expected delivery to arrive within just 48 hours.
That's a 5% increase compared to 2023. Consumers in key markets such as Italy, Canada, and Australia drove this demand.
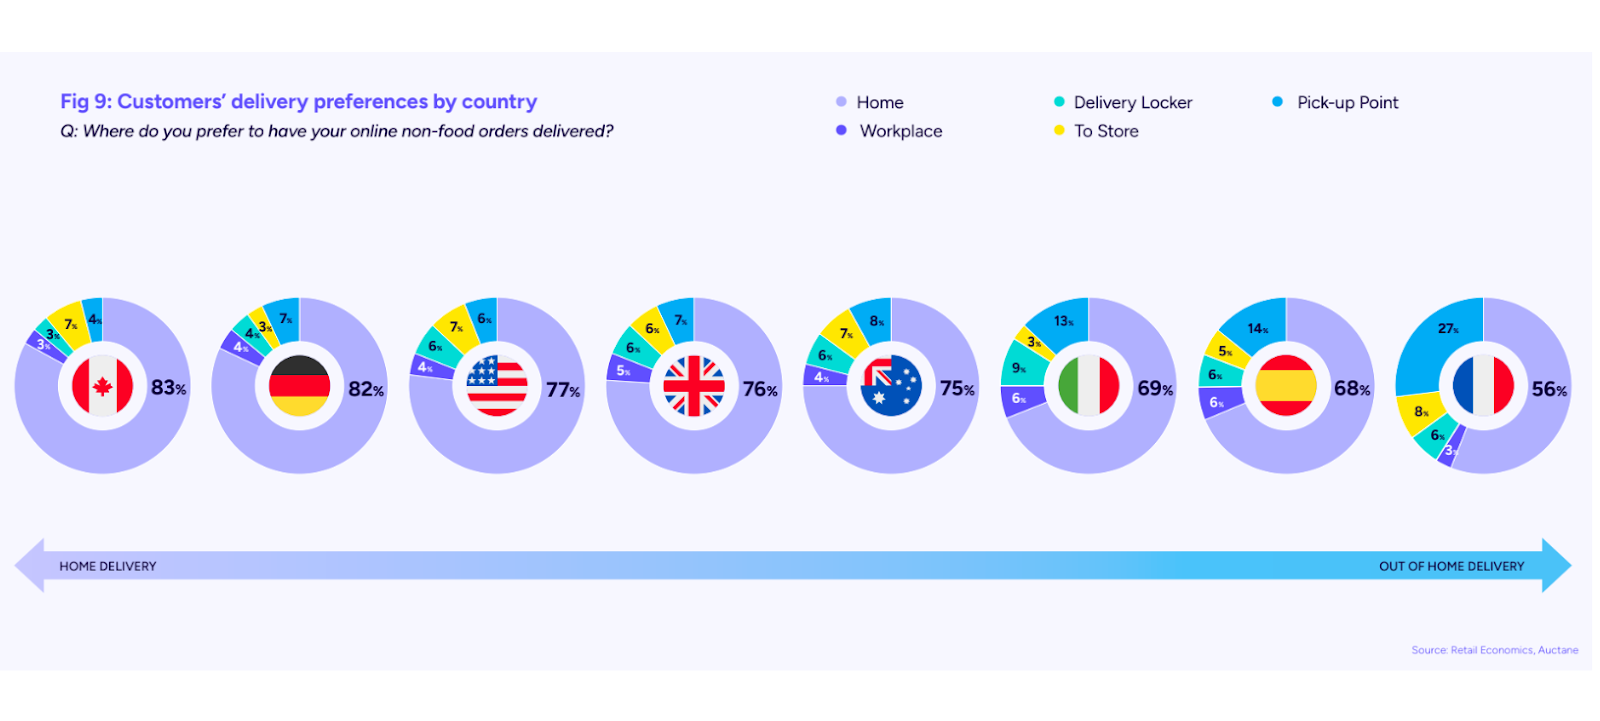
Meanwhile, 73% of online shoppers selected home delivery as their go-to option.
However, out-of-home (OOH) delivery options such as lockers, click-and-collect, and other pick-up points took hold. The EU market drove this demand, with shoppers from Spain and France showing the most diversified delivery preferences.
In terms of delivery priorities for 2024, 35% of customers identified the cost of delivery as the most important factor, a 10% increase from 2022.
Other key factors included:
- Speed of delivery - 23%
- Convenience - 16%
- Flexible returns - 13%
- Delivery visibility and tracking - 9%
64% of digital natives or shoppers under 45 were willing to pay a premium for same-day delivery.
A further 55% were willing to pay for next day or chosen day delivery.
Over 50% of consumers31 expected online delivery to be carbon-neutral.
60% of online consumers in the UK and US were concerned about over-packaging, particularly when it came to fashion items.
Ecommerce returns statistics
Research by the NRF32 found that online returns accounted for 17.6% or $247 billion of total retail returns in 2023.
The same report found that the amount lost on returns abuse and fraud was over $101 billion.
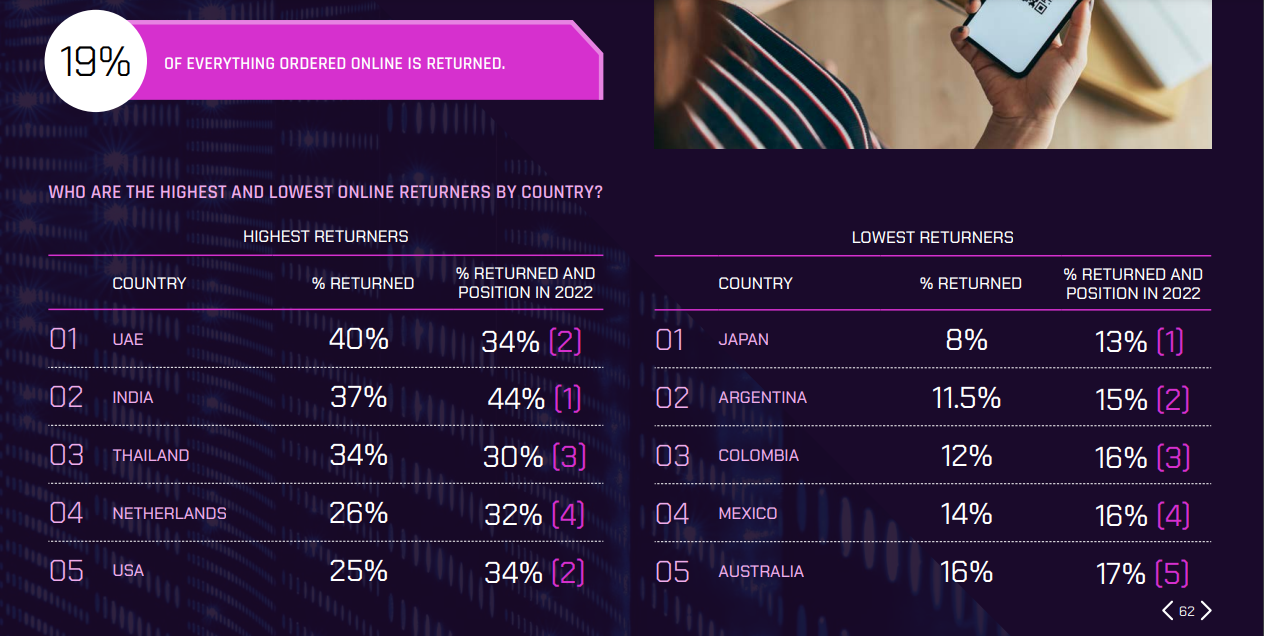
19% of everything ordered online was returned in 2023, a slight decrease from 23% in 2022.
The shift came as more online retailers made a U-turn on free returns, citing major financial losses.
35% of global consumers admitted to over-ordering online items with the intent of returning them.
Additionally, 25% of shoppers identified as frequent returners33, sending back 10% of the items they bought online.
60% of shoppers checked a returns policy before making a purchase.
As many as 49% of shoppers didn’t make a purchase because of a returns policy.
In 2021, over 4 billion tons of returned items ended up in landfills in the US.
Additionally, simply transporting these items produced 27 million metric tons of carbon dioxide emissions that year, nearly doubling the amount registered in 2020.
Ecommerce payment statistics
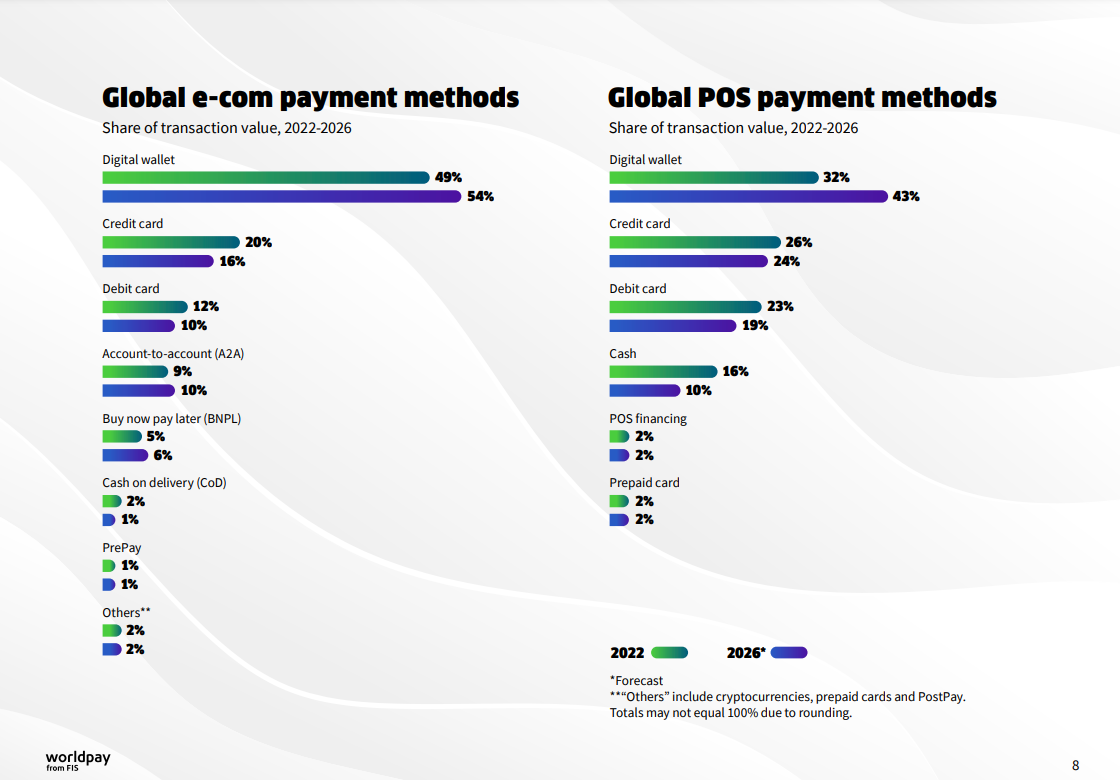
A 2023 report by FIS Global34 found that digital wallets like Paypal, Apple Pay, and Google Pay, which accounted for 49% of ecommerce payment transactions, were the most popular choice for global consumers.
Credit cards came in second place with a 20% share of transaction value. This was followed by:
- Debit cards - 12%
- A2A (Account to Account) - 9%
- BNPL (Buy Now Pay Later) - 5%
- COD (Cash on Delivery) - 2%
By 2026, digital wallets' share of transaction value will hit 54%.
In 2023, 56% of consumers35 were permanently put off a site that didn't offer their preferred payment method.
Along with multiple payment methods, customers also sought out a faster, frictionless checkout process.
In terms of other payment methods, 44% of shoppers globally said they wished more online businesses accepted cryptocurrencies in 2023.
A further 47% of shoppers said they liked the idea of using their biometrics to pay, although this was slightly down from 50% in 2022.
D2C ecommerce statistics
63% of consumers purchased products directly from a brand’s website in 2023.
A large number of consumers chose to skip middlemen or marketplaces and bought directly from their favorite brands in 2023.
- 85% of consumers liked being able to buy cutting-edge technology as soon as it was available.
- 50% of consumers were drawn to the authenticity of products such as clothing, beauty, and personal care items on D2C websites.
- 47% cited the availability of more options as another motivator.
- 43% identified competitive pricing and better stock availability as their key purchase drivers.
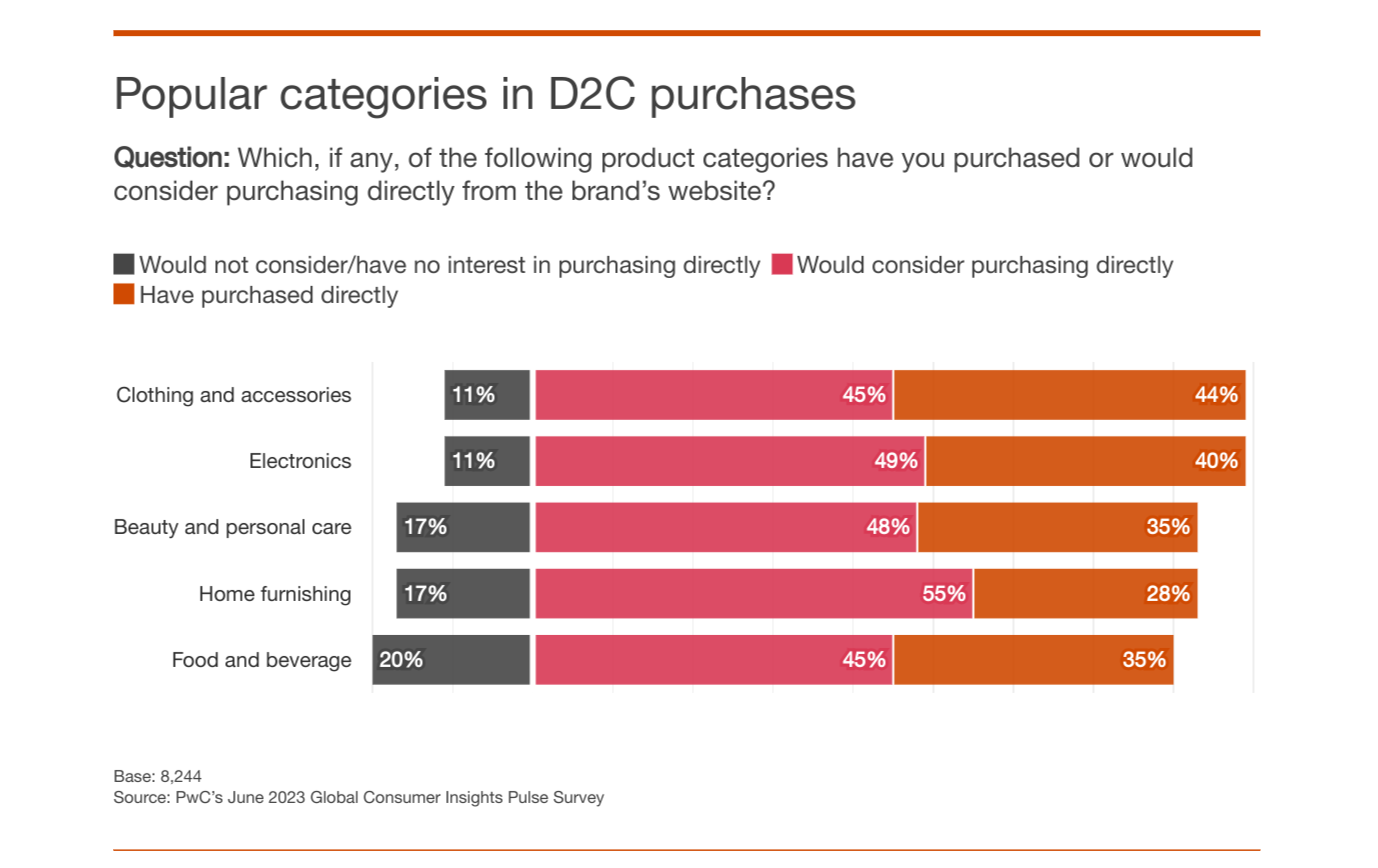
The same report found that the popular D2C categories were Clothing and Accessories (44%) and Electronics (40%).
In addition, 85% of consumers planned to increase their spending across over 11 product categories including home furnishing, food and beverage, and more in the last half of 2023.
56% of shoppers had a subscription in 2023, up from 44% in 2021.
Globally, the average consumer had 1.24 subscriptions (excluding Netflix and Sky). The UAE led the pack as 75% of consumers had a subscription and around 1.65 subscriptions per consumer.
Between 2012 and 2019, subscriptions increased by over 300%.
By 2020, over 75% of D2C companies offered subscriptions.
B2B ecommerce statistics
As of June 2023, 65% of B2B companies across industries offered ecommerce capabilities, up from around 53% in 2021.
The uptick in ecommerce as a key corporate purchasing gateway signified a growing preference for ecommerce channels over in-person selling. In addition:
- Over 66% of corporate customers preferred digital or remote engagement.
- More than 80% of B2B companies said they held their ecommerce channel in high regard.
- Over 33% of businesses were willing to spend $500,000 or more on digital channels, with 15% saying they were willing to spend over $1 million online.
- 60% of B2B buyers said they were open to purchasing on digital marketplaces.
Ecommerce cybersecurity statistics
As of January 2024, the ecommerce fraud and prevention market was valued at $48 billion36.
This is up from $36.7 billion in 2021. By 2027, the market is projected to hit $100 billion.
Additionally, in 2023, losses due to online payment fraud were expected to exceed $48 billion.
This is up from $41 billion in 2022, with losses forecasted to exceed a staggering $343 billion37 by 2027.
According to Mastercard, North America had the largest volume of fraudulent transactions, accounting for 42% of global ecommerce fraud38 in 2023.
The US emerged as the most fraud-prone country with over 34% of consumers admitting they had been victims of fraud. In second place was Europe, accounting for 26% of global fraud value.
According to the same research, the key fraud types affecting both merchants and customers were:
- Promo Abuse
- Friendly Fraud
- Account Takeover
- Triangulation Fraud
- AI-powered Malware, and Phishing
Ecommerce sustainability statistics
As of January 2024, over 50% of consumers perceived ecommerce as harmful to the environment.
Additionally, 71% of consumers revealed that they planned to make more sustainable purchasing decisions39 throughout the year.
52% of consumers changed their shopping habits because of concerns about the environment and global warming.
The report further found that:
- 59% of consumers tried to purchase from brands with ethical labor practices.
- 56% tried to buy organic and fair trade products or materials.
- 60% opted for companies with supply chain transparency.
- 66% of consumers wished that brands and retailers had better environmental practices.
- 69% wished online orders used less packaging.
80% of consumers were willing to pay up to 5% more for sustainably produced goods.
The same report found that 50% were willing to pay 6% - 10% more, while 30% were willing to pay over 10%.
Launch your ecommerce business with Whop!

If one thing is clear, it's that the ecommerce industry is growing at a rapid rate. The global ecommerce market is expected to reach $7 trillion by 2025, and $17 trillion by 2032!
So why not join this booming industry by launching your own ecommerce business? With Whop, launching your ecommerce business is simple. It takes less than 10 minutes to sign up as a seller on Whop, and you can get your digital products on thriving online marketplace. Plus, Whop handles everything from payment processing to fulfillment, so that you can focus on your product.
Sign up as a seller with Whop today and harness the power of the growing ecommerce landscape.
Sources
Reference List
- Fast Company
- Insider Intelligence
- McKinsey
- Insider Intelligence
- Statista
- Statista
- Statista
- PR Newswire
- FTI Consulting
- Statista
- Retail Economics
- Statista
- CompaniesMarketCap
- Talent.com
- Statista
- Franklin University
- BLS
- Similarweb
- Semrush
- Insider Intelligence
- Jungle Scout
- Store Leads
- Statista
- Salesforce
- GFK
- MMA Global
- Salesforce
- PwC
- Coveo
- Fedex
- Statista
- NRF
- Asendia
- FISGlobal
- Checkout
- Statista
- Juniper Research
- Mastercard
- PR Newswire