Discover over 100 social commerce statistics you need to know including revenue, buyer behavior, and more.
Key takeaways
- Social commerce will explode from $700 billion in 2024 to $8.5 trillion by 2030, becoming the top sales channel by 2029.
- Gen Z and Millennials drive 62% of social commerce spending, making younger audiences essential for brand strategy.
- Influencer marketing delivers $6.50 per $1 invested, with 62% of marketers prioritizing social commerce in campaigns.
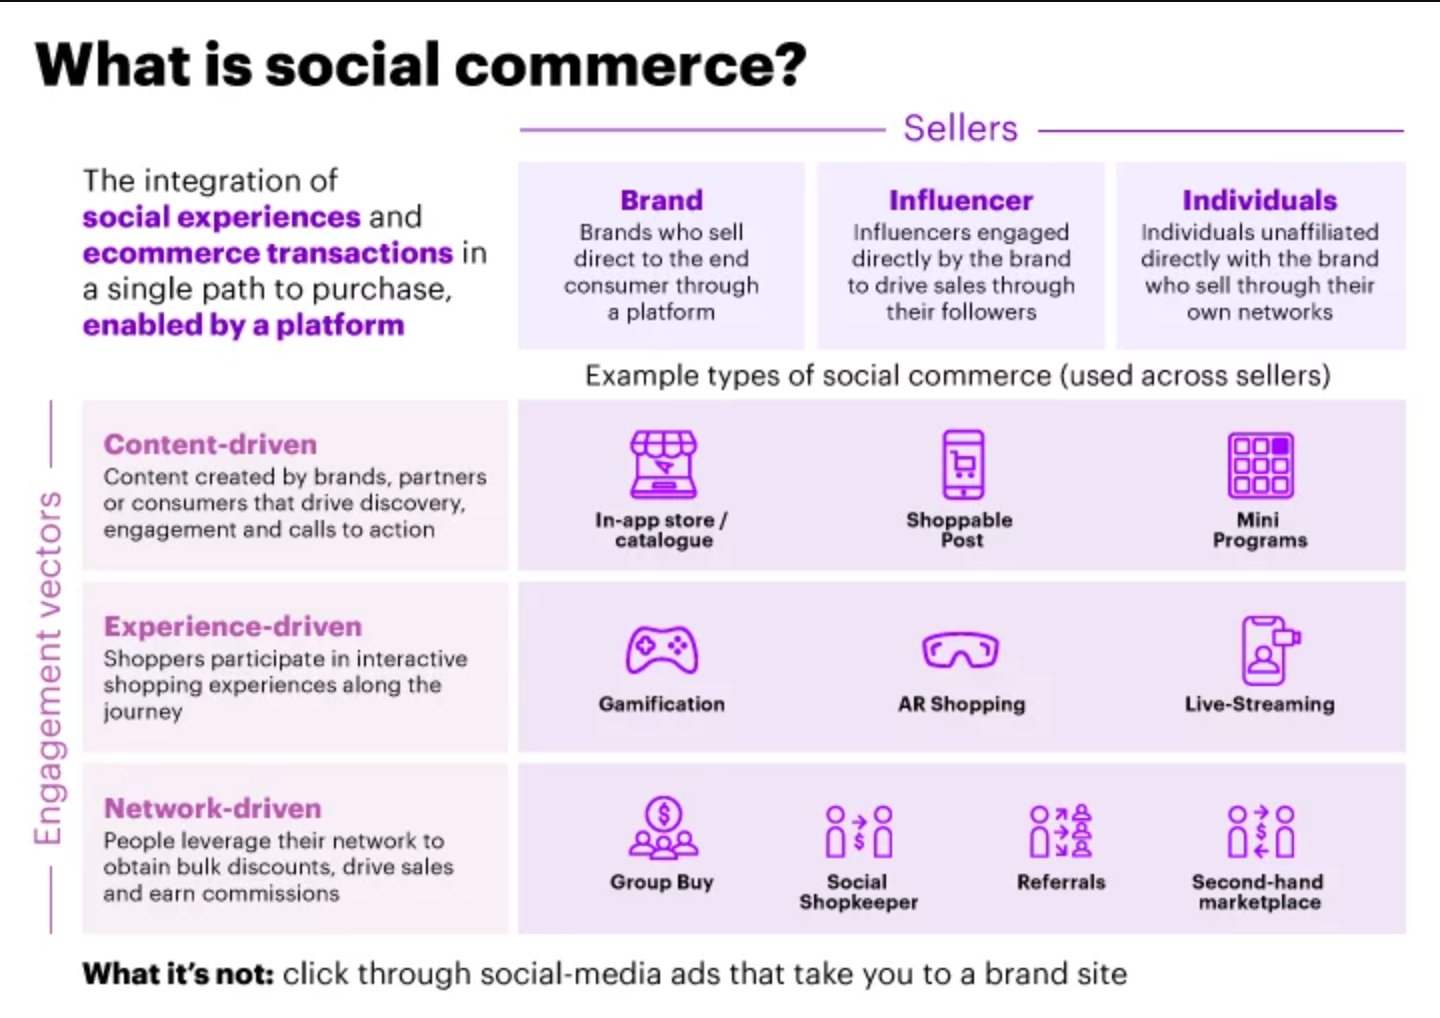
Social commerce or the dynamic pairing of ecommerce and social media, has taken the online shopping industry by storm, transforming how consumers shop. For businesses, this booming trend has unlocked a lucrative revenue stream projected to hit $1 trillion in 2025 and exceed $8 trillion by 2030.
At Whop, we've compiled over 100 social commerce statistics to help guide your strategic efforts.
Keep reading to uncover key insights related to social buyer behavior, social commerce growth, and more.
Social commerce industry statistics
Social commerce started in 2005 and saw major social platforms like Facebook and Instagram facilitate online buying and selling between users1.
More recently, platforms have enabled businesses to set up digital storefronts, allowing users to discover products, engage with brands, and make purchases without ever leaving the platform.
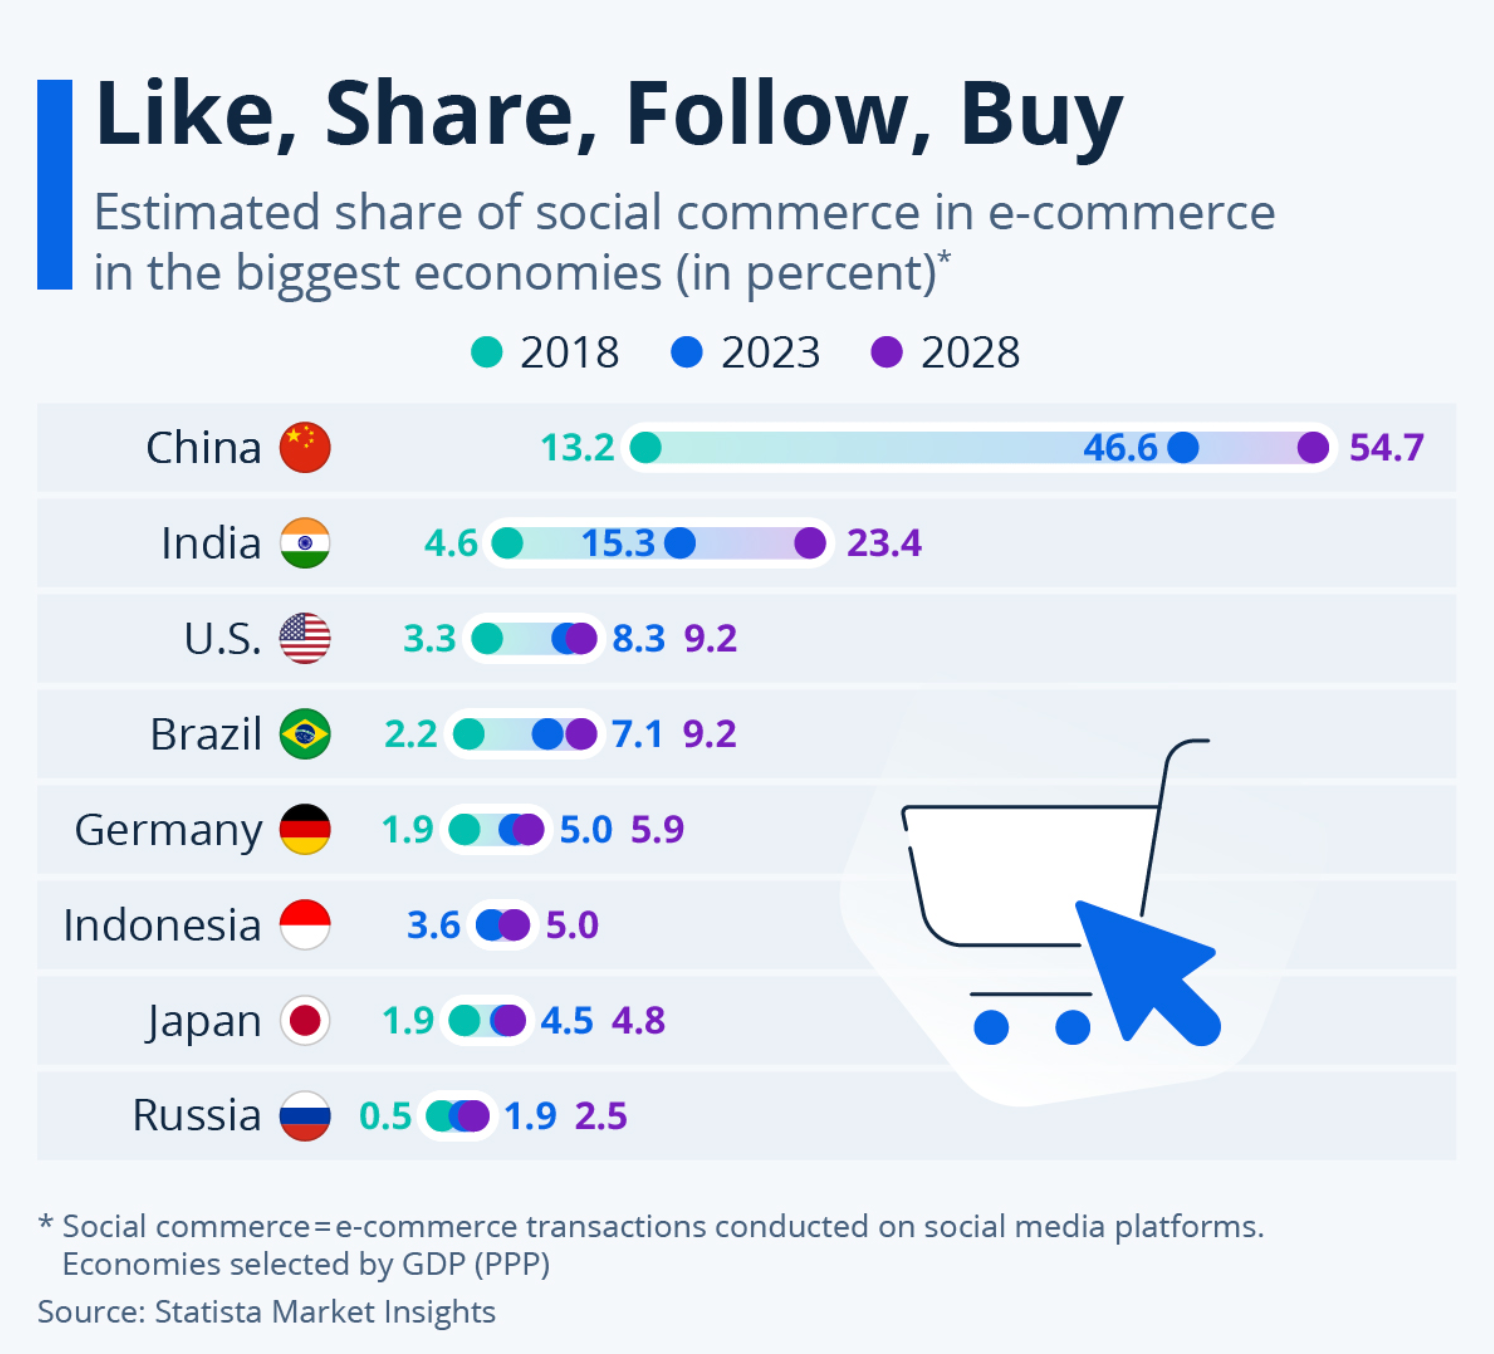
In 2016, social commerce emerged as a popular shopping channel in China, growing by over 52% to hit $350 billion or 13% of ecommerce sales in the country2.
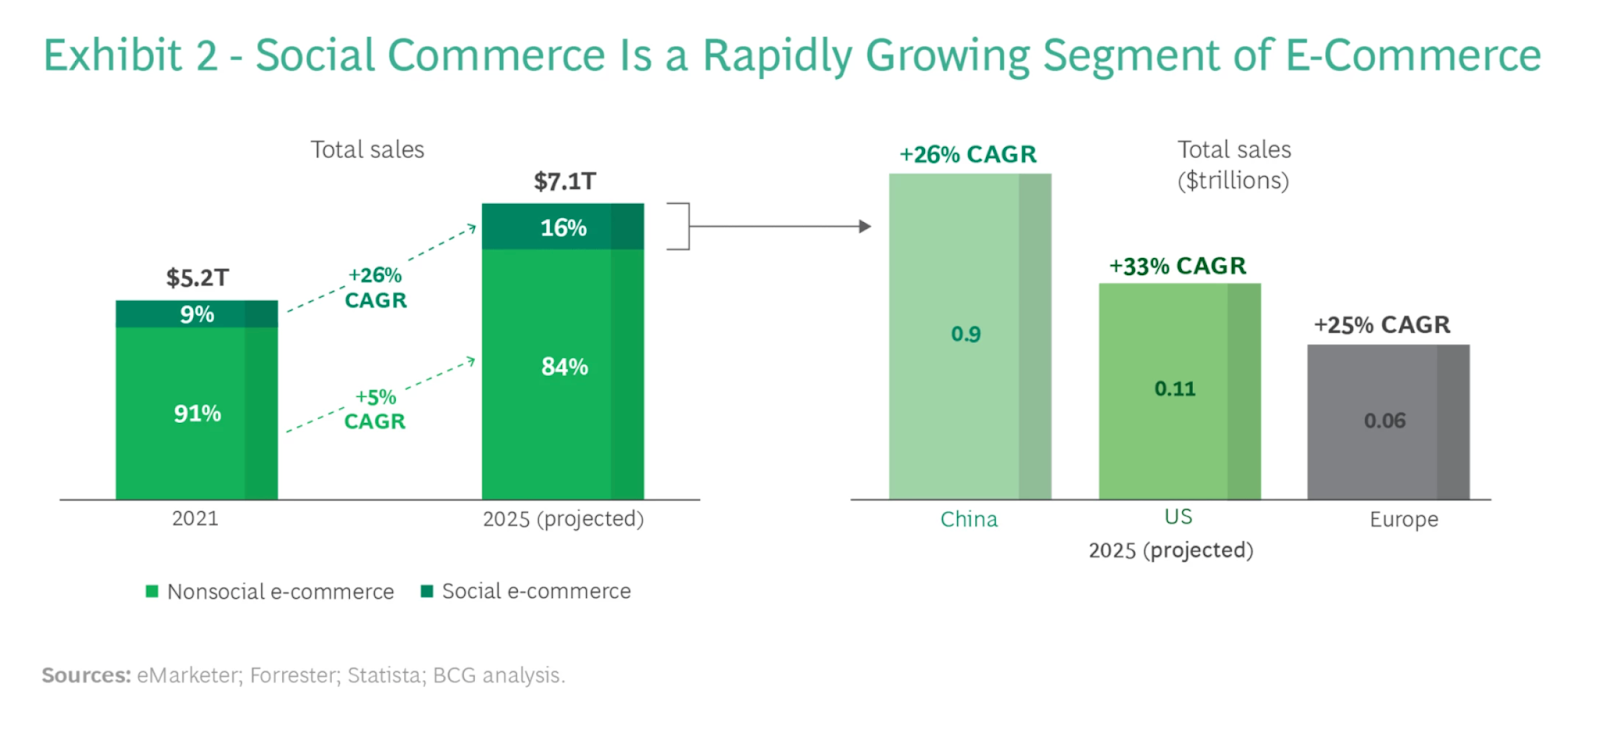
In Western markets, social commerce has only recently begun to take hold, with growth rates of between 25-33% expected between 2021 and 2025.
In 2021, social commerce accounted for 9% of the $5.2 trillion ecommerce industry.
That year, there were over 109 deals involving social commerce companies, representing $8 billion in capital versus 49 deals involving less than $1 billion in 2016.
In 2024, the penetration rate of social commerce was expected to hit 25%, up from 23.6% in 20233.
This was driven by the increasing number of social media users, who as of 2024 breached the 5.1 billion mark, or over 64% of the world’s population.
The percentage of consumers who made use of social commerce was highest in China at 95%.
In second and third place were Thailand (94%) and Peru (92%), followed by:
- Colombia at 91%
- India at 91%
- Indonesia at 88%
Meanwhile, social commerce rates were lowest in Germany (42%), France (45%) and Italy (48%).
Social commerce levels were also low in the UK and US with 53% and 56% of consumers making use of the channel, respectively.
In 2024, social commerce accounted for an estimated 19% of global ecommerce4.
Highlighting the growing popularity of social commerce, this was up from:
- 9.7% in 2020
- 12.1% in 2021
- 16% in 2022
- 19% in 2023
Globally, social media emerged as a key shopping channel in 2023, with an average of 14% of shopping journeys starting on social media5.
Australia had the highest number of consumer shopping journeys starting on social media at 21%.
Meanwhile:
- In the US, Norway, and New Zealand 19% of shopping journeys started on social media.
- In France, 16% of social media journeys kicked off on social media, this was followed by the UK, and Germany at 15%
- In the Netherlands, Belgium, Sweden, and Poland, 14% of shopping journeys started on social media.
Additionally, 29% of Gen Z consumers (aged 18-26) were more likely to start their shopping journeys on social media versus 21% of Millennials (aged 27-42) and 9% of Gen X (aged 43-58).
In Australia and the US, brand social media accounts had the highest chance of inspiring shoppers to engage in social commerce at 70% and 69% respectively.
Meanwhile, in Greece (73%), Portugal (71%) and New Zealand (68%), retailer social media accounts had the most influence on social commerce.
Influencer accounts also had an impact on social shoppers' decision to engage in social commerce.
In the US, 46% of social shoppers followed and purchased directly from influencer accounts. This was followed by social shoppers in Australia (42%), Germany (44%), and the Netherlands (44%).
Social Commerce Growth Statistics
Social commerce is the future of online selling with 49% of brands planning to increase their social commerce investment in 2024.
By 2030, the social commerce industry is predicted to grow by 31% per year to reach $8.5 trillion6.
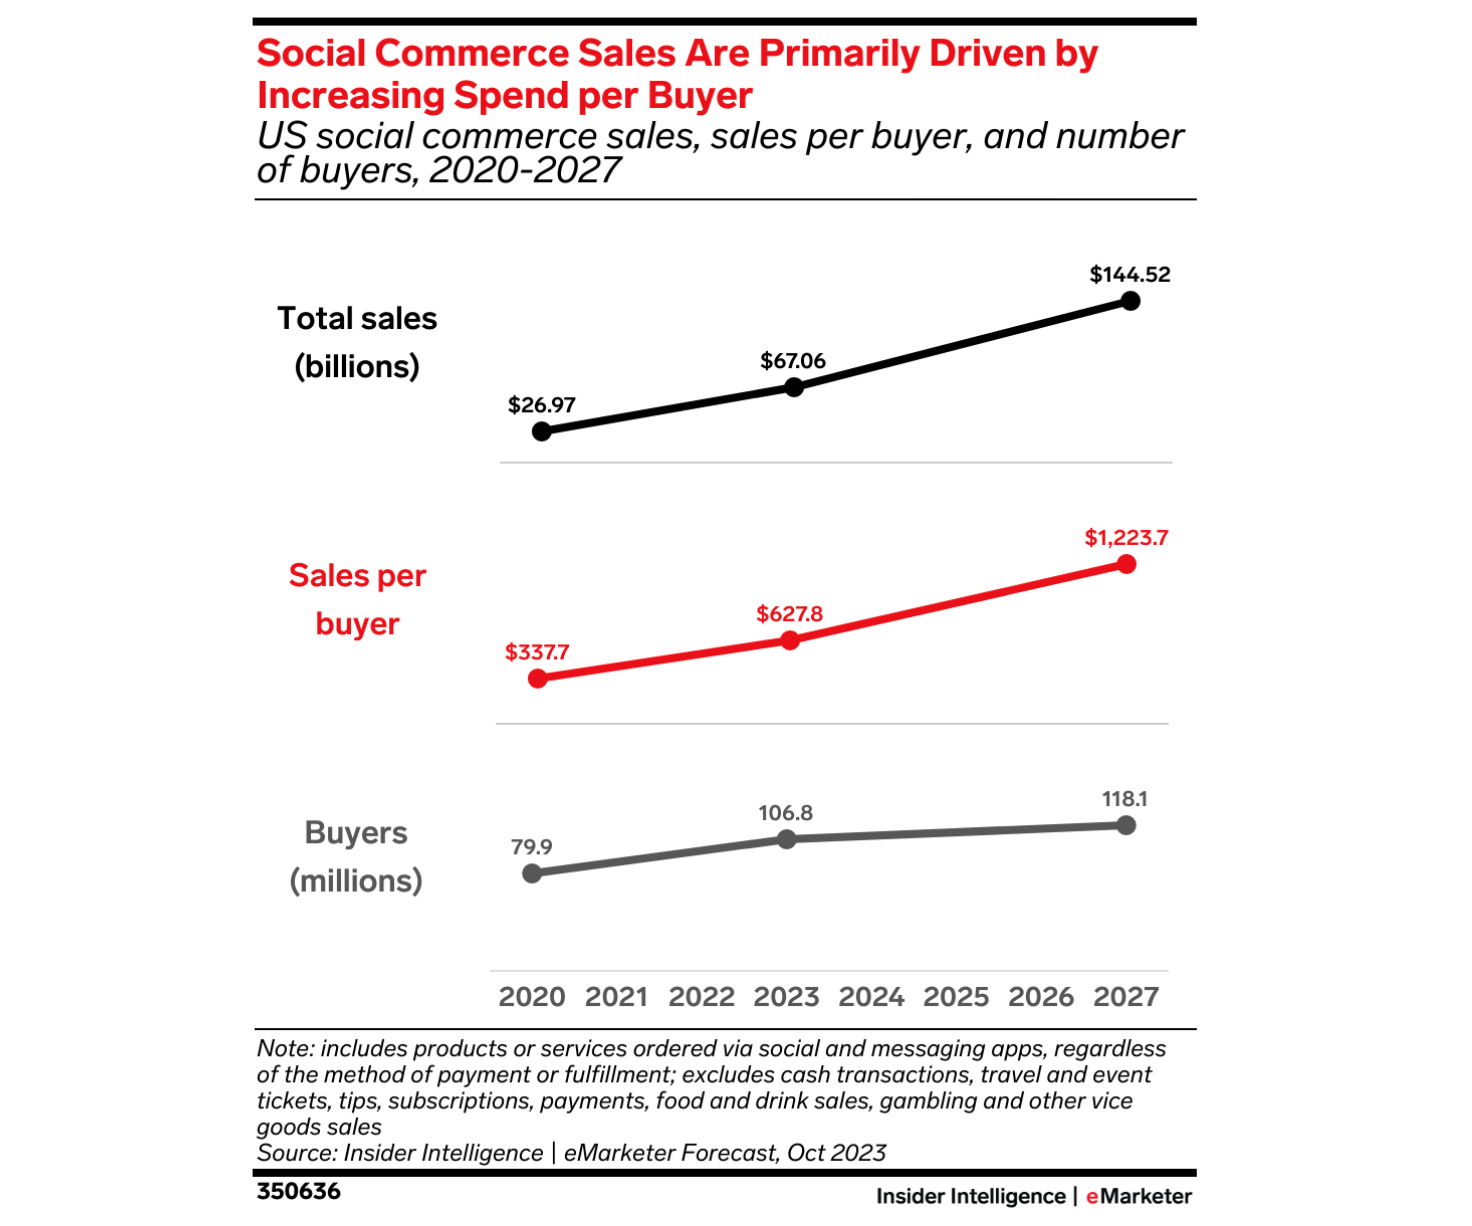
- In the US alone, social commerce revenue will amount to $144.52 billion by 2027.
- Growth will be driven primarily by Gen Z and Millennial social media users who will account for 62% of global social commerce spend by 2025.
By 2027, sales per buyer are expected to increase to $1,300 and the number of social buyers is expected to hit 118 million7.
By 2028, social commerce is expected to account for 22% of total ecommerce worldwide.
62% of consumers say they intend to shop more through social media in the future, up 53% from 2023.
At 93%, consumers in China will account for the highest percentage of social commerce shoppers, while France will have the lowest percentage (26%).
Digital commerce leaders predict that social commerce will be the number one channel by 2029.
This is ahead of marketplaces, brand sites, and retailer sites.
75% of creators plan to sell products via social commerce in 2024 and beyond8.
A further 61% plan to significantly increase the time spent on social commerce in the future.
Social commerce revenue statistics
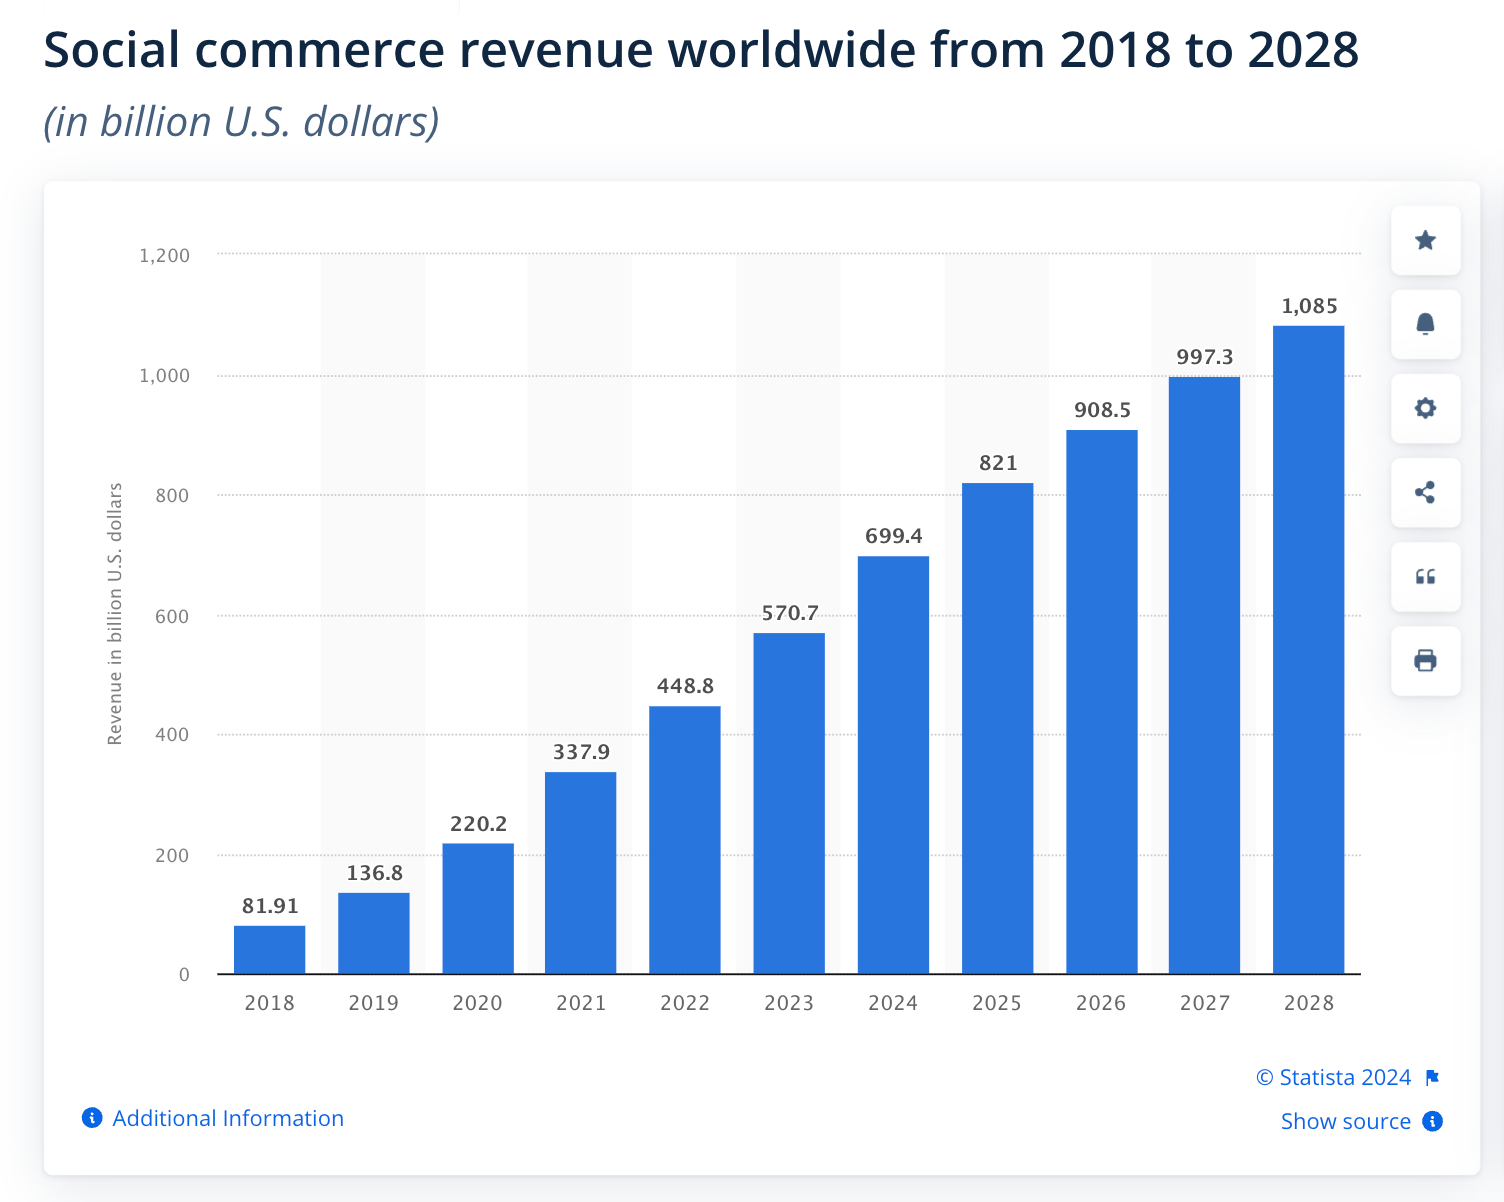
Globally, social commerce generated $700 billion in 2024, up 23% from $571 billion in 2023 and 27% from $449 billion in 20229.
Social commerce revenue has shown an upward trend increasing from:
- $82 billion in 2018.
- $137 billion in 2019.
- $220 billion in 2020.
- $338 billion in 2021
In 2024, US social commerce sales were expected to grow 23.5% to $82.82 billion10.
This amounts to 6.6% of total US ecommerce sales.
Meanwhile, social commerce sales amounted to $67.06 billion or 5.9% of total US ecommerce sales in 2023.
That’s up 149% from $26.97 billion in 2020.
Social buyers were expected to spend an average of $750.40 on social commerce in 2024, up $122 year-over-year11.
Social commerce sales per buyer amounted to $627.80 in 2023, an increase of 86% from $337.70 per buyer in 2020.
Social media was the most important customer acquisition channel for brands in 2023, accounting for 30% of ecommerce revenue12.
With brands earning $6.50 for every $1 invested in influencer campaigns on social media, 62% of global marketers selected social commerce as the most popular objective of their influencer campaigns in 2024.
Around 26% of creators actively sold products or services via social commerce in 2023.
The majority (17%) sold merchandise, followed by digital Products (13%) and beauty & skincare products (11%).
28% of creators generated an estimated $1000-$5000 in revenue through social commerce in 2023.
- 23% made $100-$500
- 23% made over $10,000
- 13% made $500-$1000
According to 26% of creators, YouTube was the most effective for selling products and services.
This was followed by other platforms (24%), Instagram (23%) and TikTok 19%.
Social commerce user statistics
As of 2024, 73% of global shoppers bought something through a social media platform13.
That’s up from 67% in 2023, 65% in 2022, and 44% in 2021, reflecting an upward trend in social commerce.
87% of consumers in the 16-24 age category drove social commerce in 2024, up from 83% in 202314.
Additionally:
- 81% of 25-34-year-olds made use of social commerce, up 5% from 2022.
- 71% of 35-44-year-olds made use of social commerce, up 6% from 2022.
- 54% of 45-54 year olds made use of social commerce.
- 33% of shoppers 55 and older purchased on social media.
Social Commerce Behavior Statistics
The average social media user spent 2 hours and 27 minutes per day on social media in 202415.
In the US alone, consumers spent an average of 2 hours and 18 minutes a day on social media, or 33% of overall screen time.
40% of consumers bought a product after seeing it on social media in 2023. Over 50% did so via social commerce or directly on the platform.
Globally:
- 64% of male social media shoppers who saw a product on social media purchased it directly on the platform versus 54% of female social media shoppers.
- 70% of Millennial social media shoppers who saw a product on social media purchased it directly on the platform versus 52% of Gen Z, 51% of Gen X, and 46% of Baby Boomers.
59% of male social shoppers followed and bought from brand accounts, ahead of 58% of female shoppers.
Meanwhile,
- 56% of male social shoppers followed and bought from retailer accounts compared to 54% of female shoppers.
- 39% of female social shoppers followed and bought from influencer accounts compared to 34% of males.
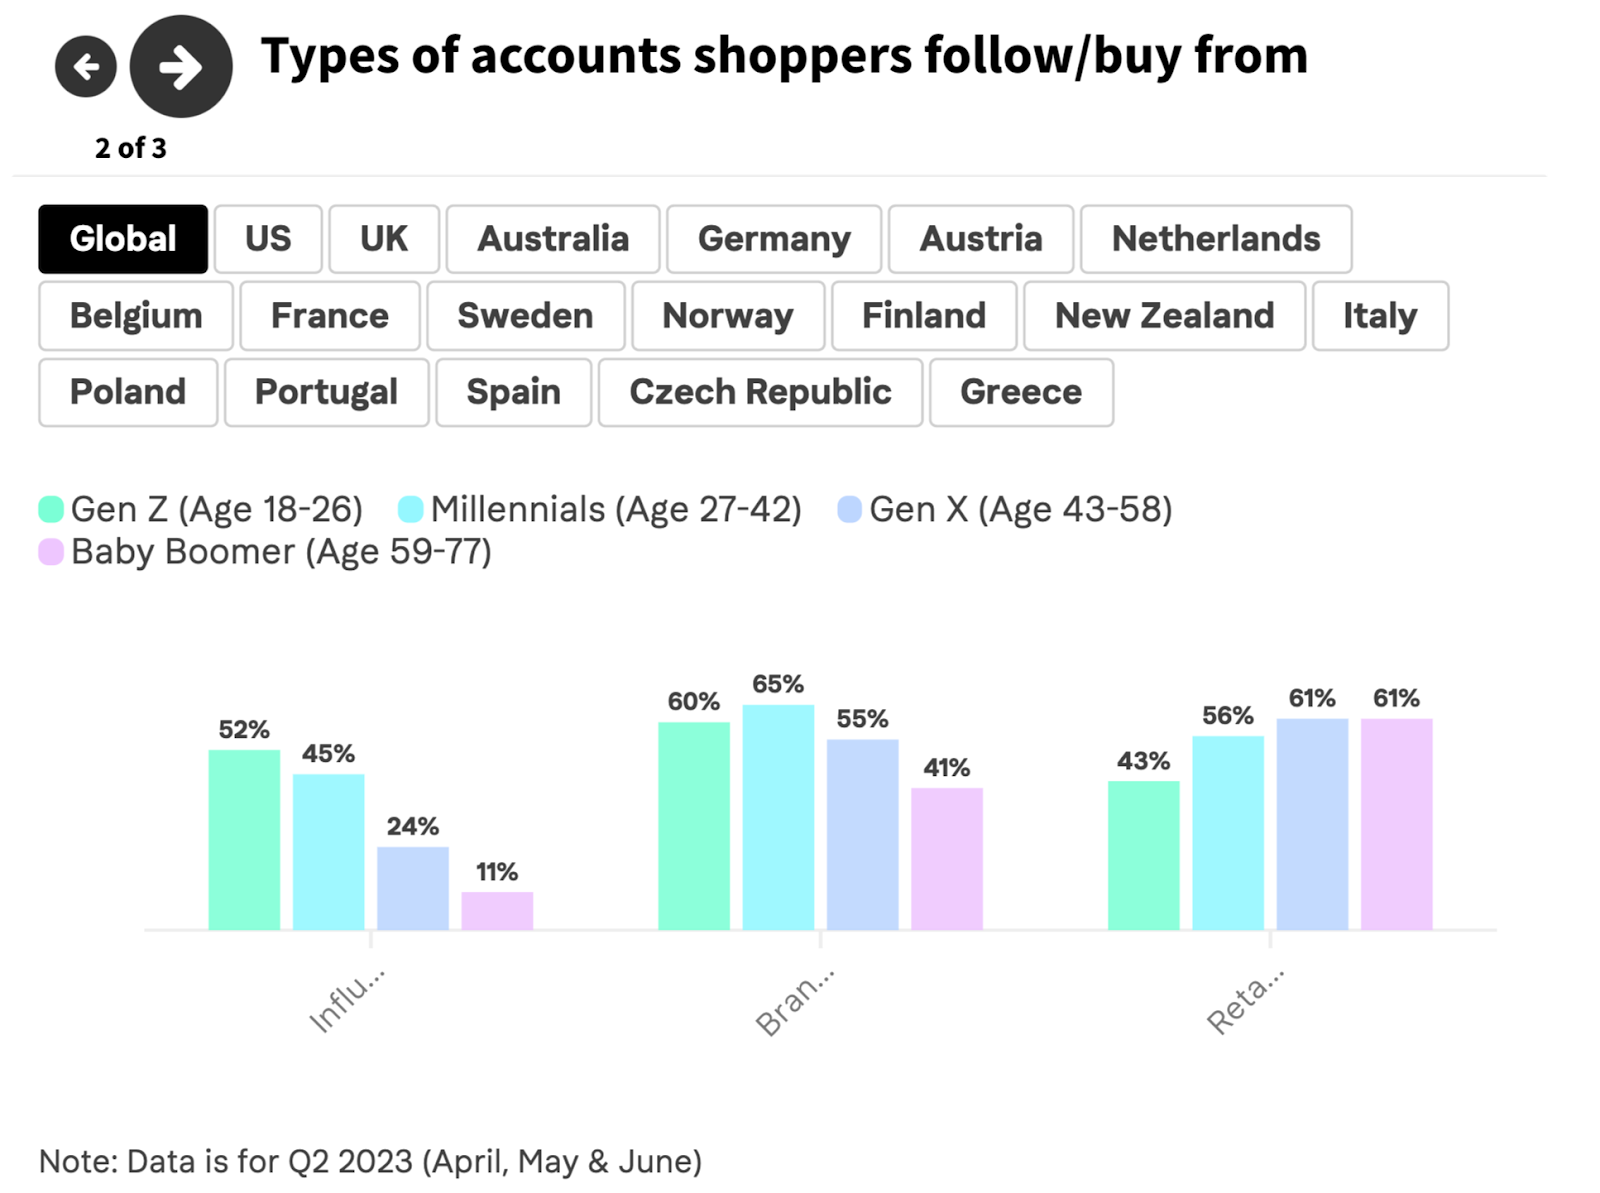
65% of Millennials followed and bought from brand accounts on social media in 2023, ahead of 60% of Gen Z, 55% of Gen X, and 41% of Baby Boomer social shoppers.
Meanwhile:
- 61% of Gen X and Baby Boomer social shoppers followed and bought from retail accounts on social media in 2023, ahead of 43% of Gen Z and 56% of Millennials.
- 52% of Gen Z social shoppers followed and bought from influencer accounts on social media in 2023, ahead of 45% of Gen Z, 24% of Gen X, and 11% of Baby Boomer social shoppers.
- 15% of Female consumers were more likely to begin their shopping journeys on social media in 2023 versus 13% of male consumers.
Reflecting the democratizing effect of social commerce, 59% of social buyers were more likely to buy from a small business when shopping through social commerce versus online16.
Additionally, 44% were more likely to try a brand they had previously not encountered.
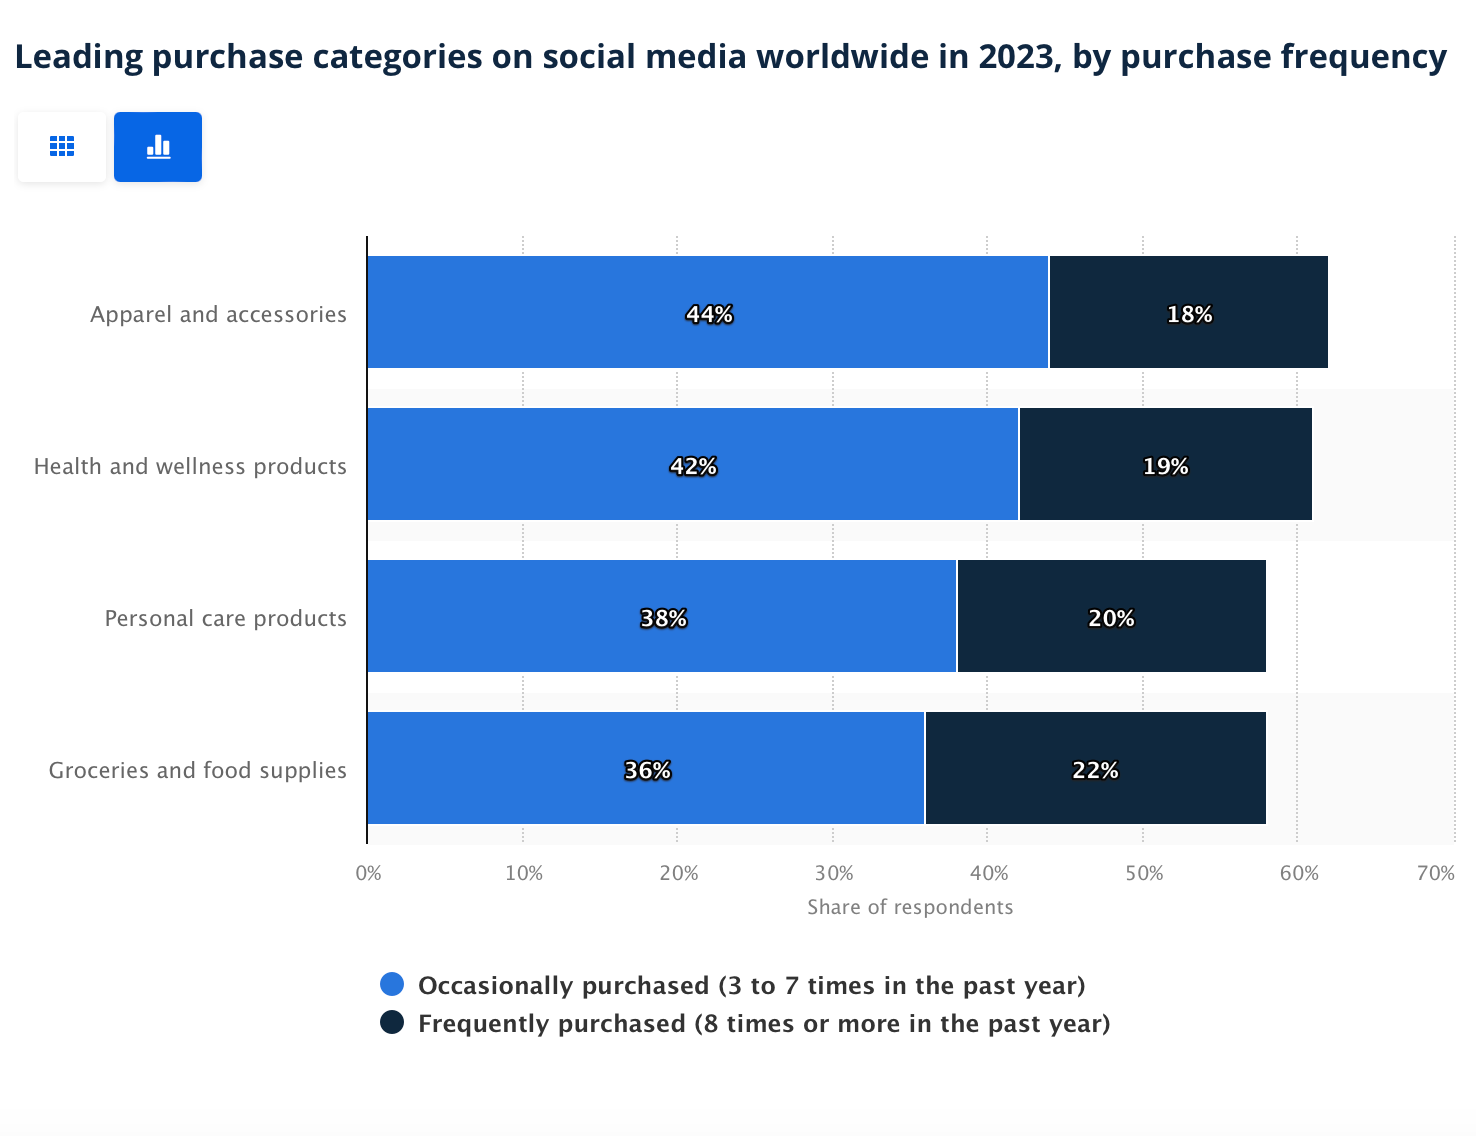
The leading purchase category on social media as of 2024, was Apparel and Accessories with 44% of social shoppers purchasing these products 3 to 7 times and 18% buying them 8 or more times in 202316.
In second place was the Health and Wellness category where 42% of social shoppers purchased products 3 to 7 times and 19% purchased products 8 times or more in 2023.
This was followed by:
- Personal care products, purchased by 38% of shoppers 3 to 7 times and 20% of shoppers over 8 times in the same period.
- Groceries and food supplies, purchased by 36% of shoppers 3 to 7 times and 22% of shoppers over 8 times in the same period.
71% of Millennials were most likely to buy clothing and apparel on social media.
At 65%, Gen Z was the second most likely to purchase clothing and apparel on social media. Meanwhile, Baby boomers were the least likely at 39%.
At 51%, Gen Z was more likely to buy cosmetics and beauty products on social media.
Millennials were second in line, with 47% considering buying cosmetics and beauty products on social media.
23% of global consumers bought between 1 and 5 products on social media17.
Additionally:
- 12% bought between 5 and 10 products
- 7% bought between 10 and 20 products
- 1% bought over 50 products
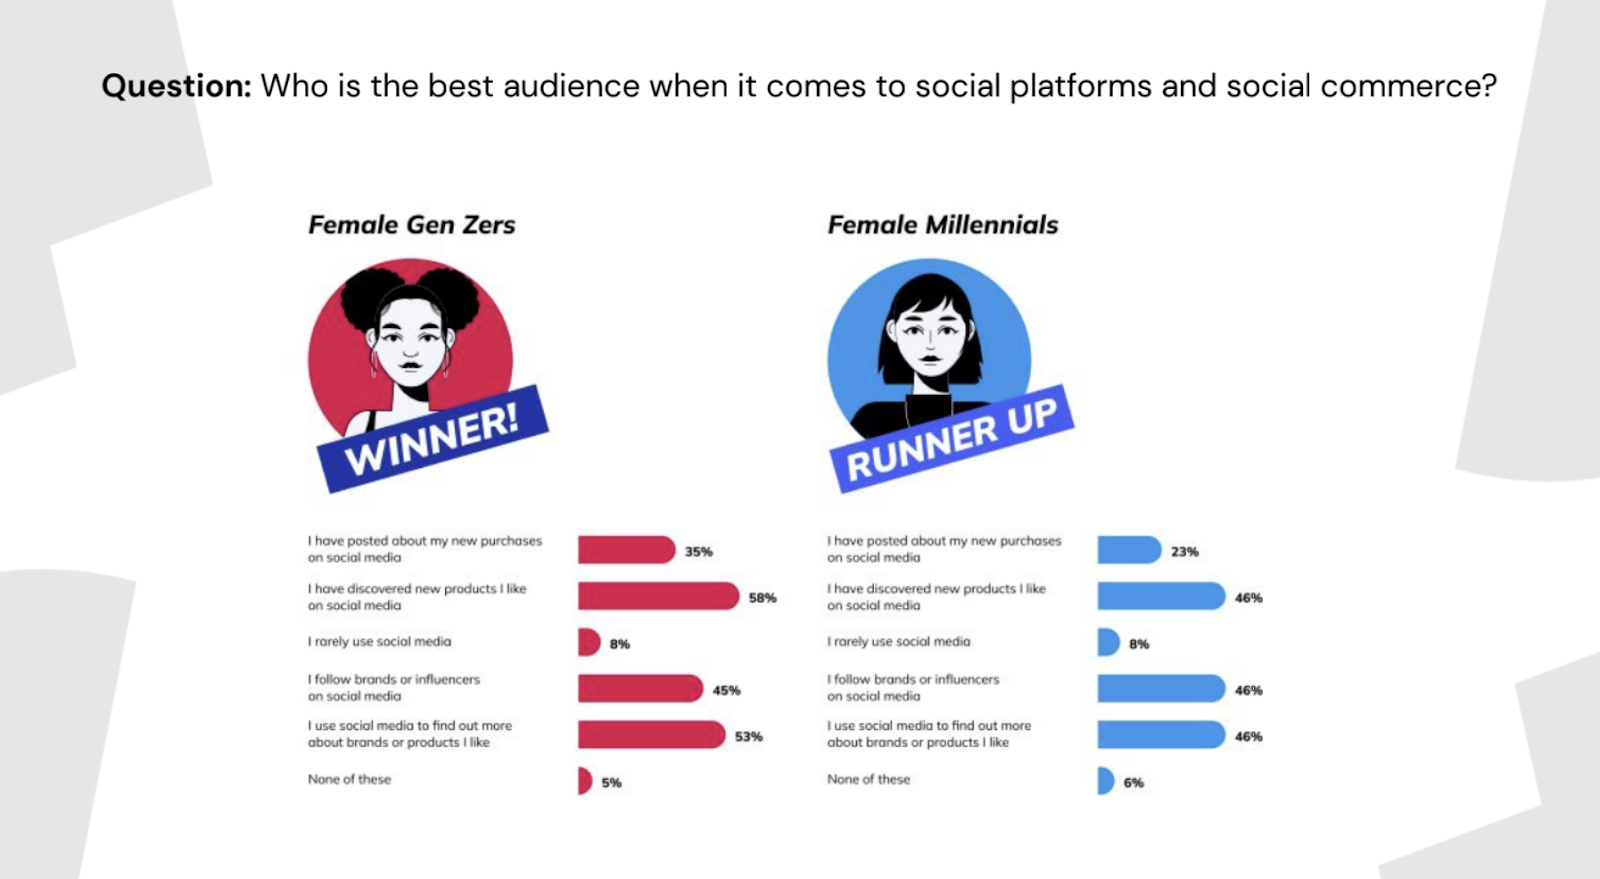
As of 2024, female audiences were the most engaged in terms of social commerce.
- 58% of female Gen Zers and 46% of female Millennials discovered new products they liked on social media.
- 53% of female Gen Zers and 46% of female Millennials used social media to find out more about brands and products they like.
- 45% of female Gen Zers and 46% of female Millennials followed influencers on social media.
- 35% of female Gen Zers and 23% of female Millennials posted about their new purchases on social media.
Trust in social commerce was highest among younger consumers with 82% of Gen Z social shoppers expressing elevated trust in social shopping.
This was compared to 75% of Gen X consumers.
53% of global shoppers purchased via a live shopping event on social media in 2024, with only 3% admitting they didn’t know anything about live events.
Live shopping events were most popular in APAC, with China taking the lead at 87%, followed by Indonesia (83%), Thailand (82%) and India (77%).
Popularity was lowest in European countries with Italy taking the bottom spot at 23%, followed by Germany and France at 25% and 26%, respectively.
As a type of social media allowing consumers to interact in a virtual environment, the metaverse has had mixed performance, with 43% of global consumers having used the channel as of 2024.
Additionally, 30% of consumers said they had bought on the platform, up from 23% in 2023. Meanwhile, 49% planned to use the metaverse as part of their social shopping experience.
Drivers of Social Commerce Statistics
In 2023, 39% of consumers said deals and discounts were the top factors that motivated them to increase their use of social commerce18.
This was followed by ease of purchase at 33% and exclusive offers at 28%.
Gen Z and Millennial consumers stated that social media played a key role across the stages of the shopping journey. In fact, 88% used social media to discover new products or shop for inspiration in 2023.
A further 44% used social media to evaluate items for consideration and purchase.
Throughout the social shopping journey, friends and family were an integral part of the experience, with 85% of consumers involving their loved ones via tagging, direct messages, or attending live shopping events together.
- 50% sent direct messages with product posts on either Instagram or TikTok.
- 46% tagged them in product posts on Facebook, TikTok, or Instagram.
- 39% sent product messages or photos via Snapchat.
- 19% attended live shopping events with friends.
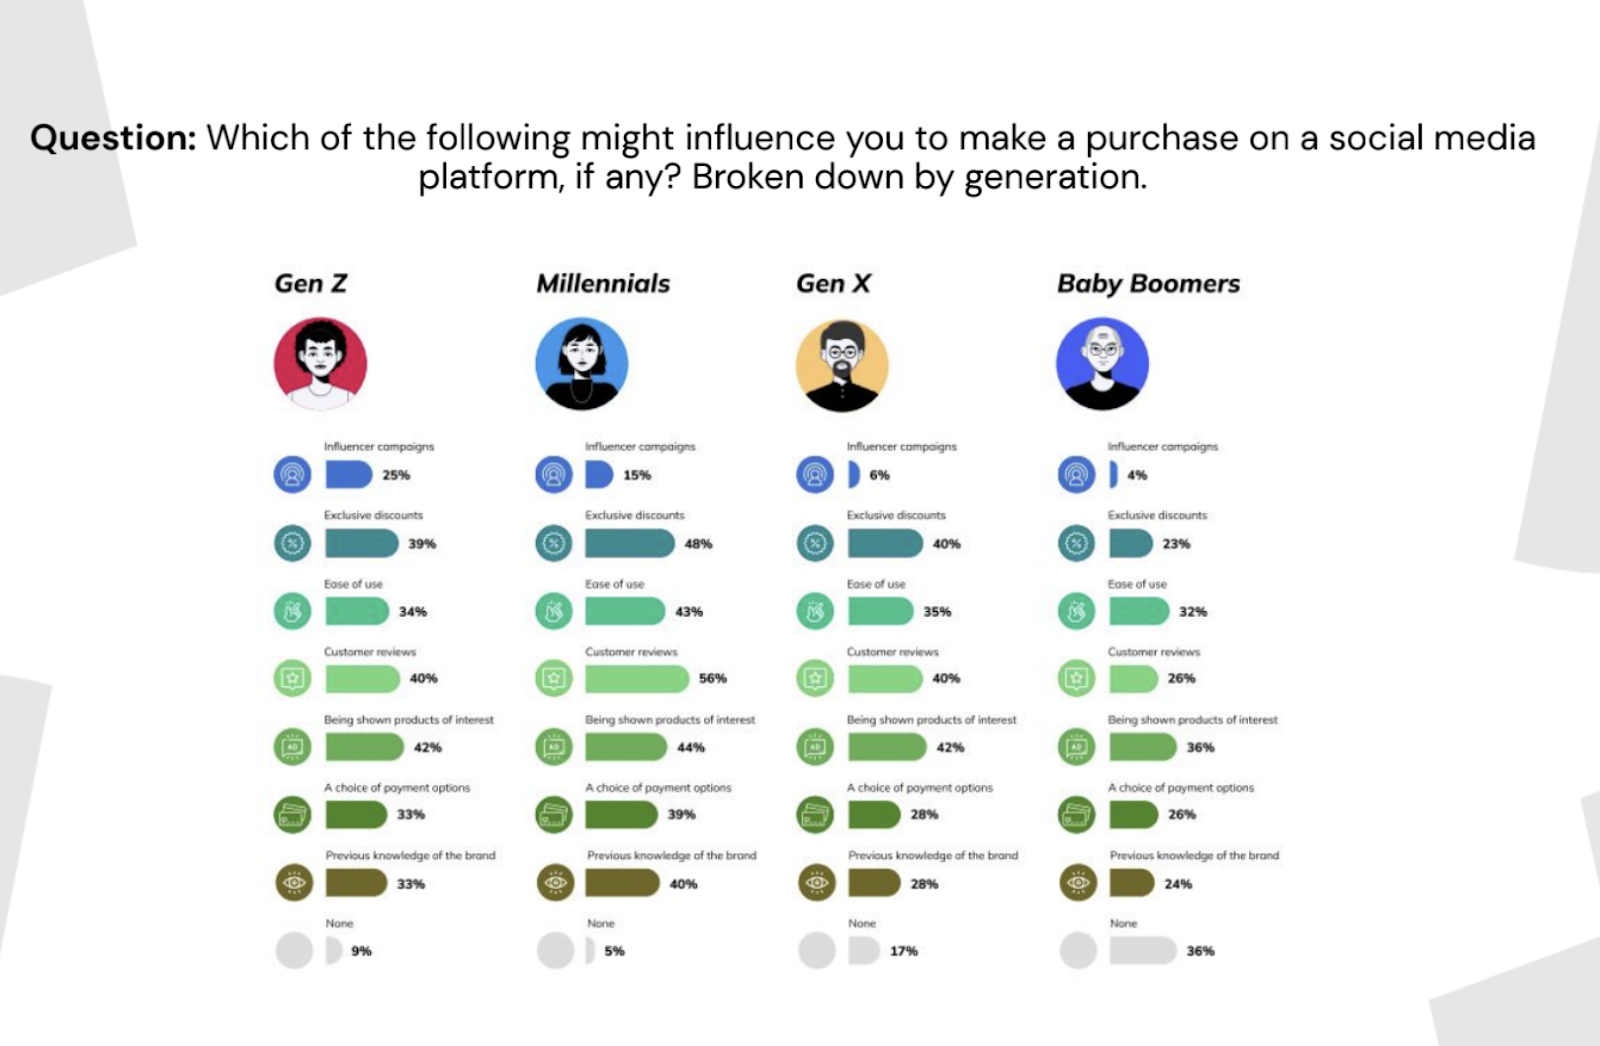
At 44%, customer reviews were most likely to influence consumers to engage in social commerce in 202321.
This was followed by being shown products of interest at 42% and exclusive discounts at 40%.
43% of consumers selected deals and discounts as the top reason they would spend more on social platforms.
Ease of purchase (38%) and exclusive offers (32%) followed closely behind. Other top reasons included:
- More customer reviews at 27%
- Greater product availability at 26%
- Seeing products on real customers at 24%
By generation, Gen Z and Gen X consumers were more likely to be influenced by being shown products of interest (42%)
Meanwhile, Millennials were more likely to be influenced by customer reviews (56%).
Highlighting the power of social proof, poor reviews were the number one factor that would stop Gen Z (54%), Millennials (65%), Gen X (55%) and Baby Boomers (47%) from making a purchase on social media.
The next factors were a lack of trust in the brand and a previous negative experience.
50% of Gen Z and Millennial consumers held favorable views toward influencers promoting products and brands on social media and found their recommendations more engaging than conventional advertising22.
Over 44% of consumers in 2023 reported following influencers who regularly promoted products and brands and a further 45% of consumers in both age groups reported purchasing products endorsed by influencers.
Social Commerce Preference Statistics
In 2023, social commerce appealed to the trend of compressed commerce, with 80% of shoppers wanting quick movement from inspiration to purchase23.
Notably:
- 93% of consumers wanted the ability to easily compare products and prices on social platforms.
- 85% of shoppers aged 25 to 34 wanted their buying journeys to be as short as possible. This was also the consensus (71%) among consumers over 55.
59% of global shoppers singled out the ability to buy within a social app, as opposed to having to leave to complete a transaction, as what they wanted most.
In terms of payment methods, 79% of social buyers wanted the ability to save their payment details via a secure digital wallet versus manually entering their credit card details. Meanwhile, 87% wanted integrated payment details such as Apple Pay.
69% of global social shoppers preferred to shop static images over video content.
However, of those who preferred video content 50% said they got a better understanding of product fit and features, while 27% said this helped them visualize the product.
Social commerce platform statistics
The social platform consumers were most likely to shop from in 2024 was Facebook, with most global shoppers (24%) selecting it as their ‘go-to’ social commerce platform.
In second place, 20% of consumers selected Instagram as the social platform they were most likely to shop on, while 14% couldn’t single out a particular platform. At 13% and 8%, respectively, TikTok and Whatsapp were the next picks for global shoppers.
In terms of which social platform offered the best experience, most global shoppers (23%) selected Facebook and Instagram (19%) next.
This was followed by:
- TikTok at 13%
- Whatsapp at 7%
- YouTube at 7%
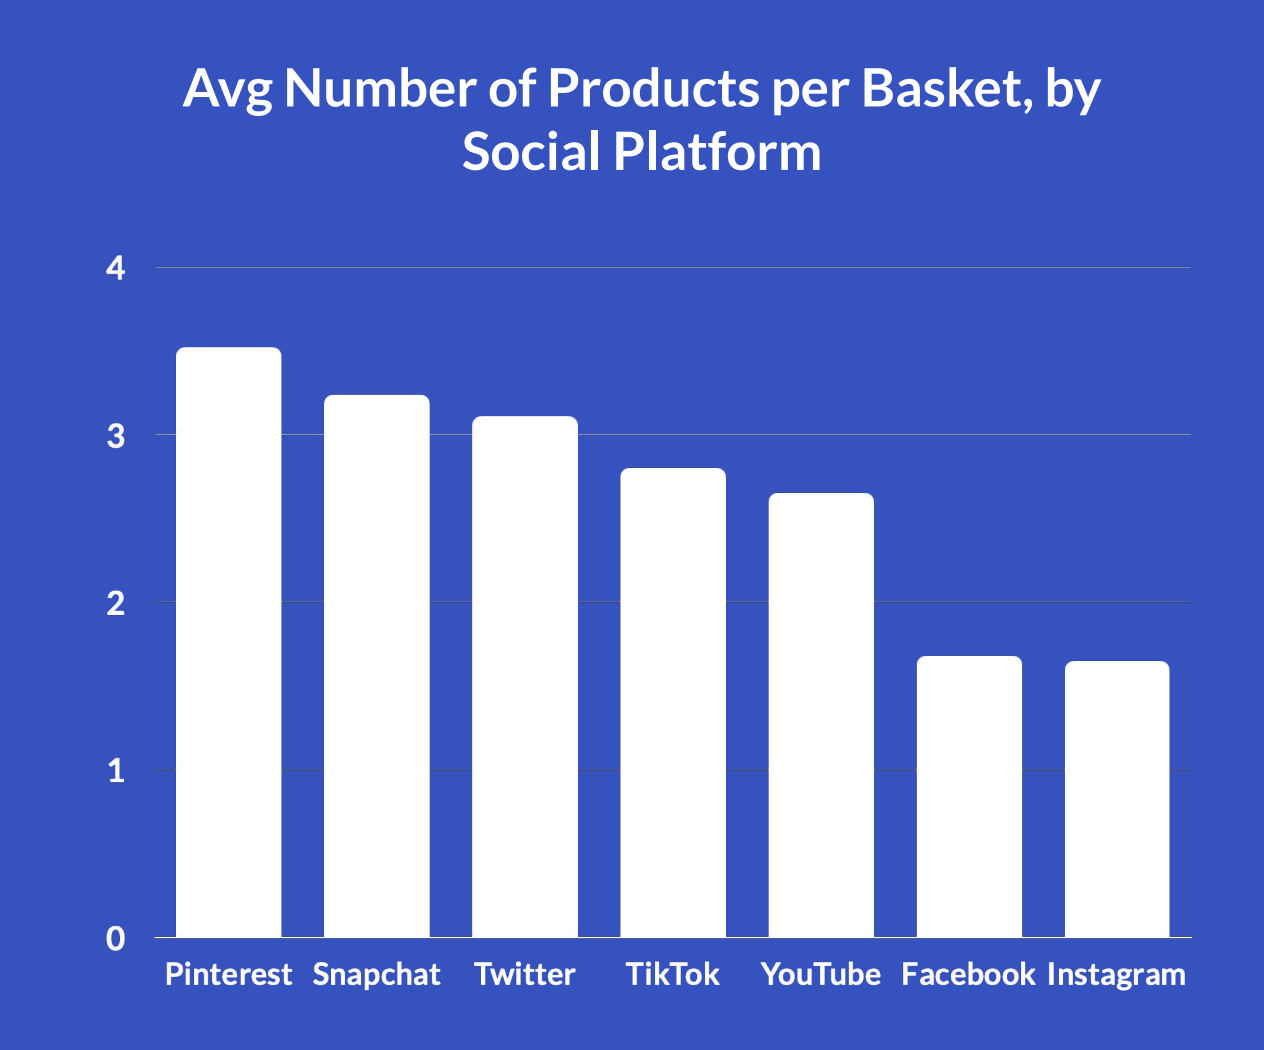
As of 2023, social shoppers bought the highest number of items on Pinterest (3.5 items) and Snapchat (3.2 items)24.
This was followed by:
- Twitter with 3.1 items
- TikTok with 2.8 items
- YouTube with 2.5 items
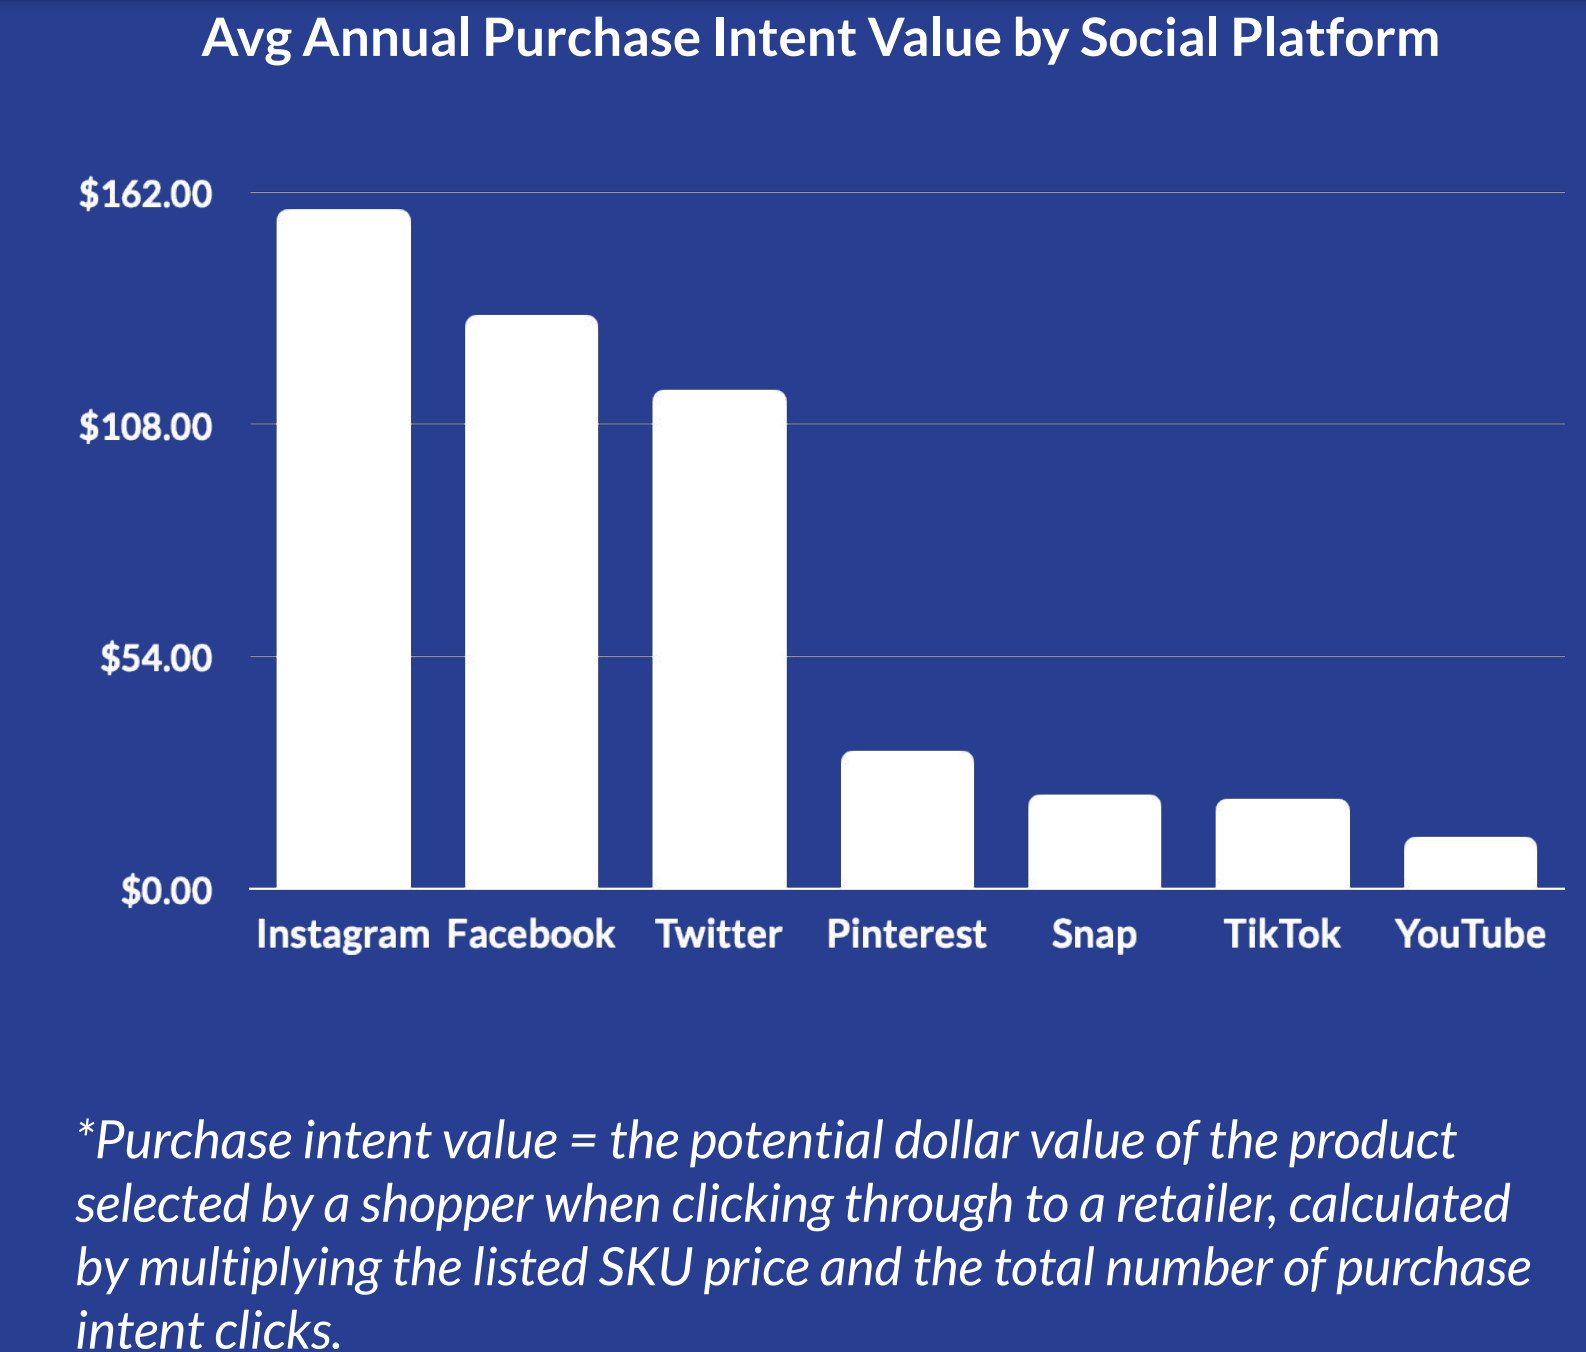
However, in terms of Purchase intent value, Facebook and Instagram took the lead with shoppers spending $158 and $133 per order, respectively.
This was followed by Twitter (X) at around $120, Pinterest at $30, Snapchat and TikTok at $21 and YouTube at around $12.
Facebook Social Commerce Statistics
As of 2024, Facebook had over 3 billion monthly active users, making it the world’s most popular social network.
49% of Facebook's users fell within the 25-44 age range and spent 33 minutes a day on the platform.
21% of social shoppers in the US selected Facebook as their top platform for shopping, making it the top social media for social commerce.
65.7 million users in the US alone were expected to make purchases on Facebook in 2023, while the average order value was $55.
91% of brands marked their presence on Facebook as indispensable in their digital marketing and ecommerce efforts.
Brands posted an average of 5 times a week on Facebook. Meanwhile, ads on the platform had an ad reach of 1.98 billion and an average CTR of 1.4%.
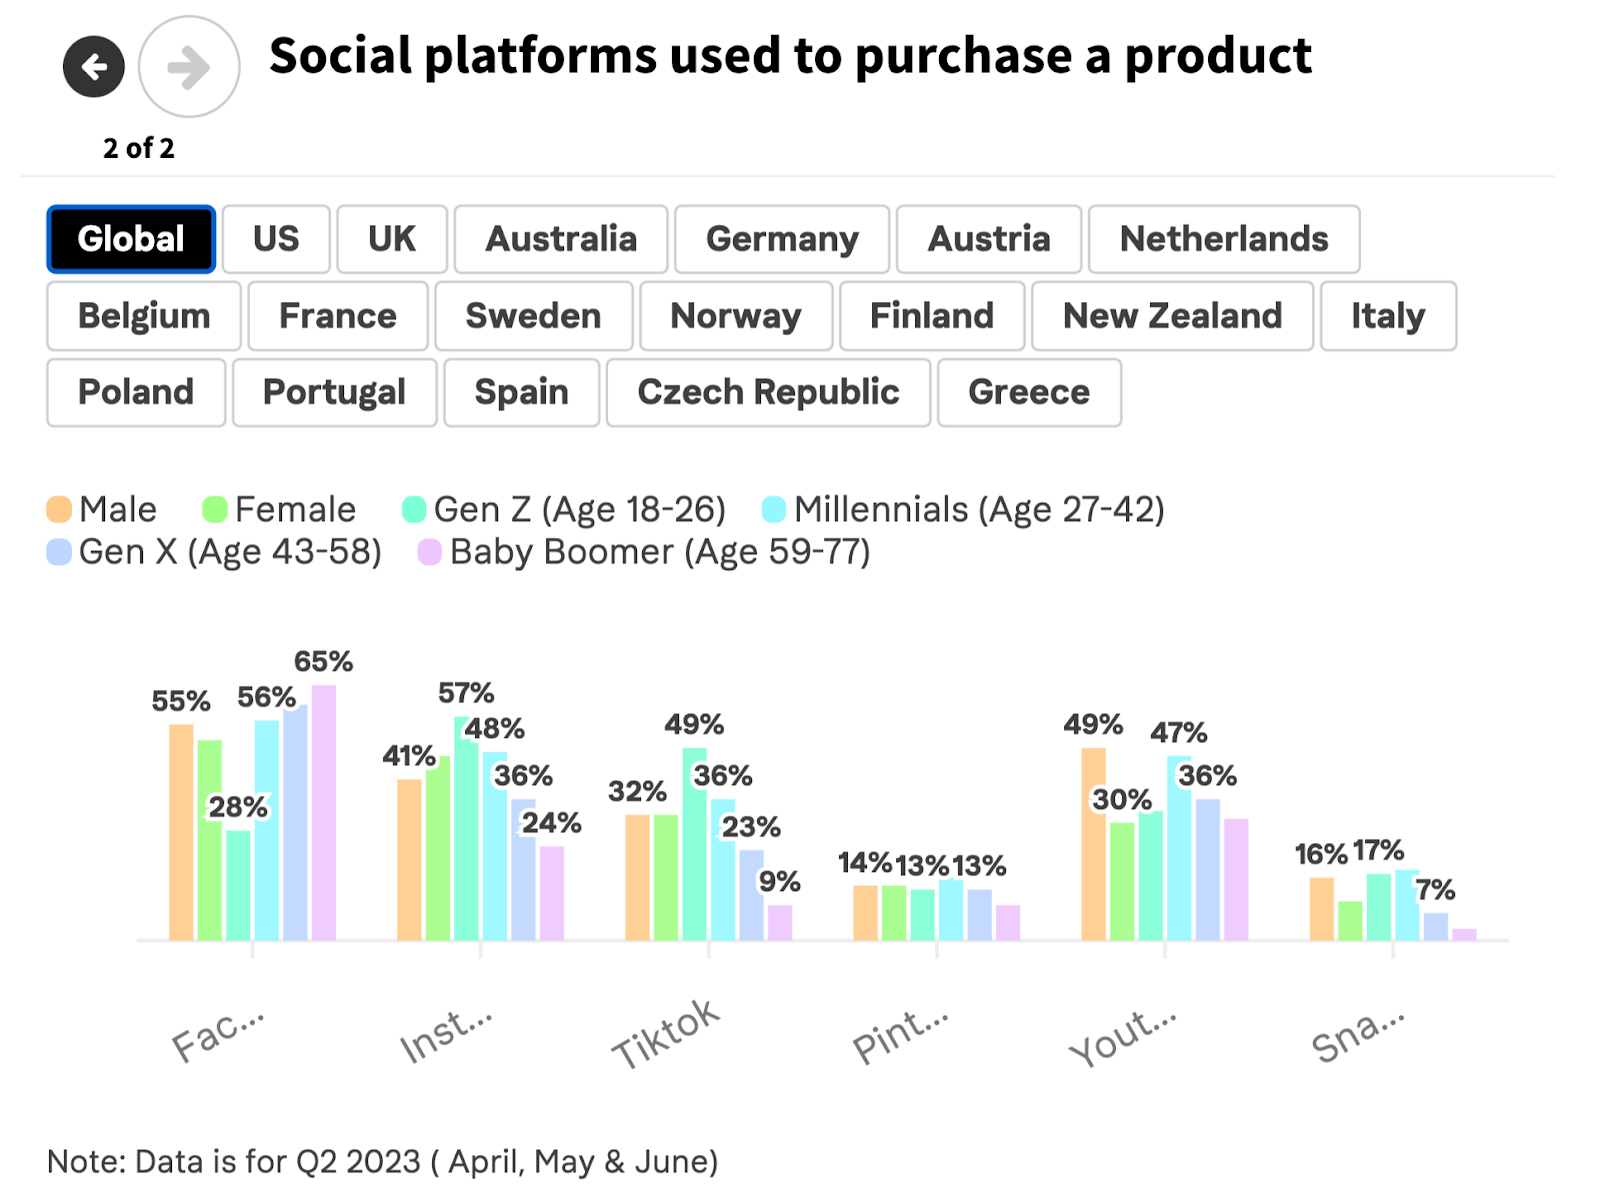
In 2023, 62% of consumers in the US used Facebook to purchase a product, ahead of Australia (60%), New Zealand (58%), and the UK (54%).
Globally, 55% of Males compared to 51% of females used Facebook to purchase a product in 2023.
By age group, 65% of Baby boomers used Facebook to purchase a product. This was ahead of Gen X (60%), Millennials (56%), and Gen Z (28%).
Instagram Social Commerce Statistics
Instagram had over 2 billion users globally as of 2024.
28% of Instagram’s users were aged between 25-24. The platform was preferred by US users aged 16-34, outpacing TikTok.
As of 2024, 92% of online retailers had a presence on Instagram commerce25.
In second place was Facebook, where over 80% of online brands had a social commerce presence. This was followed by Pinterest (72%) and TikTok (12%).
44% of Instagram users engaged in shopping on the platform weekly, while 130 million users interacted with shoppable posts monthly.
The average order value on Instagram was $65. Additionally, 72% of shoppers said their purchase decisions were influenced by the platform and a further 70% turned to Instagram for their next purchase.
The average post engagement rate on Instagram was 0.60% and carousel posts resulted in the highest engagement rate for businesses.
In addition, brands leveraging Instagram’s shopping features saw a 42% increase in sales.
In 2023, 42% of consumers in the US used Instagram to purchase a product, while 35% of social shoppers in the UK and 39% in Australia used the platform. This was behind Portugal (57%), Spain (57%), and Sweden (51%).
Globally, 47% of female versus 41% of male social shoppers used Instagram to purchase a product in 2023.
By age group, 57% of Gen Z social shoppers used Instagram to purchase a product. This was ahead of Millennials (48%), Gen X (36%), and Baby Boomers (24%).
TikTok Social Commerce Statistics
As of 2024, TikTok had over 1.5 billion users.
In the US alone, there were over 150 million monthly active users who spent an average of 56 minutes on the platform daily.
For brands, features like TikTok Live led to a 1300% increase in sales in 2023.
Additionally:
- 92% of TikTok users took action after watching a TikTok video.
- 61% of TikTok users made a purchase after seeing a TikTok ad.
- 58% of TikTok users discovered new brands and products on the platform.
In 2023, 40% of consumers in the US and UK used TikTok to purchase a product, slightly behind Australia (42%), New Zealand (42%), and Germany (42%).
Globally, 32% of both males and females used TikTok to purchase a product in 2023.
By age group, 49% of Gen Z social shoppers used TikTok to purchase a product. This was ahead of Millennials (36%), Gen X (23%), and Baby Boomers (9%.)
YouTube Social Commerce Statistics
As of 2024, YouTube had over 2.7 billion monthly users.
The platform was most popular with Gen Z and Millennials, while 54% of the user base was male and 46% was female.
92% of YouTube users turned to the platform for information, while a global average of 38% of consumers made a purchase on YouTube.
85% of YouTube users interacted with brands they discovered on YouTube and 59% of users found YouTube more relevant than TV ads.
In 2023, 56% of consumers in Germany and 55% of consumers in the US used YouTube to purchase a product, ahead of Australia (47%), New Zealand (37%), and the UK (39%).
Globally, 49% of males compared to 30% of females used YouTube to purchase a product in 2023.
By age group, 47% of Millennials used Facebook to purchase a product. This was ahead of Gen X (36%), Gen Z (33%), and Baby Boomer (31%) social shoppers.
Pinterest Social Commerce Statistics
Pinterest had close to 500 million monthly active users as of 2024.
76% of the platform’s user base was female and 42% of the user base was made up of Gen Z users.
In addition, Pinterest shoppers reported an average annual income of over $100,000 and 70% of the platform’s luxury audience was under 35.
Since 2021, commerce activities on the platform have grown by 300%.
Additionally:
- 85% of weekly Pinterest users made a purchase based on pins they've seen.
- 80% of weekly Pinterest users discovered new products on the platform. Additionally,
- 47% of consumers in the US made a purchase based on Pinterest recommendations.
Brands using Pinterest Catalogs received 5x more product impressions.
They also had a 2x higher return on ad spend.
In 2023, 23% of consumers in the US used Pinterest to purchase a product, ahead of Germany (19%), the UK (16%), and Australia (15%).
Globally, 14% of both male and female social shoppers used Pinterest to purchase a product in 2023.
By age group, 16% of Millennials used Pinterest to purchase a product. This was ahead of Gen Z (13%), Gen X (13%), and Gen Z (28%).
Snapchat Social Commerce Statistics
As of 2024, Snapchat had over 750 million monthly active users and 397 million daily active users globally.
Snapchat users created over 5 billion snaps daily and spent an average of 31 minutes on the platform daily.
75% of Snapchat users interacted with AR features daily.
The platform had over 200 million monthly engagements with AR shopping experiences.
In 2023, 29% of consumers in the US used Snapchat to purchase a product, ahead of Norway (23%), Australia (21%) and the UK (16%).
Globally, 16% of male social shoppers used Snapchat to purchase a product in 2023 versus 10% of female shoppers.
By age group, 18% of Millennials used Snapchat to purchase a product. This was ahead of Gen Z (17%), Gen X (7%) and Baby Boomers (3%)
Social commerce challenges statistics
In 2024, 67% of consumers didn’t trust social platforms with their personal data, while 49% didn’t trust brands with their personal data.
However, distrust in social media platforms was lower amongst Gen Z consumers at 61% for social platforms and 49% for brands.
Similarly, 62% of consumers didn’t trust social platforms with their credit information, while 44% didn't trust brands with their credit card information.
Distrust was lower amongst Gen Z consumers at 57% for social platforms and the same at 44% for brands.
77% of consumers were unsure of who to approach if they needed to return a product purchased on a social media platform. In fact, only 20% knew to contact the social network.
In light of the challenges of dealing with returns for products purchased via social commerce, 66% of social shoppers were reluctant to make a purchase through socials again.
The most common social commerce challenge reported by consumers was product availability, with 46% saying they were unable to purchase a product on social media.
This was mainly due to brands not having measures in place to accurately track their social commerce activity.
At 50%, being redirected was the key challenge consumers faced while purchasing from social commerce platforms26.
This was followed by customer service issues (40%), the unavailability of preferred payment options, and spam (27%).
Of the 70% of consumers who were deceived into buying counterfeit products online in 2023, 39% bought them on social media27.
Of the consumers who bought counterfeits on social media, 68% did so on Facebook.
The biggest barrier to social commerce in 2023 was trust, with 48% of consumers expressing concern that their purchases would not be protected or refunded28.
Other challenges included poor return policies (37%), long delivery times(32%), and not enough information to make a purchase (32%).
Social commerce analytics were a key challenge for businesses.
While 29% of business leaders selected social commerce as the biggest growth opportunity in the next 5 years, close to 50% said they still didn't know what successful social commerce entailed.
Social commerce strategy statistics
44% of brands invested in social commerce to increase reach29.
32% invested to drive up engagement and 30% did so to increase profits.
By industry, 82% of marketers in the retail industry considered social commerce very important.
- 79% of marketers in the CPC industry said social commerce was of high importance.
- 77% of marketers in the Technology industry said social commerce was of high importance.
- 65% of marketers in the Financial Service industry said social commerce was of high importance.
Between 2021 and 2023, there was a 19% increase in social commerce budgets.
88% of marketers invested or planned to invest in social commerce initiatives and activities. This included 93% of marketers in retail and CPG sectors, 85% in technology, and 80% in financial services.
Across CPG, Retail, Technology, and Financial Services, 47% of businesses saw benefits like reaching customers in an affordable way.
Other social commerce benefits included:
- Building relationships and collecting customer data and feedback at 46%
- Reaching customers in places that mattered to them at 43%
- Built-in analytics with measurement on every campaign at 42%
In 2023, 71% of marketers used their social commerce strategy to drive direct ecommerce sales.
The second most popular strategy at 60% was to build their brand over the long term, while 49% used social commerce to drive direct offline sales.
Master social commerce with Whop
Social commerce is the new way to connect with customers. Whop is a platform that allows you to engage with potential customers in the way that best suits your business.
With Whop you create your whop, which is your internet hub. You build your whop using no-code apps. For example, you can add a Chat App to connect with customers, a Video Calls App to sell via livestreams, a Forum to showcase new products and a Giveaways App to give back to your customers.
You can sell anything from ebooks to online courses, paid community access to PDFs and software - all right from your whop, in the way that you want.
With no platform membership fees and only a 2.7% + $0.30 cut of your sales, you can start selling with Whop risk-free.
Sources