Swing Trading is a popular trading style - but how does it work? Find out in this guide.
Key takeaways
- Swing trading captures price movements over days to months, offering larger profit potential than day trading with less time commitment.
- Technical analysis tools like Fibonacci retracements and moving average crossovers help identify optimal entry and exit points for trades.
- Successful swing trading requires balancing technical indicators with fundamental awareness to manage overnight and macro event risks.
Fire up your trading app, buy a couple of shares of a stock you saw mentioned on social media, then forget about it for a month until you see it in your feed again. Check your portfolio, and lo and behold, you’re up 10%! Now you can hit sell, take a tidy little profit, and wonder why you didn’t commit a little more cash to the trade in the first place.
That’s swing trading in a nutshell, but as we’ll go on to mention in this guide, there’s a lot more to it. We’ll take a deep dive into this versatile and highly profitable trading style, compare it to other trading strategies, and highlight a couple of tricks and tools you can brush up on to really make swing trading work for you.
What is Swing Trading?
Swing trading is a trading style that takes advantage of the fluctuations in the price of a security over the short term, as defined by a period of days, weeks, or even a couple of months.
Markets may develop larger trends and cycles, but prices don’t move in a uniform direction within these trends—it’s commonly held that index funds tend to be a good long-term investment because they have historically trended upwards, but even if the S&P 500 does go up 7% on any given year, you’ll find upwards and downward swings within this larger movement.
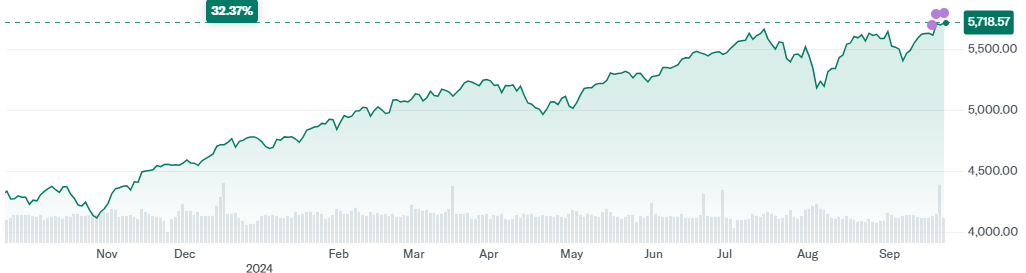
Above, you’ll see the S&P 500’s performance over the last 12 months. A long term investor will have done well by simply buying and holding shares of an index fund across this period, but the peaks and troughs within the general upward trend are quite clear.
Looking at the year in review, a swing trader might have looked to enter a bullish (optimistic or long) position in November and perhaps take an easy 10% profit in December. Buying shares in January and offloading them again in end-February would again have led to a 10+% profit, and a quick flip into a short position from April into May would have made sense. Then, there’s the volatility from July onward that would have had swing traders licking their lips again.
Unfortunately, it’s not possible to trade with the power of hindsight as we’ve just described, but skilled swing traders have a variety of tools and strategies in their arsenal helping them to predict such movements, and their understanding of market movements goes far beyond a rudimentary 10% between one month and the next.
Many of their strategies fall under the umbrella of technical analysis and we’ll get into those in more detail later, but swing traders do also have to keep an eye on fundamentals—holding an asset for more than a day means that you need to be sure that it’s not going to go to zero overnight.
You may also be interested in...
Swing Trading in Stocks
Swing traders often focus on stocks because of their liquidity, and the opportunity to claim significant profit through swings without overly excessive volatility. Stocks also offer traders the opportunity to diversify, thereby mitigating risk, although stock-picking itself can take plenty of skill and a grounding in trading analysis.
Swing Trading in Forex
Many skilled traders and investors also swing trade forex, holding positions in different currencies for a few days or weeks before exiting their trades. Usually, forex swing trades are completed in a shorter time frame than with other securities, with the notable exception of crypto which can swing massively in a very short period of time.
What’s the Difference Between Swing Trading and Day Trading?
Swing trading and day trading are both trading styles that operate on the shorter end of the spectrum, but there are several marked differences. One of the most important distinctions between the two is that day traders make their trades during the course of a trading session and almost keep positions open overnight, while swing traders, as mentioned, might hold a position for up to a few months.
The time frame that a day trader operates within is a lot shorter than a swing trader, and some day traders even conclude a trade within minutes of entering it. As you might imagine, the potential for fluctuation within such a short period of time is far lower than it is over days or weeks, so the day trader might hypothetically be looking for a 0.5% fluctuation compared to a swing trader’s equally hypothetical 10% target.
Day traders therefore can elevate their gains by either betting large amounts of capital, or entering a large number of trades. They might spend entire trading sessions without actually trading, but it’s equally possible that they trade once, twice, or even up to five times in a single day. Some day traders leverage almost all of their capital (and use margin to borrow even more) on these trades, so while they’re looking at fractions of a percentage point in terms of fluctuation, the profits can add up.
A swing trader, on the hand, doesn’t usually put all their eggs in one basket like this given the risks of holding across a few days or more—the fundamentals of a security are a concern, and macro events such as the outbreak of a pandemic or a war can crater the markets despite otherwise-solid fundamentals, as investors have recently found out.
Swing Trading vs. Long-Term Position Trading
Position trading, or long-term position trading, is a trading style that’s yet another step up from swing trading in terms of time frame. Position traders hold onto their securities for a longer period of time, relying on general market trends and more historical patterns to dictate exactly what positions they choose and hold.
Fundamental analysis is especially important to position traders even though there are a handful of technical indicators (such as the 200-day moving average, more on that later) that they look at. They also tend to ignore the sorts of swings and fluctuations and swing traders would take advantage of, holding through shorter term volatility in the expectation that their long-term hypothesis will play out.
Long-term position trading is one of the most common forms of investing, especially among older generations where it was common to simply accumulate securities across years and years in service of building up wealth or a retirement nest egg.
The Top Swing Trading Strategies that You Should Know
Stock trading strategies can be complex at times, and understanding the terminology used in them requires a little bit of familiarity with stock charts. Here’s a primer if you want to brush up on stock charts before getting to the strategies below!
Fibonacci Retracement
Fibonacci is a name you’ll invariably hear when dealing with anything maths-related, and Fibonacci retracements are extremely popular among technical traders. A Fibonacci retracement is created by taking two points on a chart (normally a peak and a trough) and dividing the vertical distance by the Fibonacci ratios of 23.6%, 38.2%, 50%, and 61.8%.
Once you’ve got these different levels, you can draw horizontal lines on the chart in order to try and identify potential levels of support and resistance. An especially confident swing trader might look to purchase a security at levels of support, then sell toward the resistance and perhaps even open a short position at that point in order to profit on the downswing.
Fibonacci retracements are also useful if you want an idea of where to set your stop-losses, and your trading app or platform probably has a feature to draw on Fibonacci retracements automatically.
Trend Trading
Trend trading is a strategy that looks to assess the momentum of a security’s movement in a particular direction. The “trend” refers to the direction established by a certain amount of momentum, and the lows and highs of the swings in the trend are compared—if the highs and lows of the swings are both higher, then it’s an uptrend, and vice versa.
If you’re going to use trend trading as your main strategy, you’re assuming that the security you’re looking at is going to move in the same direction as it’s currently trending. To mitigate risk, you’ll also want to set a stop-loss in case there’s a trend reversal.
Reversal Trading
Reversal trading is a strategy where swing traders are looking to profit from the reversal of a trend in the market. During a long bull run, for instance, a trader might spot a signal that things are about to change and enter a short position—Paul Tudor Jones is a famous example of a trader who’s done this, but we’ll get to him later.
Usually, when a trend ends the market consolidates within a range for a while before a new trend sets in. At the end of an uptrend, you’ll see volume start to slow down, and the highs of the swings will be lower as a range starts to form.
The price may then break downward out of this range, representing the reversal of the original uptrend. This pattern repeats extremely often, so traders regard it as a solid technical trading strategy.
Breakout Strategy
A breakout refers to the movement of a price of a security outside of its defined support or resistance levels with increased volume—a breakout usually kicks off a period of volatility and price movement, so there’s money to be made trading it.
To use a simple example, a swing trader can enter a long position after the price breaks through a resistance level—you can look at historical resistance levels for this, Fibonacci retracements, or even psychological resistance levels such as previous all-time highs or round numbers like $100 or $1000.
Once the security starts to trade beyond this previous barrier, it usually trends in the same direction—so when price breaks a resistance it normally trends up, but if it drops beyond a support then it could keep falling.
Simple Moving Averages
Simple moving averages (SMA) are a group of technical indicators that take the average mean of a given set of prices over a specific number of days in the past. It helps to level out the price data of a security over a period by showing an average price that’s constantly being updated.
Moving averages can help to identify the trend direction of a stock and to determine supports and resistances. However, it is very much a lagging indicator since it is very much based on the past by its very definition.
If you want to trade based on moving averages, you might consider entering a long position when a shorter term moving average crosses above a longer term moving average—this is a bullish indicator, and the opposite is true as well.
3 Real World Examples of Swing Trading
1. George Soros
George Soros, born György Schwartz in Budapest, is a billionaire businessman often known under the sobriquet “the man who broke the Bank of England” thanks to his trades during the 1992 Black Wednesday currency crisis in the United Kingdom.
On September the 16th, the United Kingdom held the Presidency of the Council of the European Union and had signed up to the European Exchange Rate Mechanism (ERM). This policy meant that the UK Government would follow an economic and monetary policy preventing the exchange rate between the pound and other member currencies by fluctuating by more than 6%.
However, high German interest rates at the time were stressing the entirety of the ERM and the UK was much worse off economically, with high inflation and interest rates. George Soros and other currency traders began building up massive short positions on the pound, with Soros’ short position hitting $10 billion.
The Conservative UK Government tried to defend the pound, but the ERM required the Bank of England to accept any offers to sell pounds. Traders were however dumping pounds faster than the Bank of England could buy them, and at the end of the day the chancellor of the exchequer announced that Britain would leave the ERM.
The UK Treasury estimated the cost of Black Wednesday at upwards of 3 billion pounds sterling, but Soros made a profit of $1 billion on his $10 billion short sale.
2. Michael Burry
Michael Burry, founder of Scion Capital and famously played by Christian Bale in The Big Short (2015), is well known for predicting and trading on the 2007/08 financial crisis triggered by the US housing bubble.
Burry began focusing on the subprime market in 2005, and concluded through extensive research of mortgage lending practices that US real estate was a bubble that would collapse soon. He saw that bonds based on subprime mortgages would lose value when the original introductory or teaser rates offered to borrowers were replaced by much higher rates that people would struggle to pay.
He then famously shorted the market via credit default swaps purchased from the top investment banks. Despite pushback from investors in his own fund, Burry stuck to his guns and his hypothesis played out—according to his website, he liquidated his short positions by April 2008 and reportedly made $700 million for his investors and $100 for himself.
Burry has more recently bet against Elon Musk’s Tesla as well as the US market itself in 2023, and The Big Short remains one of the best insights into the complexities of 2007/08’s seismic market crash.
3. Paul Tudor Jones
Paul Tudor Jones is another legendary billionaire hedge fund manager, most famous for predicting (and profiting from) Black Monday in 1987. In fact, it was his first lieutenant at his Tudor Investment Corporation, Peter Borish, who did the dirty work with the exact prediction, reportedly mapping the 1987 market against the market trends leading up to the infamous 1929 crash.
In October 1987, policy decisions by the US Government at the time had been putting downward pressure on the stock market following a 5-year bull market, and there was significant selling pressure on funds across the weekend following a bad week. When the market opened on Monday, October 19th, there was extremely high negative sentiment among traders.
Futures trading opened on time at market open, but almost 20% of the S&P 500 and 35% of the Dow Jones Industrial Average stocks opened late thanks to a regulation at the time then allowing market makers to delay trading in a stock if they weren’t able to fulfil trades in an orderly manner.
The Dow fell 22.6% that day and worldwide losses were estimated at well over $1.7 trillion. Tudor Jones was well into the green, though, profiting over 125% (after fees) to earn around $100 million thanks to his short positions betting on a crash.
Is Swing Trading a Good Idea?
Whether or not swing trading is a good idea very much depends on your own appetites as a trader, what your goals are, and at what level of risk you feel the most comfortable. So, here are some of the big pros and cons of swing trading to keep in mind before you dive in.
Pros of Swing Trading
- Potential for gains. Investors who buy securities and hold onto them for the long term generally expect a level of gain that the stock market has historically provided on an annual basis. Swing trading offers multiple opportunities to trade swings within an overall trend, so the amount of money you can make swing trading with the same capital is a lot higher.
- Easy to implement. Another really big advantage of swing trading is that there are very few entry barriers—you don’t need to sit at a computer all day to swing trade. Just fire up your trading app, make your trade, set some stops, and then just keep half an eye on the market for the next few days or weeks before you decide to exit the trade.
Cons of Swing Trading
- Potential for losses. We just mentioned that you can earn more by making more trades, but on the other side of the coin, you can also lose on these same trades. Not every bet is going to be a winner, although you can give yourself the best possible chance of success by upping your understanding of trading analysis and strategy.
- Risk profile. Some trading styles mitigate different risk in different ways, with styles like day trading eliminating fundamental risk by preventing you from holding assets overnight (when the security could tank during after-hours trading if Wall Street finds out some bad news). When you swing trade, you need to be sure that the security you’re holding or position you’ve entered checks out on the fundamental front and has some intrinsic value as well as the right trending direction.
- Trading fees. Picking the right trading platform also becomes important if you’re going to swing trade. Splitting your capital and diversifying risk means more trades, and swing trading itself requires a number of trades too. So, you’ll want to make sure trading fees aren’t chipping away at your gains—and you may be locking yourself out of using trading platforms that provide great features but have high fees.
Discover the World of Swing Trading with Whop
Swing trading is something you can do with a paper account or a little bit of spare cash in order to learn the ropes as you go, but you can give yourself the best chance of success when deploying a little more capital if you skill yourself up in stock analysis and technical trading strategy.
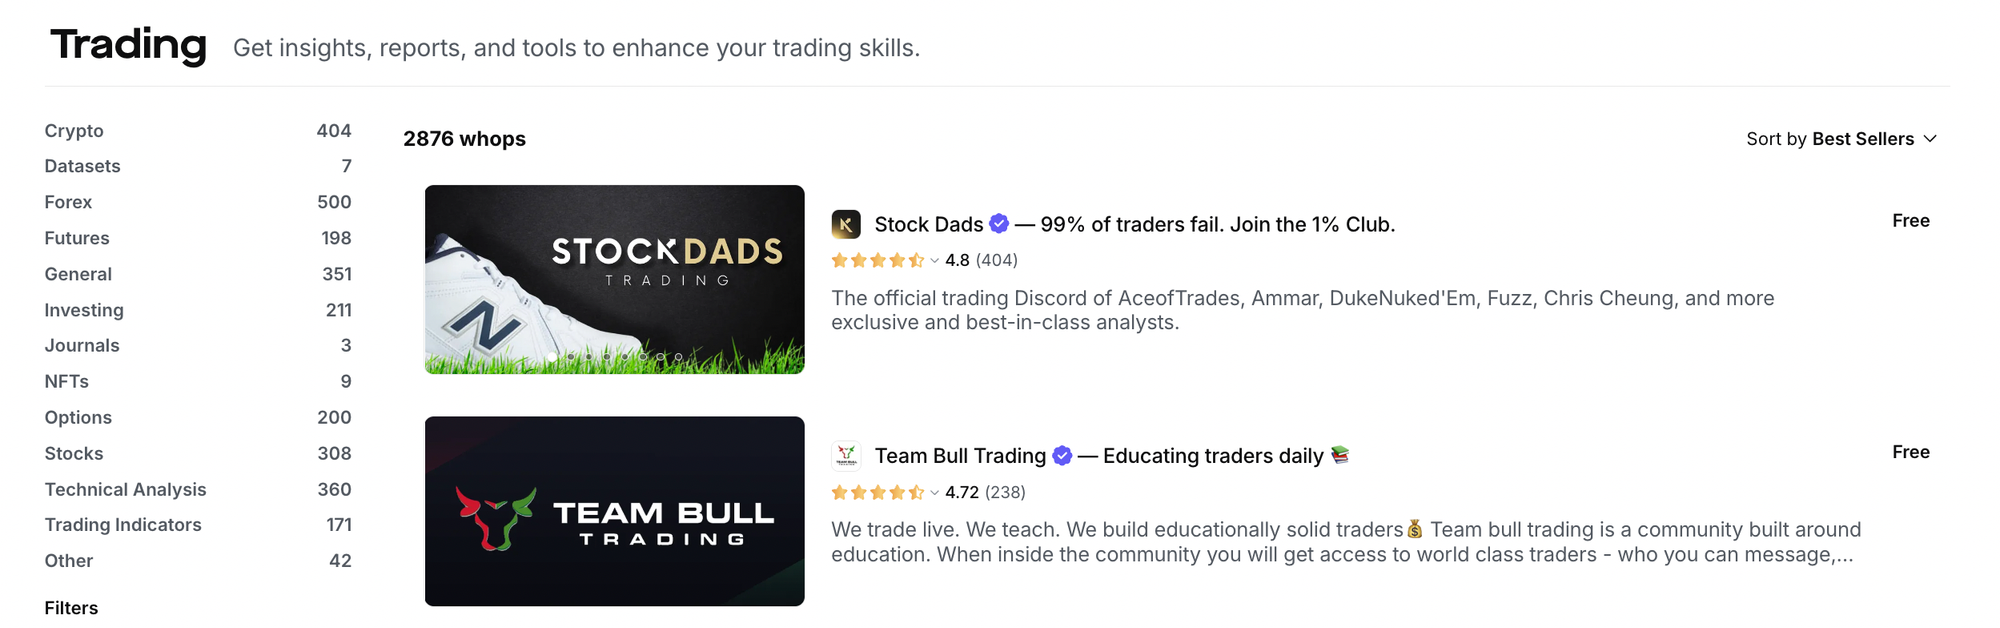
To learn how to execute the strategies we mentioned in this guide and pick up many more, it’s well worth checking out Whop’s trading communities. There, you’ll find some of the best trading Discord servers, Telegram channels, and trader-led groups on the internet—so whether you’re looking for like-minded folks to talk swing trading with or want a more hands-on learning experience like a course, a workshop, or even mentoring, Whop’s trading page is where it’s at.
FAQ
What are the swings in swing trading?
The swings in swing trading are the price changes and fluctuations in the price of an asset or security within the larger trend. Even in a bull market, stocks aren’t going up every single day—there are ups and downs within these longer-term trends that swing traders look to take advantage of.
What are trading indicators?
Trading indicators are calculations made on the price and volume of a security that can help to predict future trends and prices. Examples of trading indicators include moving average convergence-divergence (MACD), relative strength index (RSI) and moving averages which we’ve touched on above.
What securities are best for swing trading?
The right security to swing trade depends on your preferences and tolerance for risk, as well as the amount of time you’re willing to wait for trades to play out. Swing trading an index fund like the S&P 500 works for many people but it can take weeks to see enough movement to really take a decent profit on your trade, while crypto swing traders might see the same movements in a day or three.