Read this article for a roundup of the best ecommerce analytics tools, including what ecommerce analytics is, common metrics you should know, and how to choose the right tools for your ecommerce analytics.
Key takeaways
- Small conversion rate improvements can generate massive revenue gains, making analytics tracking essential for growth.
- Match your analytics tool to your business stage—start with free tools like Google Analytics, then upgrade as you scale.
- Focus on key metrics like CAC, LTV, and AOV to understand unit economics and identify growth opportunities.
You’ve designed a beautiful brand, you have your website live, you have your ad campaigns up and running, and visitors are coming to your site. But, you don’t know where they came from, what they’re doing when they arrive, and why they haven’t made a purchase yet.
Did they come from Facebook or Google? How long are they staying on your page? Are they looking at your product pages?
Analytics for ecommerce stores are imperative for understanding the customer journey and how effectively your site is converting visitors into customers. In this roundup of the best ecommerce analytics tools, we’ll cover what ecommerce analytics is, common metrics you should be aware of, how to pick the right tool, the softwares we recommend, and more.
Know what you're looking for? Jump ahead to:
- What is ecommerce analytics?
- Different types of ecommerce analytics
- Picking the right ecommerce analytics tool
- The 10 best ecommerce analytics tools
- Why do I need to track everything?
- Track your ecommerce data with Whop
What is ecommerce analytics?
Ecommerce analytics are all the metrics from your online store. While it’s an all-encompassing term, common data points to track are site visitors, clicks, customer behavior, and sales.
The analytics of your storefront are vital to track so that you can understand what you’re doing well, and what areas need improvement. Just minor, percentage-point changes in certain metrics can be the difference between lost revenue and additional thousands of dollars in your pocket, depending on how much traffic your site gets. (For some brands, this could even mean millions of dollars.)
The more volume your site is handling, the more important each stat is for improving your ecommerce business. For example, if your store does $1 million in sales each year at a 2.5% conversion rate, just a 0.5% increase in your conversion rate would mean $200,000 more in sales.
Different types of ecommerce analytics

Theoretically, you could measure anything. But here are a few main metrics to look at.
Conversion Rate
Conversion Rate (CVR) is the percentage of customers who take a desired action. This action could be entering their email address, filling out a form, or completing a purchase.
CVR is one of the most important numbers to look at as it measures how many people are doing what you want them to do. Better conversion rates make every part of your business better.
Conversion rate is measured using this formula:
Total # of conversions / total # of visitors = CVR
Customer Acquisition Cost
Customer Acquisition Cost (CAC) is the amount of money you have to spend to get a new buyer. CAC helps you understand your unit's economics and growth opportunities. Higher priced items will often have higher CACs, while less expensive items typically have a lower CAC because the customer has a shorter consideration cycle as they’re not spending all their money.
If you have a strong CAC-to-lifetime value (more on this below) ratio, you’re able to spend more on ad campaigns to achieve great scale and reach more customers.
Customer acquisition cost is measured by:
Sales and marketing expenses / # of new customers acquired = CAC
Lifetime Value
Lifetime Value (LTV) is how much a customer is worth over the course of their lifetime. It’s how much they’ll ultimately spend on your brand in total. LTV is generally higher for consumable products like food & beverage, supplements, and personal care products as customers need to buy them more often.
One-time-purchase products like furniture or cookware will typically result in lower LTVs because they only buy it once or a few times. Having a strong brand, a useful product, and a good retention strategy are all ways to increase LTV.
Lifetime value is measured by:
Average order value x # of orders x retention period = LTV
Average Order Value
Average order value (AOV) is how much a customer spends, on average, on one order. While high-ticket brands may have a lower lifetime value, they’ll typically have a higher AOV.
You can increase AOV by adding upsells to your products and bundling multiple SKUs together. Higher AOVs and LTVs mean that you can afford a higher CAC, as your sales will cover the cost to acquire that customer.
Average order value can be calculated by:
Total revenue / # of orders = AOV
Bounce rate
Bounce rate is the percentage of visitors who only view one page on your website and then leave. Having a low bounce rate means that your content is engaging, your pages are loading quickly, and the user has a pleasant overall viewing experience.
High bounce rates indicate that something on your site isn’t as functional as it could be. Keeping your visitors on the site and navigating to more pages is how you end up converting them into paying customers.
Bounce rate is found out this way:
Total # of one-page visitors / total # of visitors = bounce rate
Time on Site
Time on Site is another measure of how user-friendly your site is. Quick animations, high-quality graphics, and seamless transitions help keep visitors engaged for longer periods of time. Organizing pages and navigation in a logical way is also a great way to encourage those visitors to explore other parts of your site.
The time on Site formula is:
Total time spent on site / total # of sessions = average time on site
Pages per Visit
Pages per Visit is the number of pages an average visitor goes to during their session on your site. The combination of bounce rate, time on site, and pages per visit gives you a comprehensive understanding of how well your site is optimized for real humans.
Pages per Visit can be found by:
Total # of pages views / total # of visits = pages per visit
Picking the right ecommerce analytics tools
As you can see, there are many different ecommerce metrics that you could measure. However, different ecommerce businesses in different stages will need different tools. Here are a few things to keep in mind when choosing your ecommerce analytics tools.
Goal & purpose
Are you looking for a tool to help you increase your order value, optimize your marketing campaigns, or achieve something else? Confirm that the platform you use specializes in the key areas of focus for your business.
If you’re an Amazon-only brand, you don’t need a tool that only specializes in direct-to-consumer sites. If you have multiple distribution channels such as online, marketplaces, and retail stores, then it’s a good idea to find a platform that enables you to track those data points as well.
Necessity
When you’re just starting out, you likely won’t need every trick and feature available today. Start with optimizing for the most basic metrics like CAC and AOV, and then build up from there.
It’s best to keep things simple and only focus on one channel and initiative at a time.
Price-to-value ratio
Similarly, you’ll be spending money unnecessarily if you pay for a tool you don’t actually need. A free tool like Google Analytics will give you more than enough information to get started on your data analytics journey as a small brand.
When you hit a certain level of scale though, advanced analytics software that can handle different inputs will give you, the decision maker, much better information to make impactful choices.
The 10 best ecommerce analytics tools
These are the best tools to help your ecommerce business become more efficient and profitable this year.
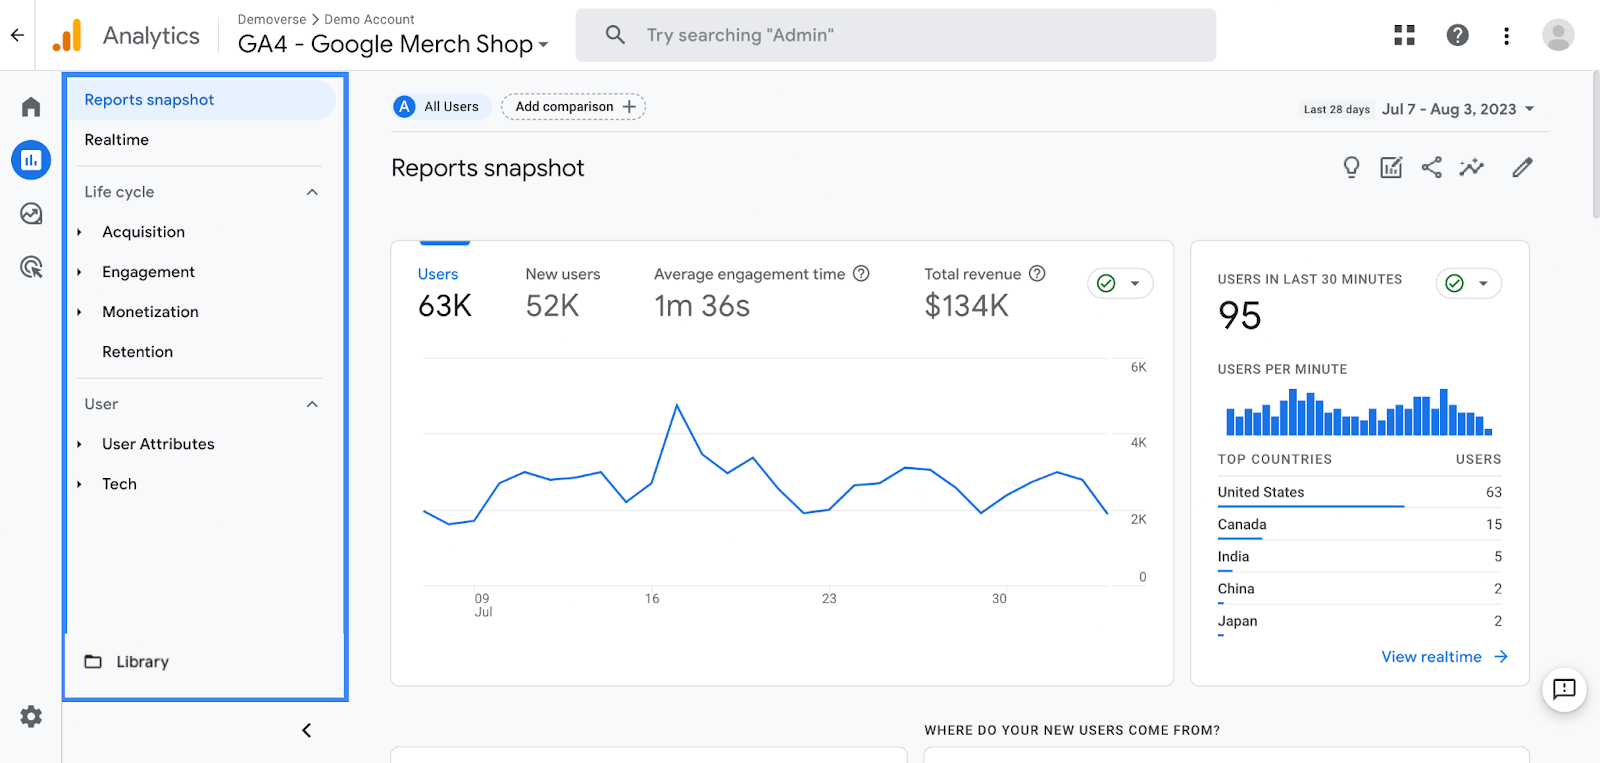
1. Google Analytics
Best for overall site data 🏆
Google Analytics (GA) is Google’s free dashboard to measure site traffic. It collects data on users, time they spend, and how much revenue they generate. It also helps you understand which traffic sources (organic SEO, Facebook, etc.) are bringing the most people to your site. You can use GA as a high-level dashboard to understand multiple facets of your site. GA is one of the most widely used tools for ecommerce brands and companies in other industries like technology and media.
Key features 💻
- Real-time live reporting
- Acquisition-, Engagement-, and Monetization-specific reporting
- Integrates with Google Ads network for more detailed marketing performance tracking
- Gives actionable insights for site improvement based on user activity
- Syncs with your existing Google products you’re already using like Gmail and Drive
Pricing 💰
- Free
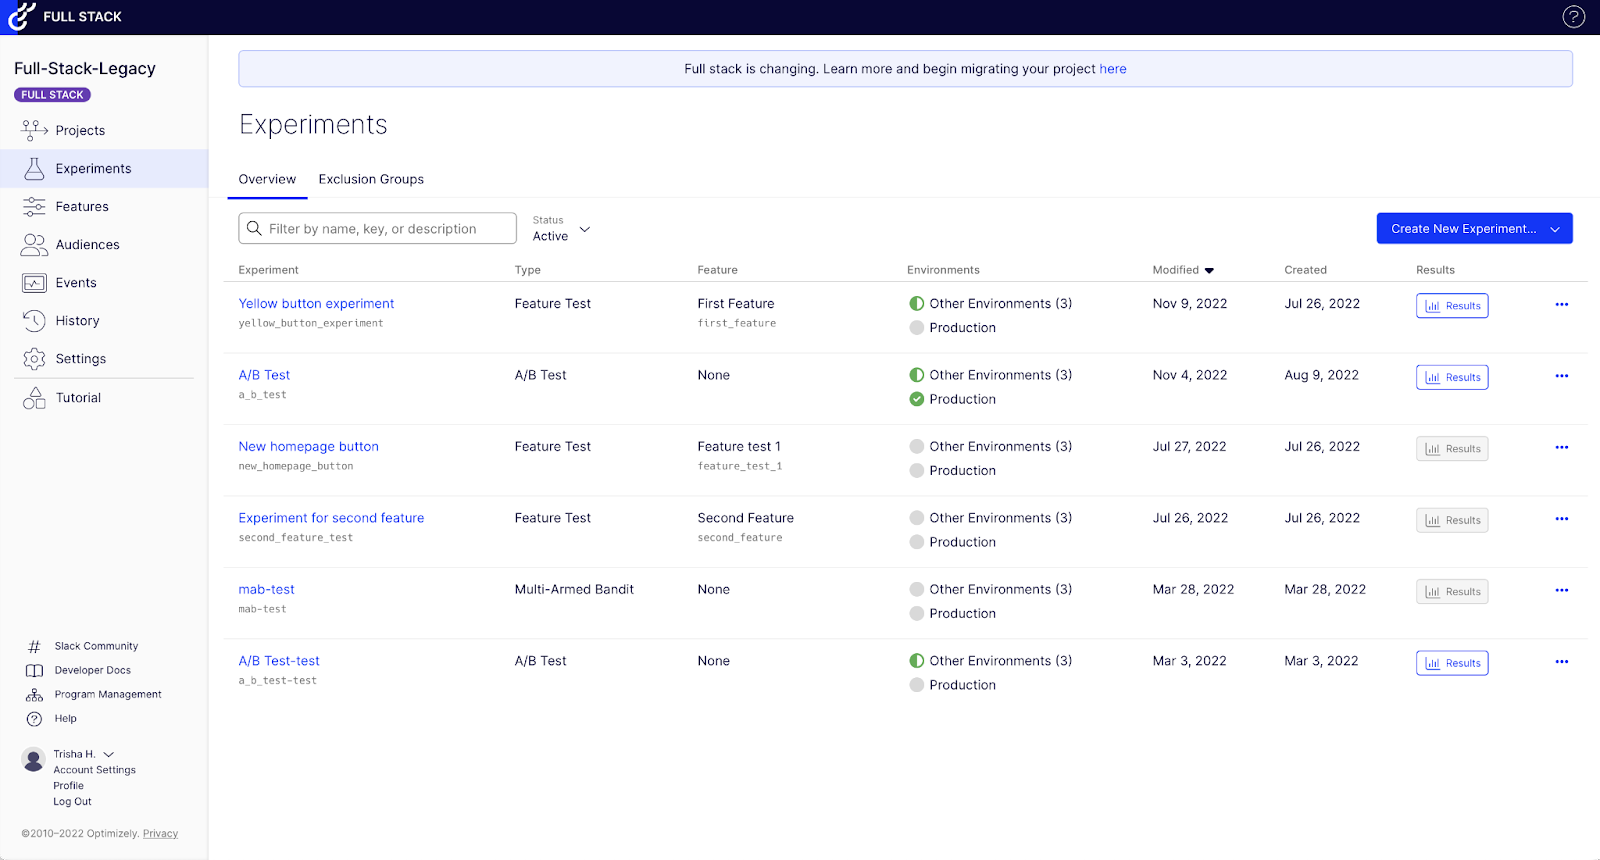
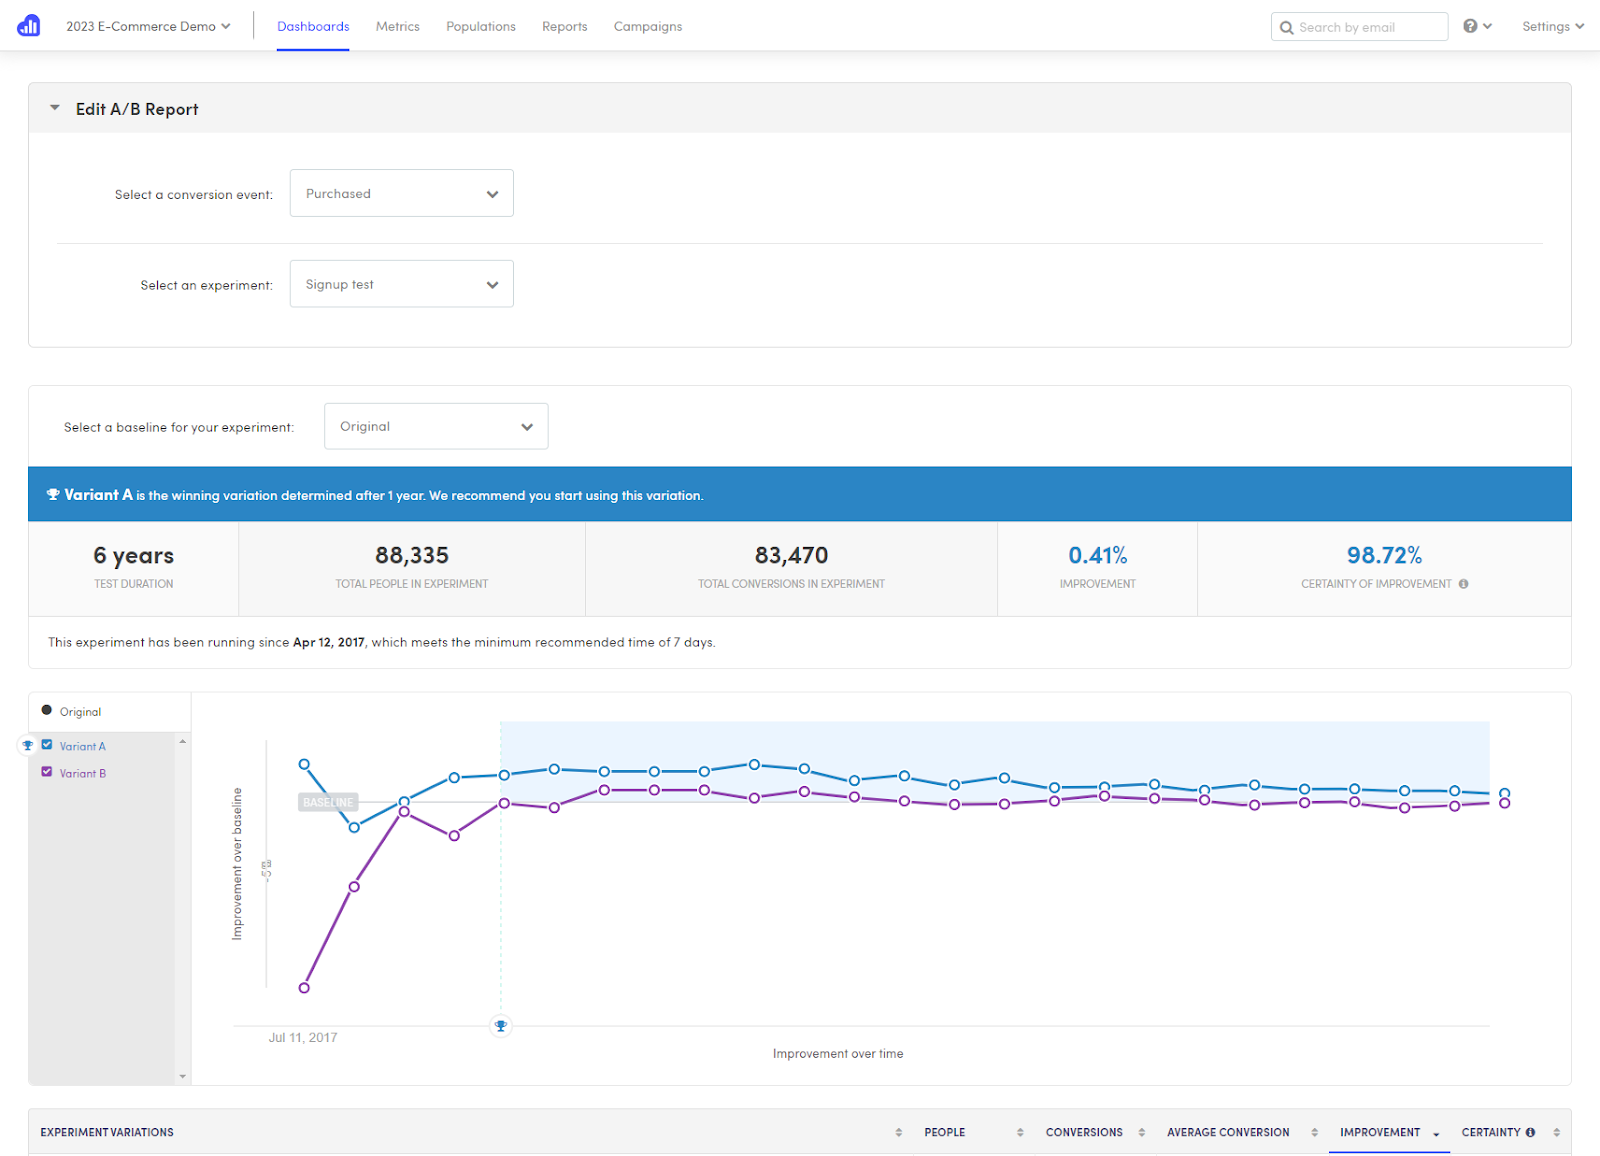
2. Optimizely
Best for digital marketing analytics 🏆
Optimizely helps marketers craft a better overall digital experience for their visitors. It works by connecting content creation, publishing, on-site experience, and A/B testing in one platform to understand how every part of their funnel works together.
Experienced marketing teams appreciate Optimizely’s detailed reporting and advertising-specific design.
Key features 💻
- Integrates with most major softwares and tools
- Built-in content management system for rapid publishing
- Site and feature experimentation
- On-site monetization strategy to extract more value out of visitors
Pricing 💰
- Starts at $0 and paid subscriptions are custom depending on plan type
3. Adverity
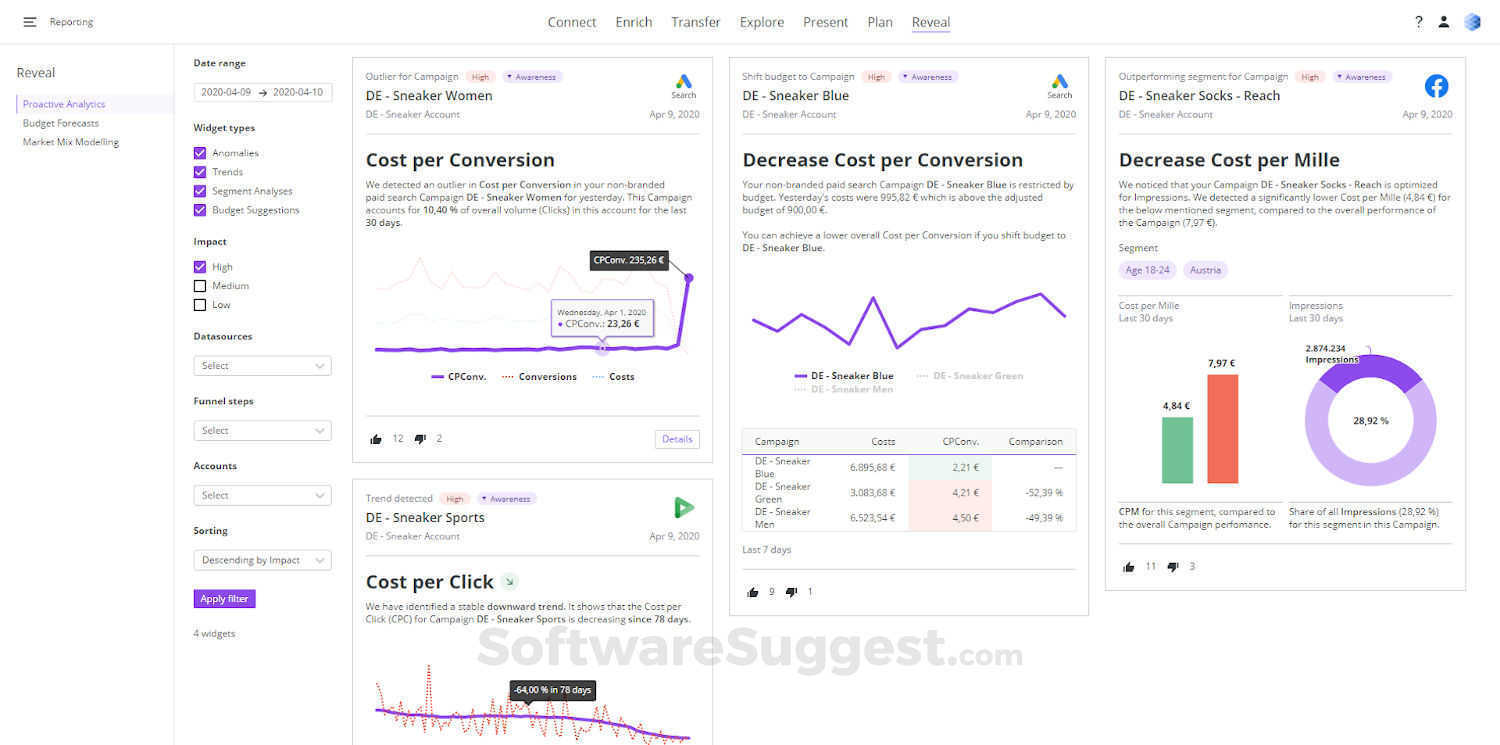
Best for paid ads 🏆
Adverity is another marketing-focused tool that allows agencies, marketing teams, and C-suite executives view campaign data in one central location. It connects any data source through pre-built API connectors and cleanly presents the data in a single source of truth.
Key features 💻
- Machine learning capabilities
- Useful for multiple teams (engineering, executive, etc.), not just marketing
- Tracks ROI on specific channels
Pricing 💰
- Custom depending on company size and needs
4. Geckoboard
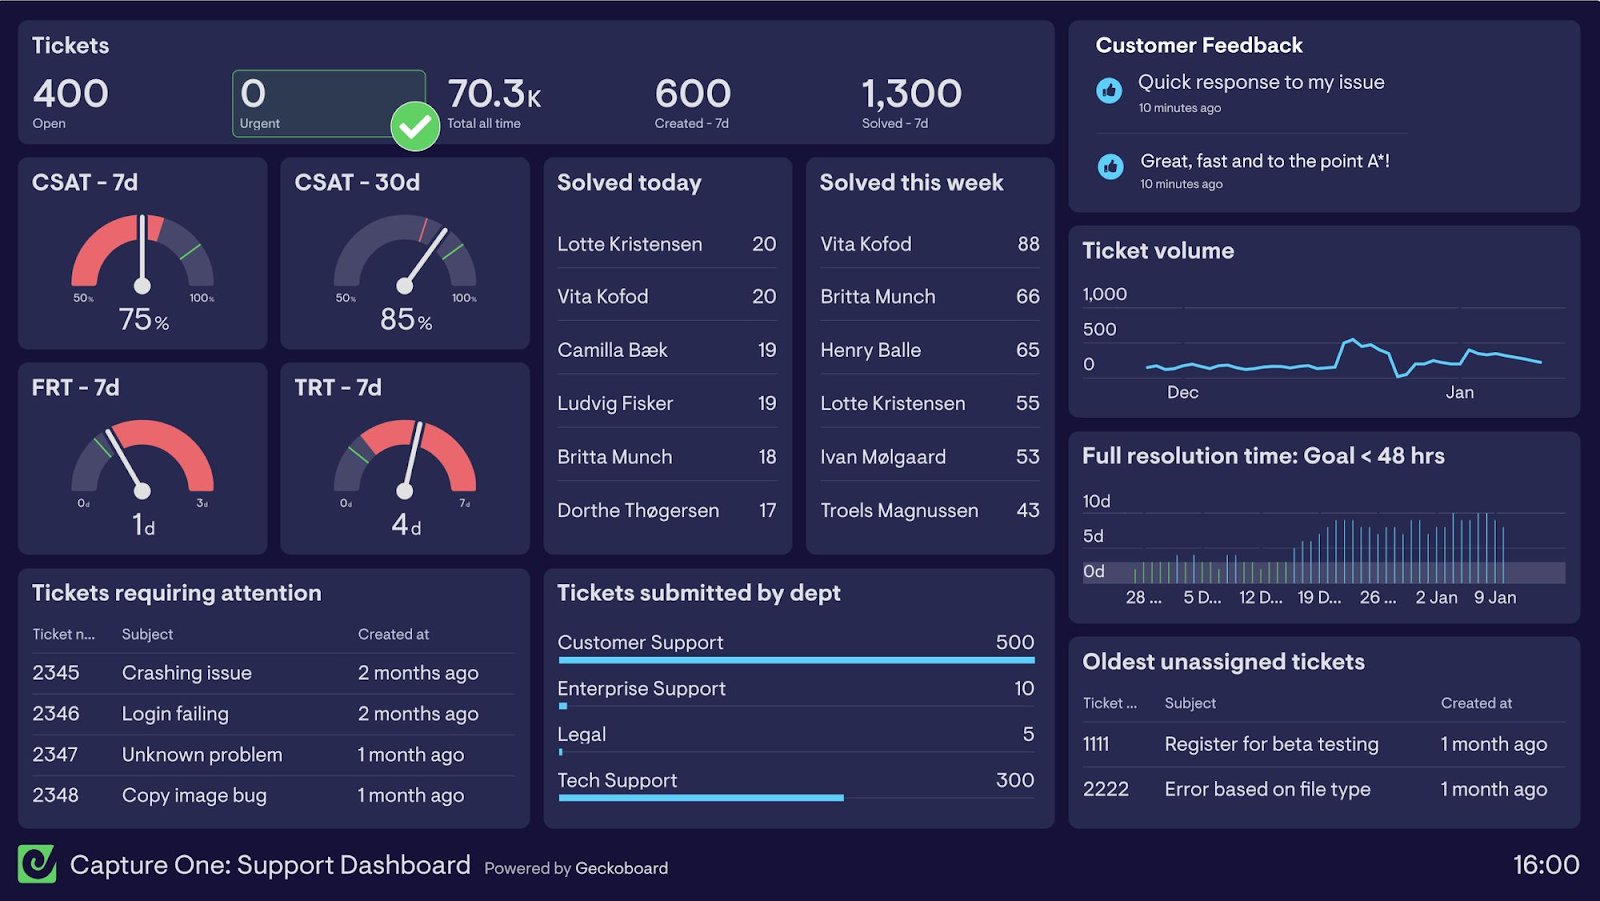
Best for simple dashboards 🏆
Geckoboard is an easy-to-use dashboard builder that lets you monitor the data you care about, and leave out the metrics that aren’t as important to you. You can set up a custom dashboard in just a few minutes and they provide templates specific to ecommerce brands, but also work for other industries. One major benefit is that you can see multiple stats such as support tickets orders in one view, depending on how you set your workspace.
Key features 💻
- Drag-and-drop dashboards
- Connects to over 90 data sources
- Ability to set up notifications via Slack, email, TV, and more
Pricing 💰
- Starts at $39 per month
5. Glew
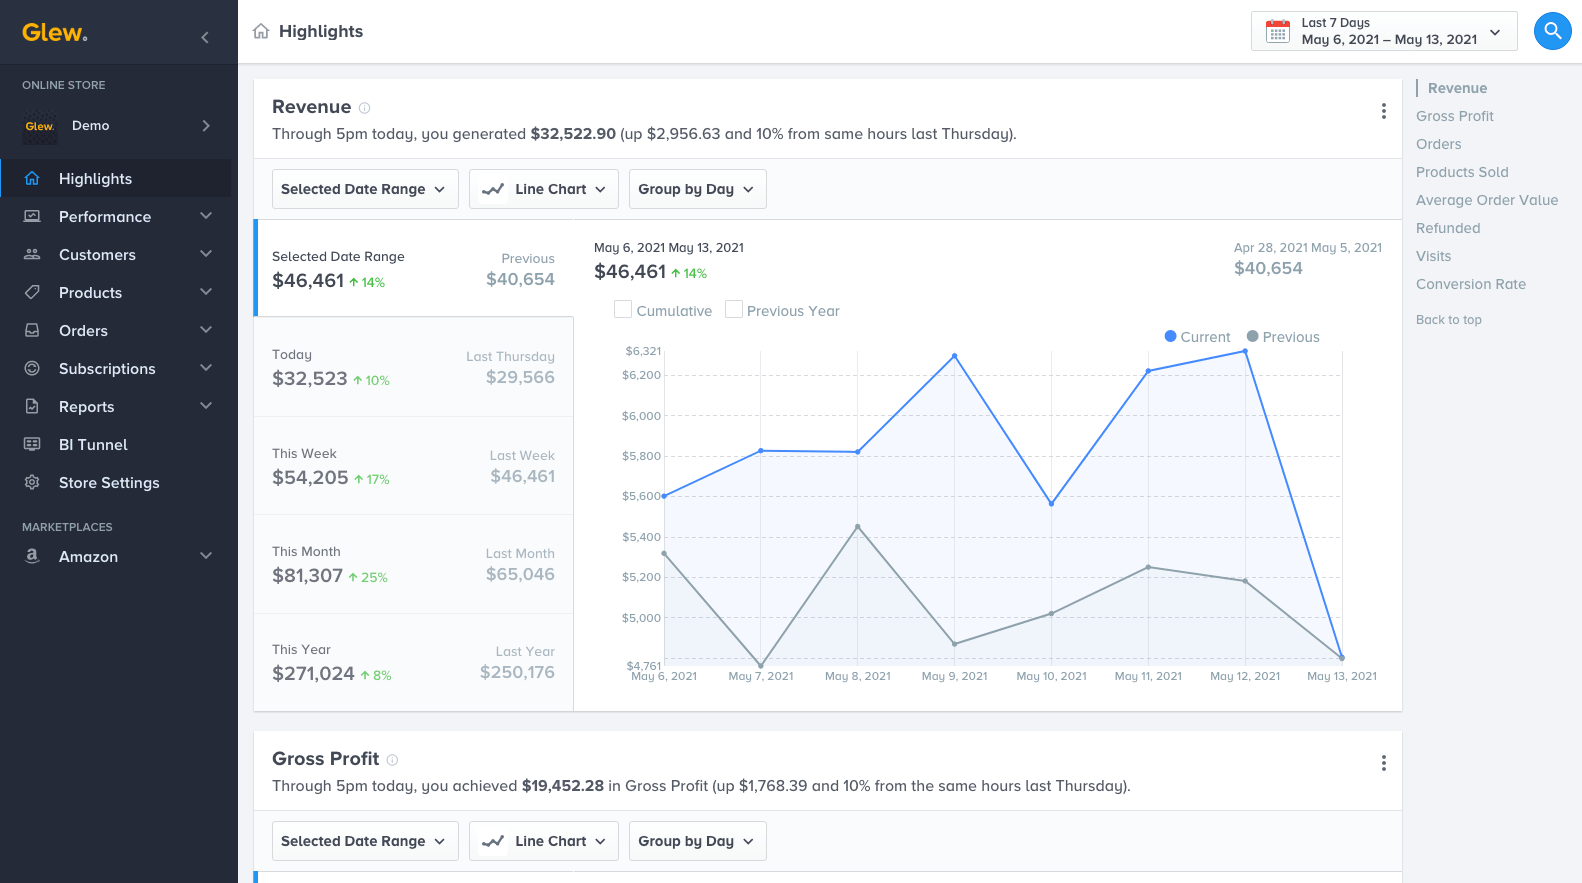
Best for ecommerce platforms 🏆
Glew is the ecommerce-specific data analytics platform that can be used with Shopify, as well as WooCommerce, Magento, BigCommerce, and Salesforce. It gives you actionable ways to increase AOV, measure inventory, and discover in-depth insights on specific customers.
Key features 💻
- Over 180 integrations with tools like Google Analytics and Shopify
- Offers scheduled automatic reports
- Daily snapshots of performance
- Covers a wide range of metrics and KPIs
Pricing 💰
- Custom, free trial
6. Supermetrics
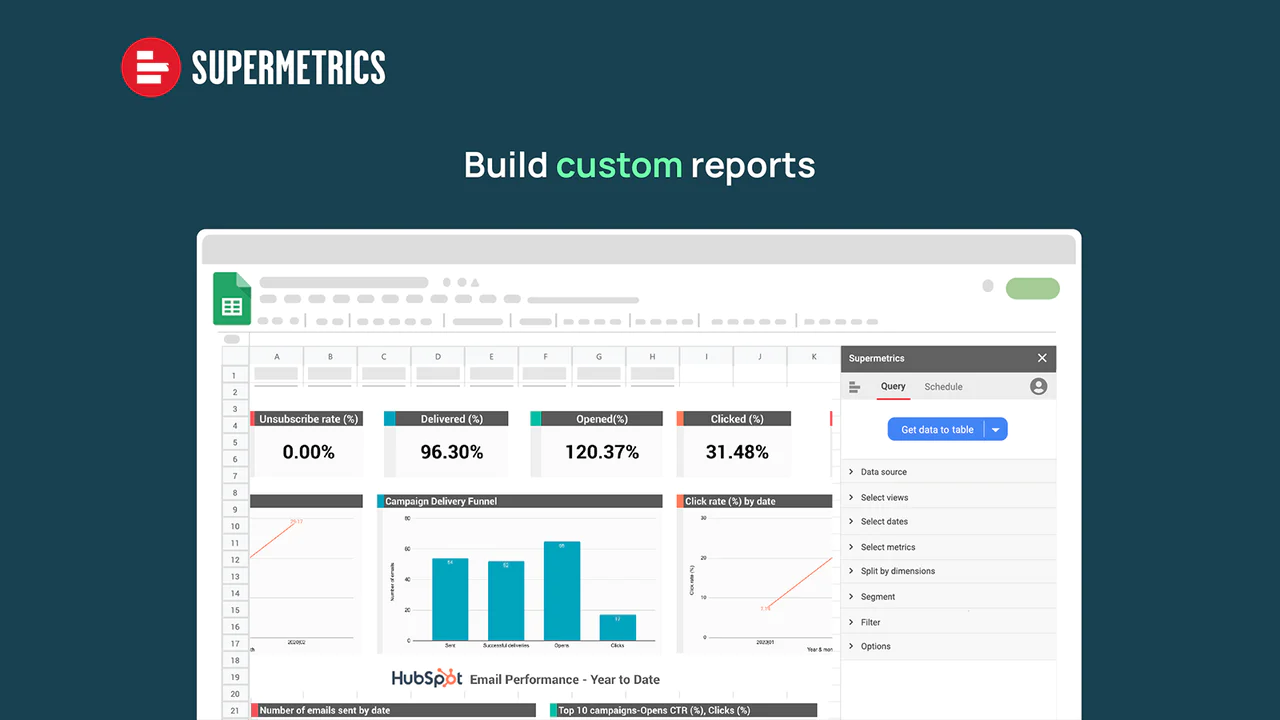
Best for converting data🏆
Supermetrics takes in data from your store, social networks, and other channels and exports them to tools that you’re already using like Google Sheets, Tableau, and Monday.com. 15% of global ad spend is tracked through Supermetrics, so it has the infrastructure to handle any business size. Some of the most valuable insights include understanding the customer journey better, uncovering opportunities to increase AOV, and accurate calculations of your return on ad spend.
Key features 💻
- One-time setup with Supermetrics assisting in management
- Faster reporting time
- Pre-built templates to help you get started
- In-depth customer support
Pricing 💰
- Varying based on destination (starting at $19 per month for Monday.com)
7. Kissmetrics
Best for tracking human behavior 🏆
Kissmetrics is specifically designed to connect the dots between every event that takes place on your site to an action that a human makes. It blends the analytical and emotional parts of your site.
It helps you find more information about your funnel such as where customers are leaving and how to get them to convert at a higher rate. Kissmetrics excels in behavioral analytics, versus solely tracking numbers like some other tools do.
Key features 💻
- Live dashboards and real-time reporting
- Custom event tracking
- Buyer journey tracking and analysis
- Attribution by channel measurement, which is necessary as you ad more traffic sources to your marketing mix
Pricing 💰
- Starts at $25.99 per month
8. Putler
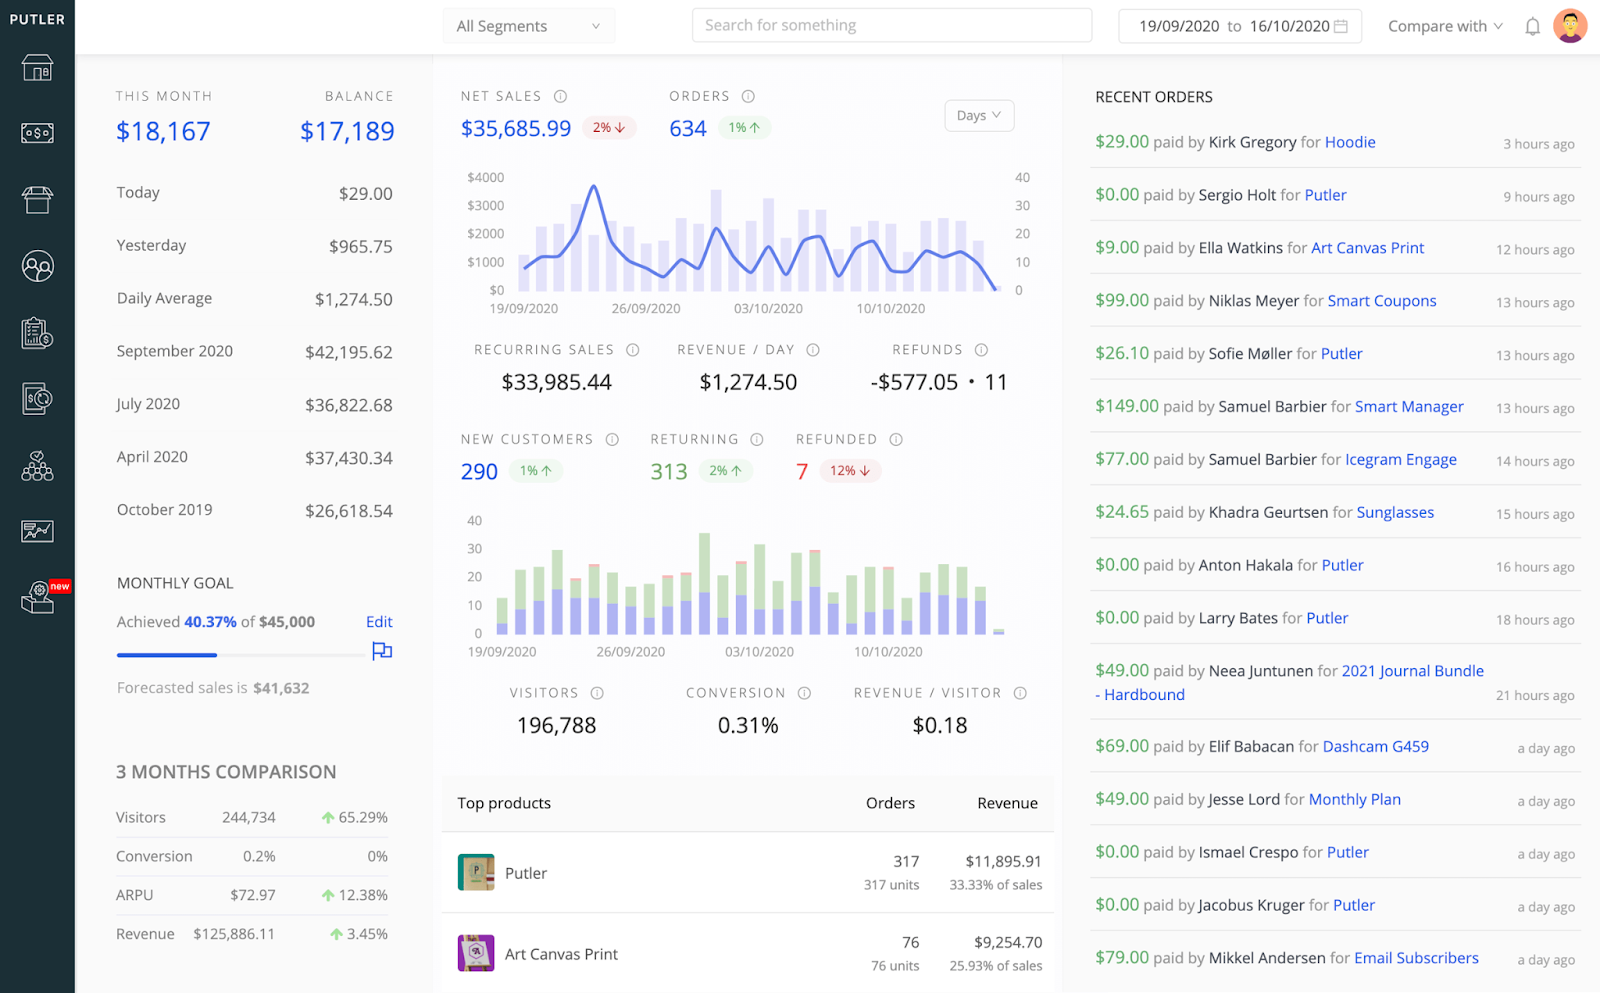
Best for integrating with payment providers 🏆
Putler communicates with payment processors like Stripe and PayPal to ensure that customer information is in sync with charge and refund information. This tool specializes in making sure that your data is clean and in one place — not spread out between Shopify, Google Analytics, and others.
Key features 💻
- Home dashboard with all the major key performance metrics
- Inventory and product management
- Detailed customer information including CVR, LTV, and more
- Sales trends reports
Pricing 💰
- Starts at $20 per month
9. Hotjar
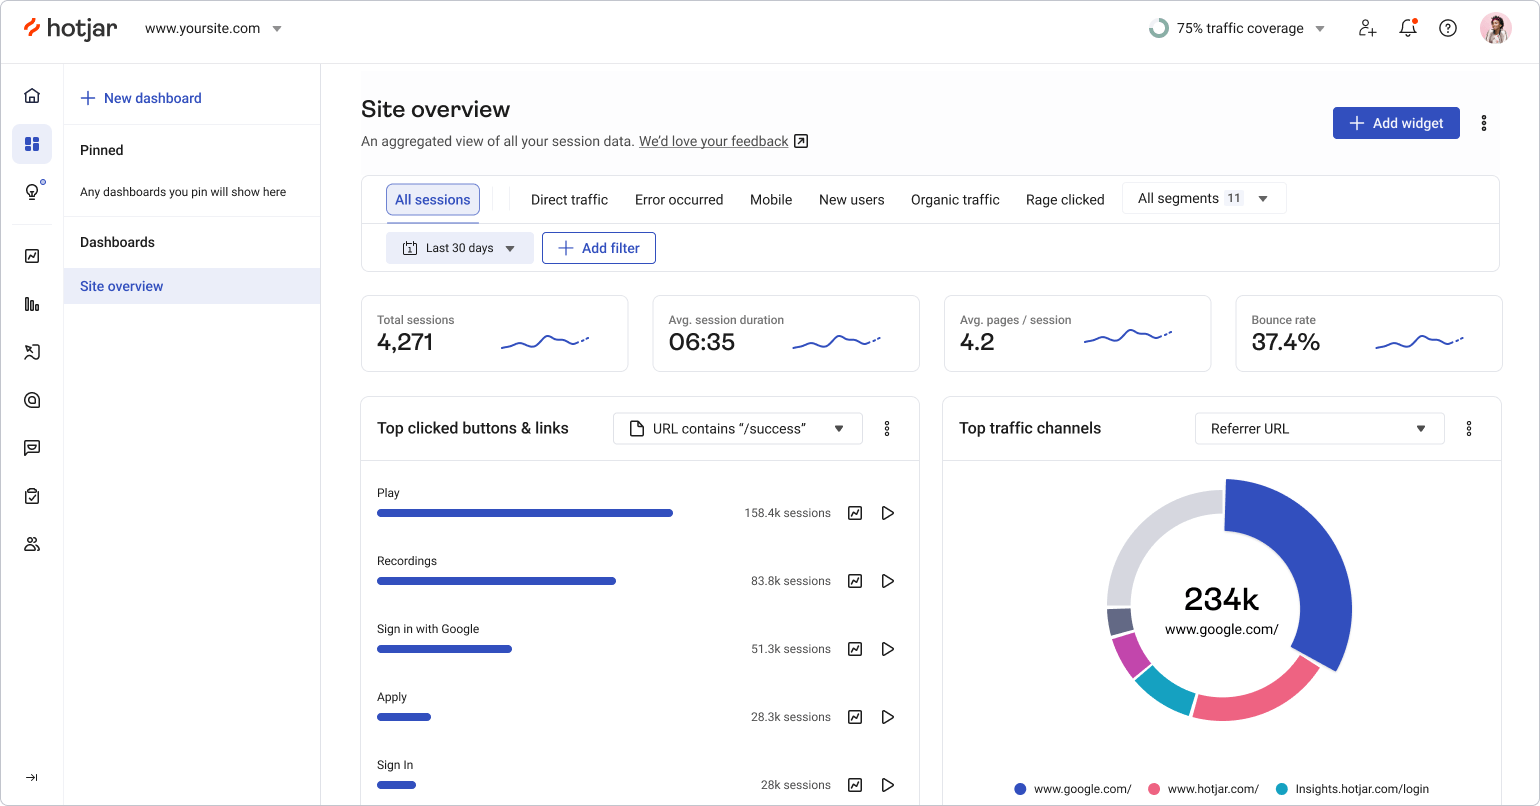
Best for heatmapping 🏆
Hotjar lets you see how visitors are interacting with your site visually. It uses a tool called “heatmaps” that puts data into a consumable format. Heatmaps measure what sections of the website are most viewed, how fast users are scrolling, and more.
If you like to go super deep into conversion rate optimization, Hotjar is the tool for you. Your design team will also love being able to understand what colors, fonts, and layouts create a more engaging experience for users so they can do more of what’s working and take away so-called dead spots on your site.
Key features 💻
- Detailed heatmaps
- Funnel optimization reports
- Customer journey recordings
Pricing 💰
- Free plan and starting at $32 per month
10. Matomo
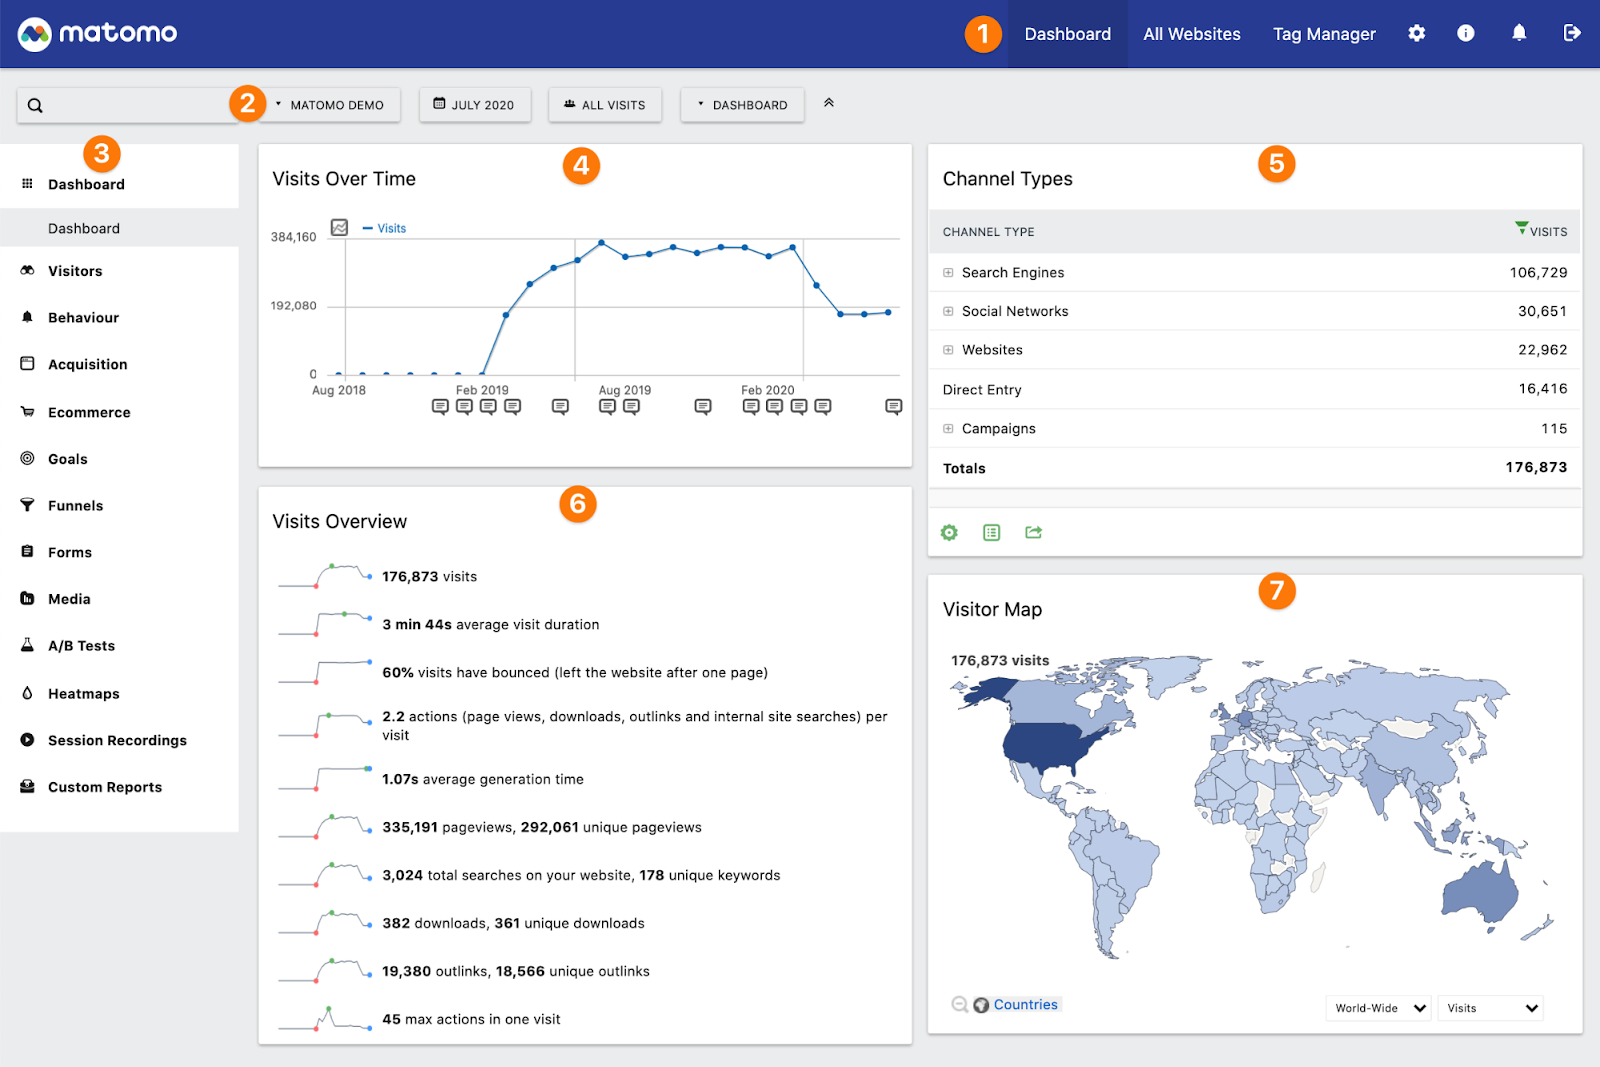
Best for privacy 🏆
Matomo is an alternative to Google Analytics that focuses on protecting customer data. It’s built upon the idea that customers will lose trust in your brand if they learn what Google does with their data, so Matomo is created for building better relationships with consumers.
Key features 💻
- Legally compliant tracking
- Open-source platform
- User-friendly interface
- 100% accurate reporting
- Experts to give hands-on support
Pricing 💰
- Free to use if hosted on your own servers
Why do I need to track everything?
“What doesn’t get measured doesn’t get managed.” While you can definitely go overboard focusing on nitty gritty details that ultimately won’t have an impact on your overall business performance, measuring the things that matter is the difference between success and failure.
With your marketing campaigns, you need to understand what headlines are attracting the most eyeballs, what creative is getting clicked on the most, and what landing pages are actually driving conversions versus those that are losing revenue down the funnel.
Ecommerce analytics tools help you look at all of this in one centralized location, in addition to breaking it out into an easy-to-digest format like a live-view dashboard. Just like a personal budget, tracking these numbers will eventually help you get them more in line with your targets.
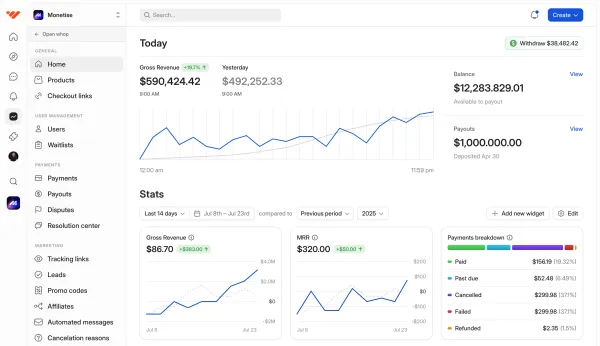
Track your ecommerce data with Whop
If you’re a creative entrepreneur building a brand, ecommerce analytics and data analysis may be some of the things you least look forward to in operating your business. They can sometimes be difficult to understand, it takes a fair bit of technological know how to get set up, and you may not always know exactly what to do with the information you get.
But, this data is extremely vital to improving your business and ecommerce tools like the ones above can help make it all a bit easier. One great way to track your ecommerce analytics and data in one place is with Whop. Whop is an ecommerce platform for digital products and services, and when you sell on Whop you get access to a powerful dashboard. This dashboard gives you incredible oversight of your key financial data, including metrics mentioned above such as conversion rate, lifetime value, and customer retention.
So, if you’re looking to start, grow, or scale an ecommerce business, be sure to check out Whop.