E-commerce analytics lets you crunch key metrics and data to understand website users and generate actionable insights to drive decision-making. Take a look at how you can use ecommerce analytics to boost your sales!
Key takeaways
- Combining qualitative data (why customers behave) with quantitative data (what they do) unlocks actionable business insights.
- Track metrics across the full customer journey—from reach and impressions to conversion and cart abandonment—to optimize each stage.
- Focus on average order value and cross-selling to maximize revenue without needing to increase website traffic.
As an entrepreneur, the world of ecommerce can be a challenge to navigate given the sheer number of competitors, both large and small. So, how can you gain a leg up on the competition, and ensure more visitors to your corner of the web buy more, and more often?
Ecommerce analytics can be that edge, giving you a crucial look into not just a customer’s mind, but into their habits, their behavior, their wants and preferences - what they click on and why, how often, and what they would click or choose if you gave them the option.
Let’s take a deep dive into the world of ecommerce analytics and investigate not just what it is, what tools you need, and how you can harness analytics to supercharge your sales!
Ecommerce Analytics Defined
Ecommerce analytics refers to the process of collecting, analyzing, interpreting, and then acting on data related to your online business. There are various tools and techniques that you can use to gain insights into various aspects of ecommerce ranging from customer behavior to sales performance.
It’s also possible to focus on the entire customer experience with ecommerce analytics, giving you full insight into each stage of the journey from discovery and acquisition, all the way to conversion and retention.
Why are Ecommerce Analytics Important?
Ecommerce analytics are becoming ever more important as the variety of tools available for data gathering grow. This trend isn’t anything new in 2023, but all signs point to it becoming an even more entrenched part of doing business. What this means is companies who neglect analytics and data are subjecting themselves with an even more uphill battle to stay level with the competition.
Effective use of ecommerce analytics and data, on the other hand, allows you to make data-driven decisions. As the crucial leadership function in any business, this is of paramount importance - whatever industry you’re in, making ill-informed decisions is a fast, slippery path toward bankruptcy. Ecommerce analytics gives you the information you need, and not just for the big calls - the granular level of data you can collect and crunch allows you to optimize your ecommerce business in multiple vital areas.
Data, if gathered properly and analyzed well, can help you to study your customers and gain insights into their preferences, as well as how they use your website and what they want from it. It’ll help you retain them more easily and not just convert prospects into sales, but regular customers into priceless advocates. Ecommerce analytics can power up all facets of your business, but there’s more to data than meets the eye. Let's take a closer look at the different kinds of ecommerce data.
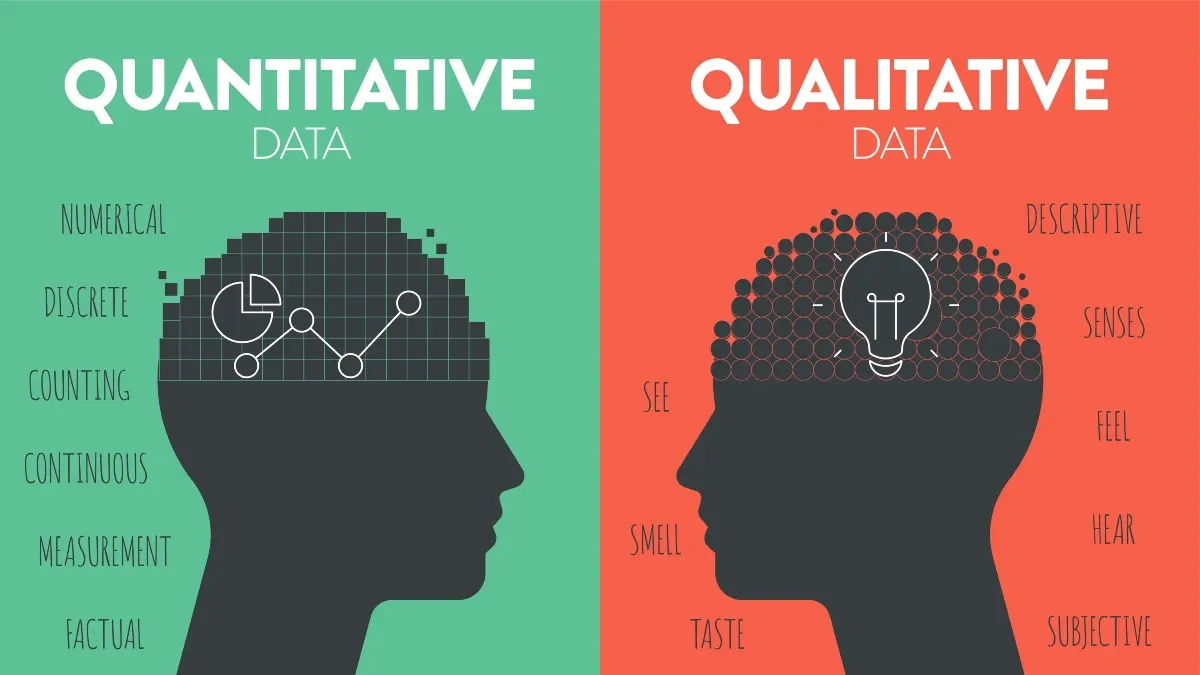
Qualitative vs. Quantitative Data 📈
When it comes to analyzing data, it’s important to make the distinction between the two very distinct categories of data: qualitative and quantitative.
By and large, you can differentiate the two by looking at qualitative data as information that can be counted or calculated and quantitative data as information that is less tangible and more to do with the reasons why people behave in a certain way.
For example, if your online store has 100 daily visits and 50 of those lead to a purchase of your product or a subscription to your service, your conversion rate is 50%. This is a quantitative data point, since it gives you an idea of how many people are spending at your store. What it doesn’t tell you is why those people are buying your product, or why the other 50 percent weren’t interested.
Therefore, to make the most of your business and to get that rate up from the 50% it’s at, you’d be well served in acquiring that qualitative data. When you want to find out why existing subscribers are canceling, for example, you can implement something like an exit survey to ask people why they’re dropping out - this information may lead you to put measures in place that can reduce cancellations going forward.
That’s not to say that quantitative data is somehow less valuable than qualitative data, though. It may be easier to acquire if you’re using a good platform, but there are plenty of businesses who can’t or don’t make full use of it. Simple analysis of quantitative data can bring you a lot of quick, easy wins - analyzing customers’ checkout data, for example, may reveal items that are frequently purchased together. You can then try to actively cross-sell via a simple algorithm.
So, to make best use of data and analytics in your ecommerce business, it’s best to develop ways of collecting, analyzing, and utilizing qualitative as well as quantitative data, since both data types can open up new perspectives. What’s needed, then, is a top-notch solution, or combination of platforms to make things work.
The Best Solution for Ecommerce Analytics
Given the importance of analytics in ecommerce, there are several ways you can go about data collection. Fortunately, one of the best tools in the business is free, and not only that, easy to integrate with top-tier ecommerce platforms like Whop!
Google Analytics, now in its fourth iteration and referred to simply as GA4, is a free cloud-based website traffic analysis tool that puts all the real-time data you need right at your fingertips. It allows you to track what actions your site visitors perform and analyze their behavior, and ensures whatever decisions you do make are backed by the most comprehensive collection of data possible.
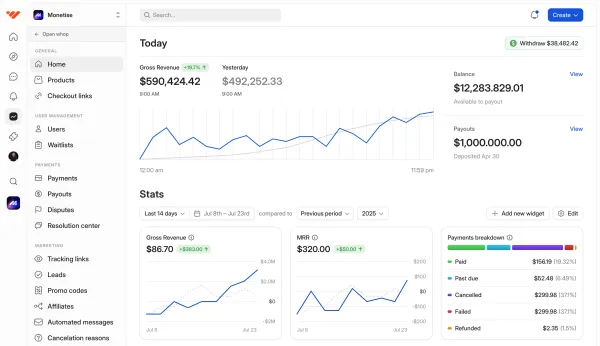
On the storefront side of things, Whop is no slouch either! From helping you track subscriptions and financial data in real time to keeping on top of your payment and even taking care of customer service, Whop does it all.
In addition to that, you can link all of your social media analytics systems alongside your Google Analytics account up with your Whop store to ensure that all of your analytics needs are well and truly covered. Working with Meta, TikTok, Twitter/X, or Pinterest? All of your Pixel IDs can link to Whop!
If you want to take care of all of that before going further, read out guide to setting up Google Analytics - and don’t forget to create your Whop store if you haven’t already!
Key Ecommerce Metrics to Use
Now, let’s take a deep dive into some of the main metrics and data that can be of use to you in your ecommerce journey. With so many befitting a mention, we’ve divided the list into several sections that relate to certain parts of the customer journey.
Acquisition Analytics
When you get familiar with an analytics hub such as Google Analytics, you’ll notice that there’s a lot of information right at your fingertips. It’s important not to sleep on even the most basic data, since they can help you develop crucial insights and develop tools like user personas that can help you attain those ever-elusive pieces of qualitative data.
Demographics, which includes information such as age, gender, location, and even extends to interests and behavior, can easily be looked up on Google Analytics. These are sometimes considered more basic or surface-level metrics, though, so let’s take it down another level and look at some key discovery and acquisition metrics starting at the top of the funnel:
- Reach: This metric looks at how many unique individuals have seen your content (or emails, if you’re looking at email marketing). You might see different levels of reach with different types of content or on platforms.
- Impressions: This is similar to reach, but instead simply counts the number of times your content has been viewed. Impressions don’t account for the fact that a single user can view content multiple times. Among other things, comparing reach to impressions can help you understand if people are coming back to your content and viewing it again.
- Engagement: While reach and impressions correspond simply to your content being viewed, engagement tallies up active interaction with your content via actions such as likes, comments, and shares. Engagement can help you build reach on certain platforms, but what’s important is that it requires the customer to act - there’s so much content out there that the fact that you spurred them to actually lift a finger is actually quite meaningful.
- Click through rate: Impressions are all well and good, but your aim is to have users who see your content visit your site. The CTR measures how many of your impressions actually click on that link in your content. Among other things, measuring the CTR of different types of content can help you fine tune your social media and advertising strategies, and evaluate the effectiveness of your content.
- Traffic. Website traffic is a simple but crucial metric, tallying how many visitors your site gets in a given period of time. You can crunch this in lots of ways, and also break it down into new and returning users, which in turn allows you to evaluate your acquisition strategies and user experience respectively.
- Landing page and Channel breakdown. Available on Google Analytics, both of these reports are really useful. Landing page shows you which pages people see first when they visit your site, and channel breakdown shows you which channels are most effective in driving traffic to you.
- Email sign-up rate. Email marketing is an extremely effective way of boosting sales, and if you don’t use it, you should consider doing so! Then, when you put that opt-in field on your website, you can track how many customers or visitors are signing up. You shouldn’t expect many, but you can boost it by offering discounts on future purchases or some sort of free value.
- Cost per lead: CPL divides your total campaign investment by the number of leads it generates, giving you an idea how much each lead costs to generate. This can help you evaluate the cost effectiveness of different types of campaigns.
- Cost per acquisition: CPA on the hand divides total campaign investment by the number of purchases made, showing you your acquisition cost. This can be vital since you also have to keep an eye on your gross profit margin and ensure that your acquisitions won’t cost you more money than you make.
Conversion Analytics
While conversion can definitely be regarded as a component of acquisition, it’s important enough of a topic to get its own section! The process of converting a click-through to a paying customer is hugely important in ecommerce, so let’s look at a few specific metrics in greater detail:
- Sales conversion rate: This is a crucial metric looking at how many of your website or store visitors actually make a purchase. There are many ways to improve this metric, but it also shouldn’t be viewed in isolation - 5 conversions out of 10 visits is still the same rate as 50,000 conversions from 100,000 visits, but the latter is definitely preferable to the former.
- Average order value: This metric divides the amount of money your ecommerce store generates by the number of orders that have been placed. It’s a metric worth looking into, especially if your store has related items that could be cross-sold effectively. In fact, bumping your AOV as high as possible is one of the most efficient ways of maximizing your business potential and increasing your revenue without having to increase the number of store visitors.
- Cart abandonment rate: Very much an ecommerce phenomenon, this is the number of store visitors who add items to their basket but exit your website before completing the purchase.
- Add-to-cart rate: It’s also important to look at how many visitors placed at least one item in their shopping cart. While some will abandon their cart, studying this metric can provide insights as to how users are shopping in your online store.
- Checkout abandonment rate: Similar to cart abandonment rate, this tells you how often customers are leaving after getting to the checkout stage. This could simply be down to user distraction, but can also be down to broken checkout flows or not seeing their preferred payment method. One way to alleviate this concern is by using an online store at Whop, which gives your customers the ability to pay practically however they want, with payments accepted from currencies in over 135 countries. Whop even accepts crypto payments!
- Return on ad spend: By dividing the revenue you earn by the amount you spent on advertising, you can judge the effectiveness of different ad campaigns and marketing activities.
Engagement Analytics
It’s also extremely important to understand how your store or website users interact with it, and find out what they’re looking for. Google Analytics tends to be an extremely useful tool for this, but what should you look for? Here’s the scoop:
- Search terms: Finding out what search terms your visitors are looking for can help you tailor your content and stock your store with exactly what they want. This, like many items on this list, can be accessed directly from your Google Analytics dashboard.
- Behavior flow: Another of Google Analytics’ best reports, this shows you exactly what the journey of your site visitor is like. It’s also possible to filter this data by source to isolate and study customer journeys by channel, which can help you develop terrific insights.
- Average time on page: A criticism often aimed at younger generations is that they have shorter attention spans than ever before. Even if true this may not be their fault given the amount of information being thrown at them - but whatever your feelings are on the matter, you can get a data driven perspective on how long your site viewers are willing to spend on your site with this data point. This can help you optimize your site’s content and content marketing strategies!
- Session duration. This is a similar metric, but it captures the amount of time a user stays on your site rather than on a particular page.
- Bounce rate: This is the percentage of website visitors who visit your site and then leave immediately. It can be a great KPI for you to track.
- Scroll depth. Some pages, especially those with a lot of listings or text content, may see the user having to scroll down to reach all of it. Not every user will do so, which can highlight where the user loses interest. It may also be that users click through to other links or CTAs before that point, though.
- Exit by page: Another useful metric in showing you potential areas of improvement, exit rate or exit by page shows you how often your site visitors are leaving individual pages. This can help you identify underperforming pages and fix them up, keeping your visitors on-site for longer.
Retention Analytics
A lot of businesses find out (generally too late) that retention is paramount to good financial health. It can be a bit of a pivot from that start-up mentality of acquisition-above-all-else, but in order to build a solid, sustainable ecommerce venture, retention is king. Existing customers don’t cost as much to retain as acquisition does, and they tend to spend more and more, out-stripping newer customers significantly. So, here’s a small selection of the main retention metrics worth looking at:
- Customer lifetime value: CLV (or LTV) is a metric that transcends ecommerce and is important to just about every sort of business type and model out there. What it represents is simple, though - it looks at how much money a customer is going to spend at your business across their “lifetime”. Meaning, for example, the cost of a subscription multiplied by the number of months an average subscriber stays subbed, or the price of a car multiplied by the number of cars the average customer buys from you before they stop or move to another brand or dealer. Increasing CLV is the goal of any well-managed company, but it can also be used with other data points to generate insights. Looking at CLV for different marketing channels, for instance, can tell you which channels generate the most valuable customers for your company.
- Retention and churn rate: These directly measure your retention ability, with churn rate showing you the percentage of customers you lose over a period and retention rate essentially doing the reverse. You can compare your levels to those of the rest of your industry or niche, and also implement various strategies to improve them.
- Active and passive churn: One reason why it’s important to look at churn and retention separately is to drill right down to specifics. Churn can be divided into active and passive churn, with the former referring to users who actively cancel a subscription. Passive churn, on the other hand, means that customers don’t go out of their way to cancel - their credit card may just have expired. You can tackle these different issues in different ways once you’ve identified them.
- Net promoter score: NPS goes a little beyond mere retention since it doesn’t just look at your ability to hold on to customers, but also the willingness of your customers to recommend your product, store, or service to others. This can be a valuable (and free!) means toward acquiring more customers, but it can also serve as an early warning signal - a customer who scores very low on this advocacy scale may be unhappy, and therefore likely to churn if not dealt with.

Ecommerce Analytics Best Practices
Now that you know what metrics and KPIs to look out for, you’re in a great position to take your ecommerce sales to the next level. It’s worth remembering a few key considerations when it comes to data and analytics, though:
#1. Crunch the Numbers
There are a lot of tools and platforms that you may be using for your ecommerce venture, and plenty of them integrate well together. However, it can be tricky to manage data across so many sources and you may be well served looking into data connectors that allow you to pull data from all of those different services into a central data hub or spreadsheet system.
Even once that’s done, you’ve got a huge collection of raw data but no insights. Even if there are conclusions to be drawn from certain data points, they don’t always tell the true story when viewed in isolation. That’s why it’s important to look at your data through a lens of consumer behavior, build proper models, and include context when crunching your numbers. This way you can gain a clear picture of what’s going on and why.
#2. Take Action
Following directly on from the previous point, clear and concise insights provided by data are valuable because they allow you to act decisively. Having the data to back your decisions gives you evidence and confidence to back yourself, and it can also let you move faster than you otherwise might. In fact, you might even be able to automate a lot of these decisions. When your data models trigger certain conditions via rule-based alerts, you can set up automatic actions that your software then executes.
#3. Use a solid Ecommerce Platform
If rule-based alerts and automating things sounds difficult, you’re just not using the right platforms or services! Great platforms take a lot of minutiae off your hands so that you can focus on delighting your customers, so it’s a very good idea to find one. With Whop, for instance, you can automate things like cancellation discounts, create fully customized promo codes, and receive real-time financial statistics.
Advantages of Using ECommerce Analytics
We’ve already hinted at the advantage of harnessing ecommerce analytics with your own online business, but let’s go into full detail on some of the main benefits:
- Data-driven decisions: The best decisions are made when you have as much information as possible to work with, and analytics give you everything you need in this regard. Rather than having to trust your gut or go with a half-baked hypothesis, you can make data based on hard numbers and high confidence when you’ve got all the analytics in place.
- Targeted marketing strategies: Understanding your website visitors, users, and customers allows you to understand their experiences, preferences, and wants by building user profiles or personas. This in turn can allow you to target different users in different ways if need be, maximizing your potential for revenue from each one.
- Product pipeline optimization: The in-depth knowledge and insights about your customers that you can build via analytics can help you refine your product pipeline since you know what customers want. This can vastly reduce the risk that any products or features you have in the pipeline will flop! Even when some products perform better or worse than others, analytics can help you dig into the reasons why and use those learnings going forward.
- Strategy assessment: Beyond just products and features, analytics can help you keep an eye on the effectiveness of your strategy as a whole. The performance of various metrics can help you judge whether your marketing campaigns are paying off, your customer service is performing, and so on.
- Develop competitive advantages: Not every business leader has a good grasp or understanding of analytics, and some place less value on it than others. While instincts and experience have their place, the ecommerce landscape is always shifting as trends come and go. Analytics give you hard evidence and comprehensive information that you can use to make better decisions than your competitors.
- Inventory management: If you’re dealing with physical inventory rather than digital products and services, analytics can be a lifesaver. You can develop models that predict inventory requirements which will greatly aid your forecasting and planning throughout the year.
- Capitalize on retention: Retention itself is something that analytics can help with, but studies have also shown that most companies make their money from existing customers. Analytics help you to retarget your existing customers, cross-selling and upselling to boost your revenue without needing to rely on acquisition.
- Personalization and UX: Analytics can help you develop a personalized experience for your customers by looking at site usage data, which then helps you keep them interested and engaged. This, in turn, increases the possibility that they spend more on your site!
Stay on top of ECommerce Analytics with Whop!
It’s hard to maximize the potential of your ecommerce venture until you drill down into the inner workings of your website or store and get an in-depth understanding of what’s really going on. A lot of that comes down to understanding the customer, from who they are, how they behave and what they want, to their journey and experience as they navigate your site.
The best way to get a handle on all of that, especially in an online environment, is through ecommerce analytics. That’s what will give you an edge, and it’s best achieved by judicious selection of what tools and platforms you use. Google Analytics is one of the best tools to monitor a lot of your website data, and you’re missing out if you haven’t signed up to Whop as your digital storefront.
Whop gives you a fantastic overview of all of your key financial data in real time, allowing you that perfect eagle’s eye view of your business ticking over. You’re also getting fantastic subscriber analytics, premium customer service to boost your retention, and a significant boost to customer acquisition thanks to your store’s easy discoverability on the Whop marketplace.
Whop takes care of all of that, and best of all, can be linked to your Google Analytics account with a minimum of fuss. With Whop and Google Analytics linked up and working hand in hand, you’ll find yourself ideally placed to optimize your ecommerce business and drive top-line growth like never before.
👉 So, if you’re serious about boosting your sales with ecommerce analytics, get on Whop today. Talk to one of the team to get started, or just go ahead and create an account - you’ll be set up and selling in minutes!