Discover over 100 dropshipping statistics including the industry’s outlook, top niches, key marketing strategies, and more to help you succeed.
Key takeaways
- Dropshipping offers an 80x cheaper startup cost than traditional ecommerce, but 90% of businesses fail within months.
- Electronics, Fashion, and Health categories dominate dropshipping, with experienced sellers earning $10,000-$50,000+ monthly.
- The dropshipping market will reach $476 billion by 2026, representing 75% of all ecommerce sales.
With dropshipping, anyone can build a profitable online business—all without the hassle of managing inventory or handling logistics. It’s no wonder this popular business model is expected to generate up to $2 trillion in revenue by 2033.
Whether you’re a seasoned dropshipper or just starting out, staying on top of the latest industry trends is the key to making strategic decisions. To support your efforts, we’ve carefully curated over 100 dropshipping statistics from leading industry sources.
Keep reading to discover top dropshipping niches, consumer habits, effective marketing strategies, and more.
Key dropshipping statistics
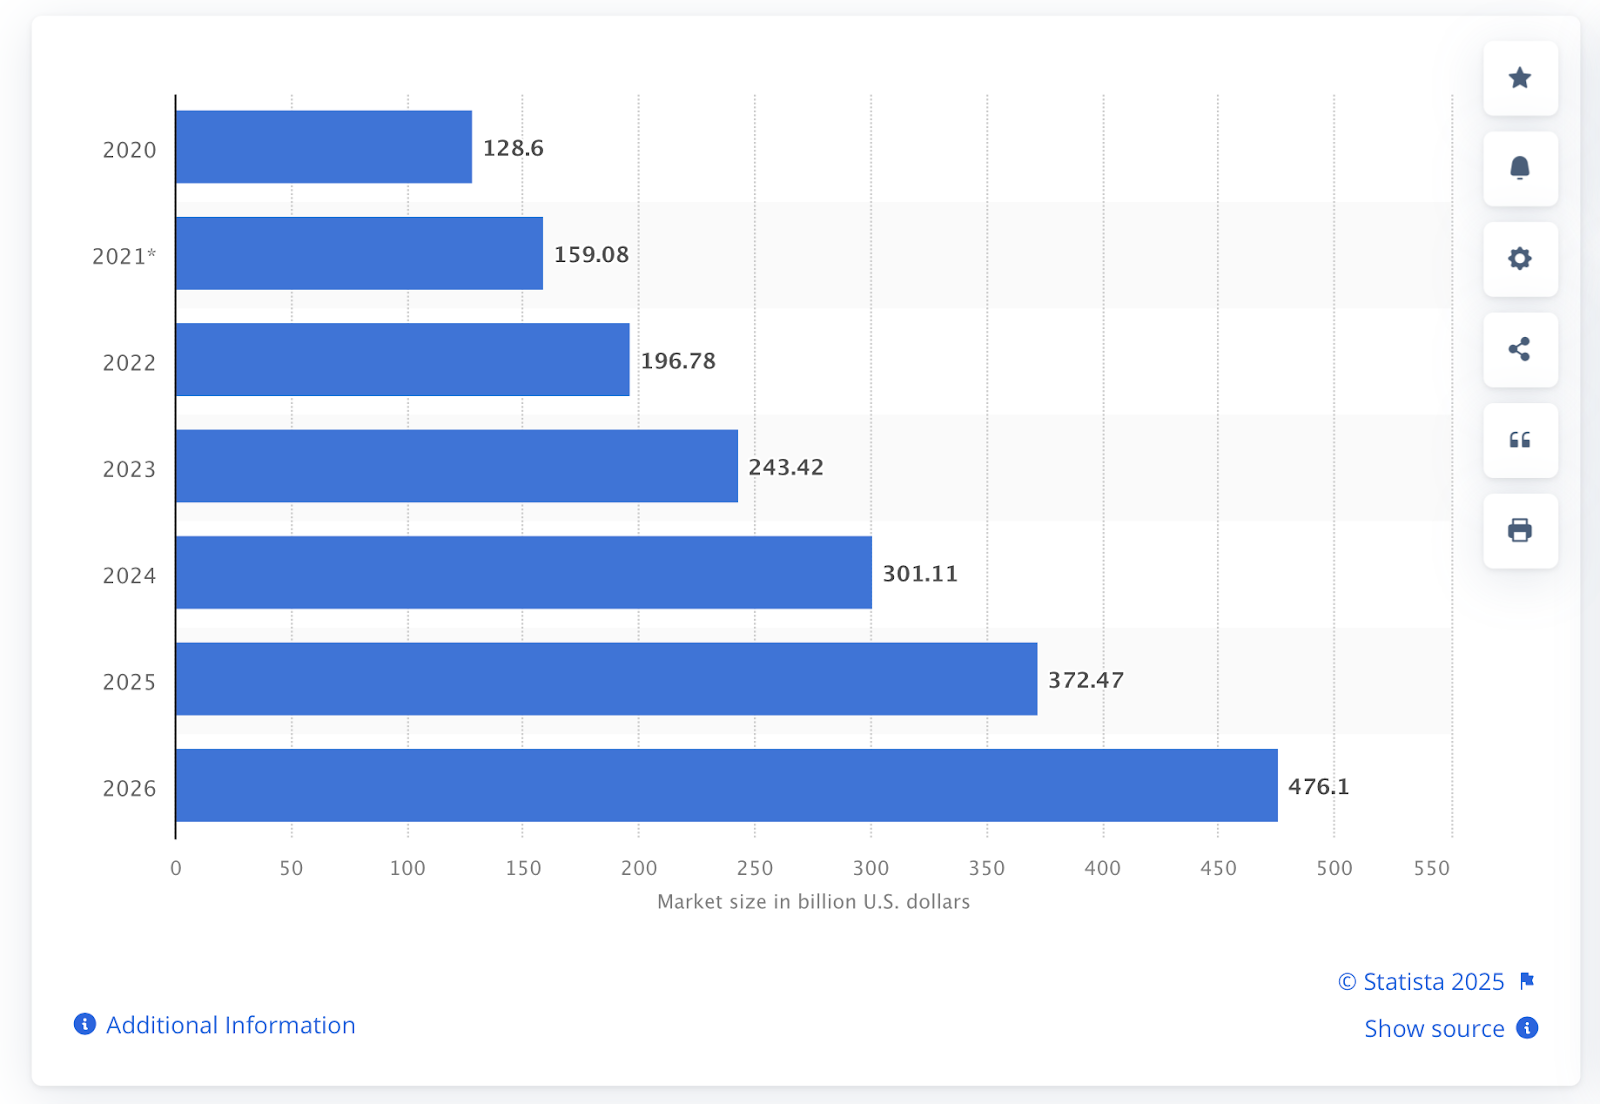
By 2026, the dropshipping market is expected to hit $476.1 billion–a 58% increase year-over-year and a notable 276% increase from $128.6 billion in 20201.
The global dropshipping market has shown steady growth over the last five years. In 2024, the market was worth an estimated $301 billion, up:
- 24% from $243 billion in 2023.
- 53% from $197 billion in 2022.
Beyond 2025, the global dropshipping market is expected to grow at a compound annual growth rate (CAGR) of around 25%2.
Additionally, 75% of all ecommerce sales will be facilitated through dropshipping or a marketplace3.
This amounts to an impressive $1.1 trillion to $2.3 trillion opportunity by 20334.
As of 2025, dropshipping businesses had a success rate of around 10%-20%5.
10% of dropshipping businesses had high success rates during their first year6. In contrast, 90% failed within the first few months. This was primarily due to factors such as:
- Lack of research
- Poor customer experience
- Unreliable suppliers
- Shipping delays
24% of dropshippers were small business owners in 20237.
Of these, most (38%) were Gen Z entrepreneurs.
As of 2024, 63% of dropshipping stores were located in the US.
Meanwhile, 34% of dropshipping stores were located in the Asia-Pacific region.
By sales channel, 83% of the dropshipping market’s revenue came from individual consumers in 20248.
Small to medium enterprises (SMEs) accounted for 17% of the market’s revenue.
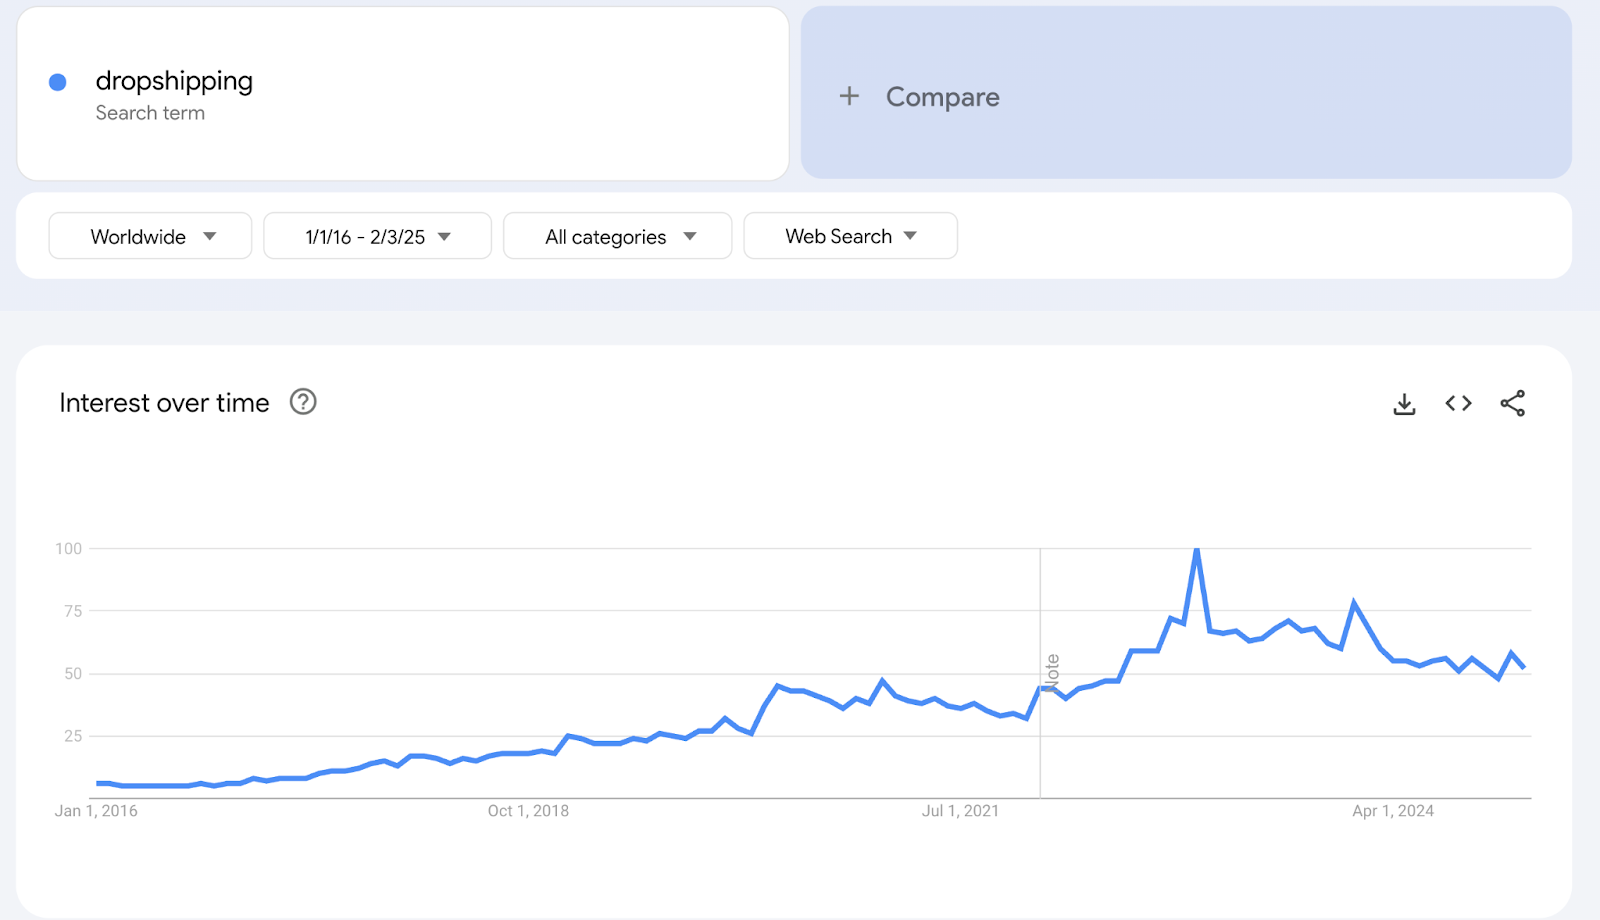
Between 2016 and 2024, Google search interest in the term dropshipping increased, hitting a peak of 100 index points in 20239.
By February 2025, interest levels had fallen to 52 index points, indicating a drop in searches.
Dropshipping market statistics
In 2025, over 2.77 billion people are expected to shop online10.
This marks a 2.2% increase year-over-year and presents a wealth of opportunities for dropshipping entrepreneurs.
Over 21% of all retail purchases took place online in 2024, with ecommerce sales surpassing $6.3 trillion11.
Additionally, more than 30% of ecommerce stores in 2024 used dropshipping as their primary method for fulfilling customer orders12.
For B2C ecommerce, over $4.12 trillion was spent on consumer goods in 2024, up 15% from 202313.
The average annual revenue per online shopper was $1,620, a 5% increase year-over-year.
Growth in traffic to all ecommerce categories across desktop and mobile increased by 1.4% from 202314.
Online ecommerce showed some recovery in 2024, after a 3% drop in 2022.
The Luxury and Jewelry category experienced the most year-over-year growth in visits at 16%.
The Beauty and Cosmetics category was next with a 10.5% growth rate between 2023 and 2024. Fashion and Apparel saw a 1.3% increase in visits, while Electronics was the only category to trend downward, with a 2% drop year-over-year.
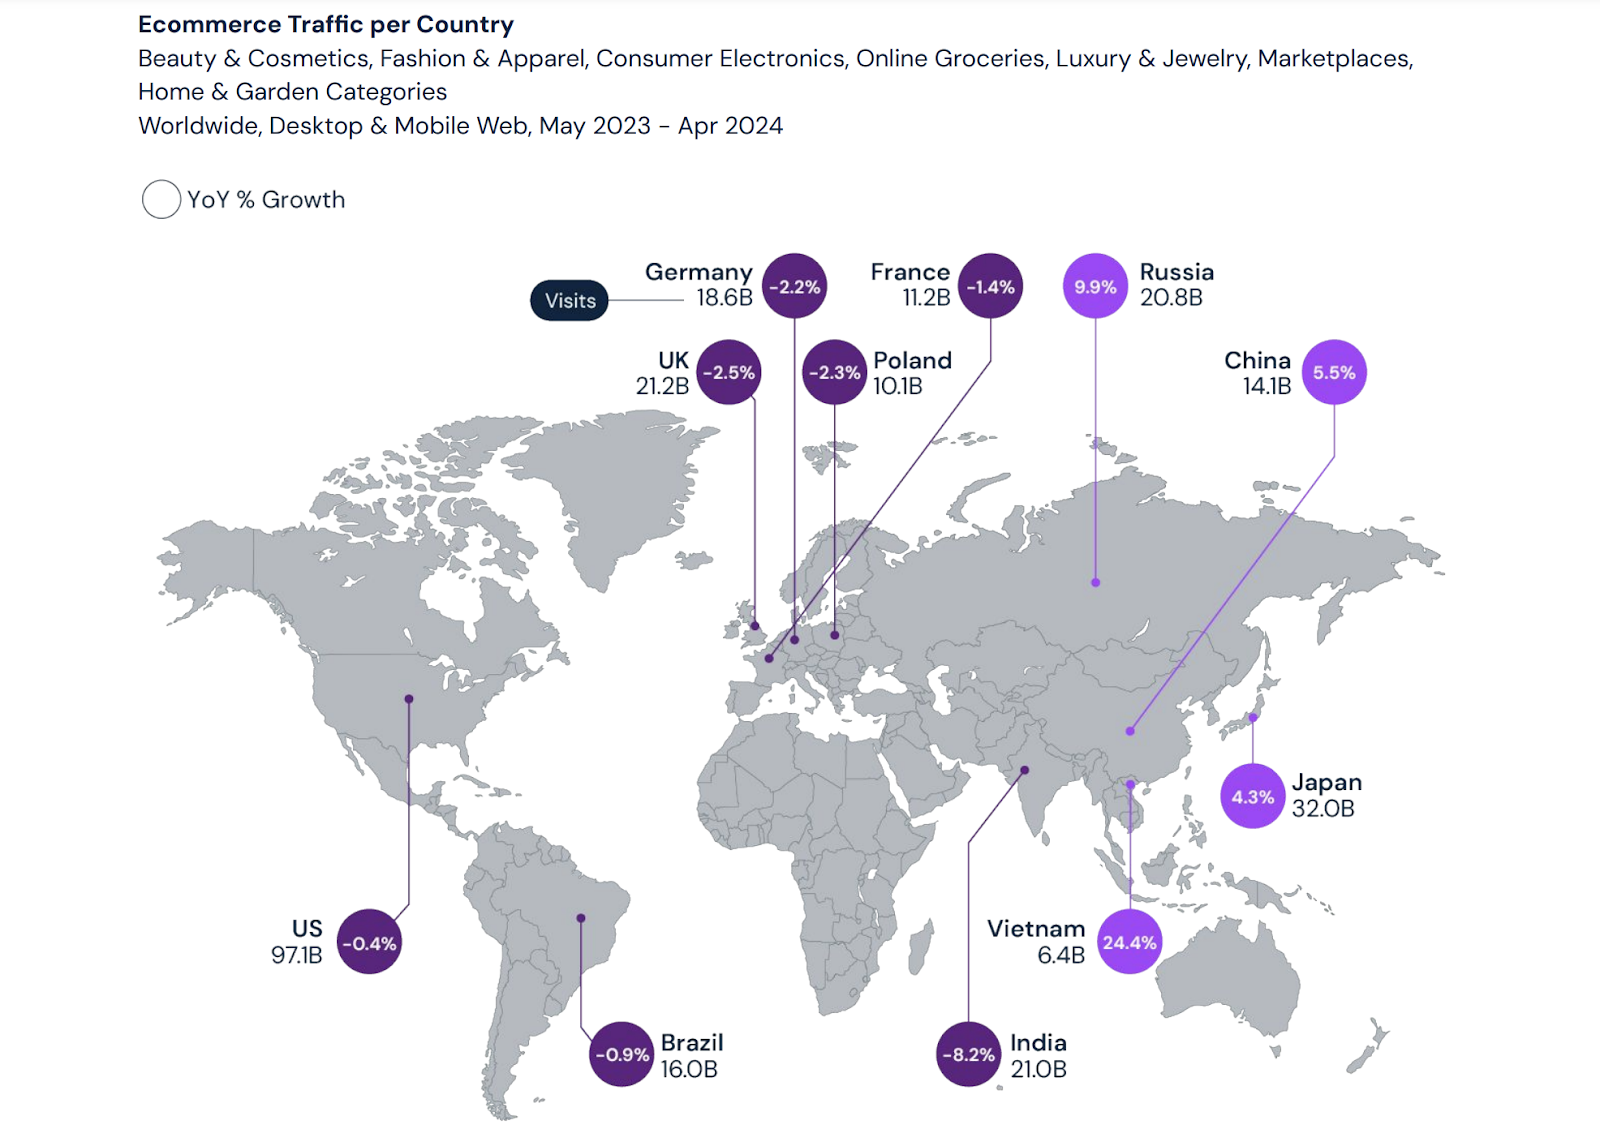
Of the top 25 countries by visits across key ecommerce categories like:
- Beauty & Cosmetics
- Fashion and Apparel
- Consumer Electronics
- Online Groceries
- Luxury and Jewelry,
- Marketplaces
- Home and Garden Categories
60% saw traffic growth while 40% saw declines in 2024. Due to inflation, 70% of the top 10 ecommerce countries experienced negative growth.
Dropshipping earning statistics
According to Zendrop, beginner dropshippers can earn anywhere between $1,000 to $2,000 per month15.
Dropshipping earnings vary from platform to platform and are based on several factors such as niche and experience.
Earnings are higher at $5,000 to $10,000 per month for intermediate dropshippers and for experienced dropshippers, as high as $10,000 to $50,000+ per month.
By allowing business owners to sell products without investing in inventory, dropshipping can increase online store profitability by up to 50%16.
High-ticket dropshippers can even make up to 10x more by selling high-end products.
Dropshipper gross margins range from 20% to 30%.
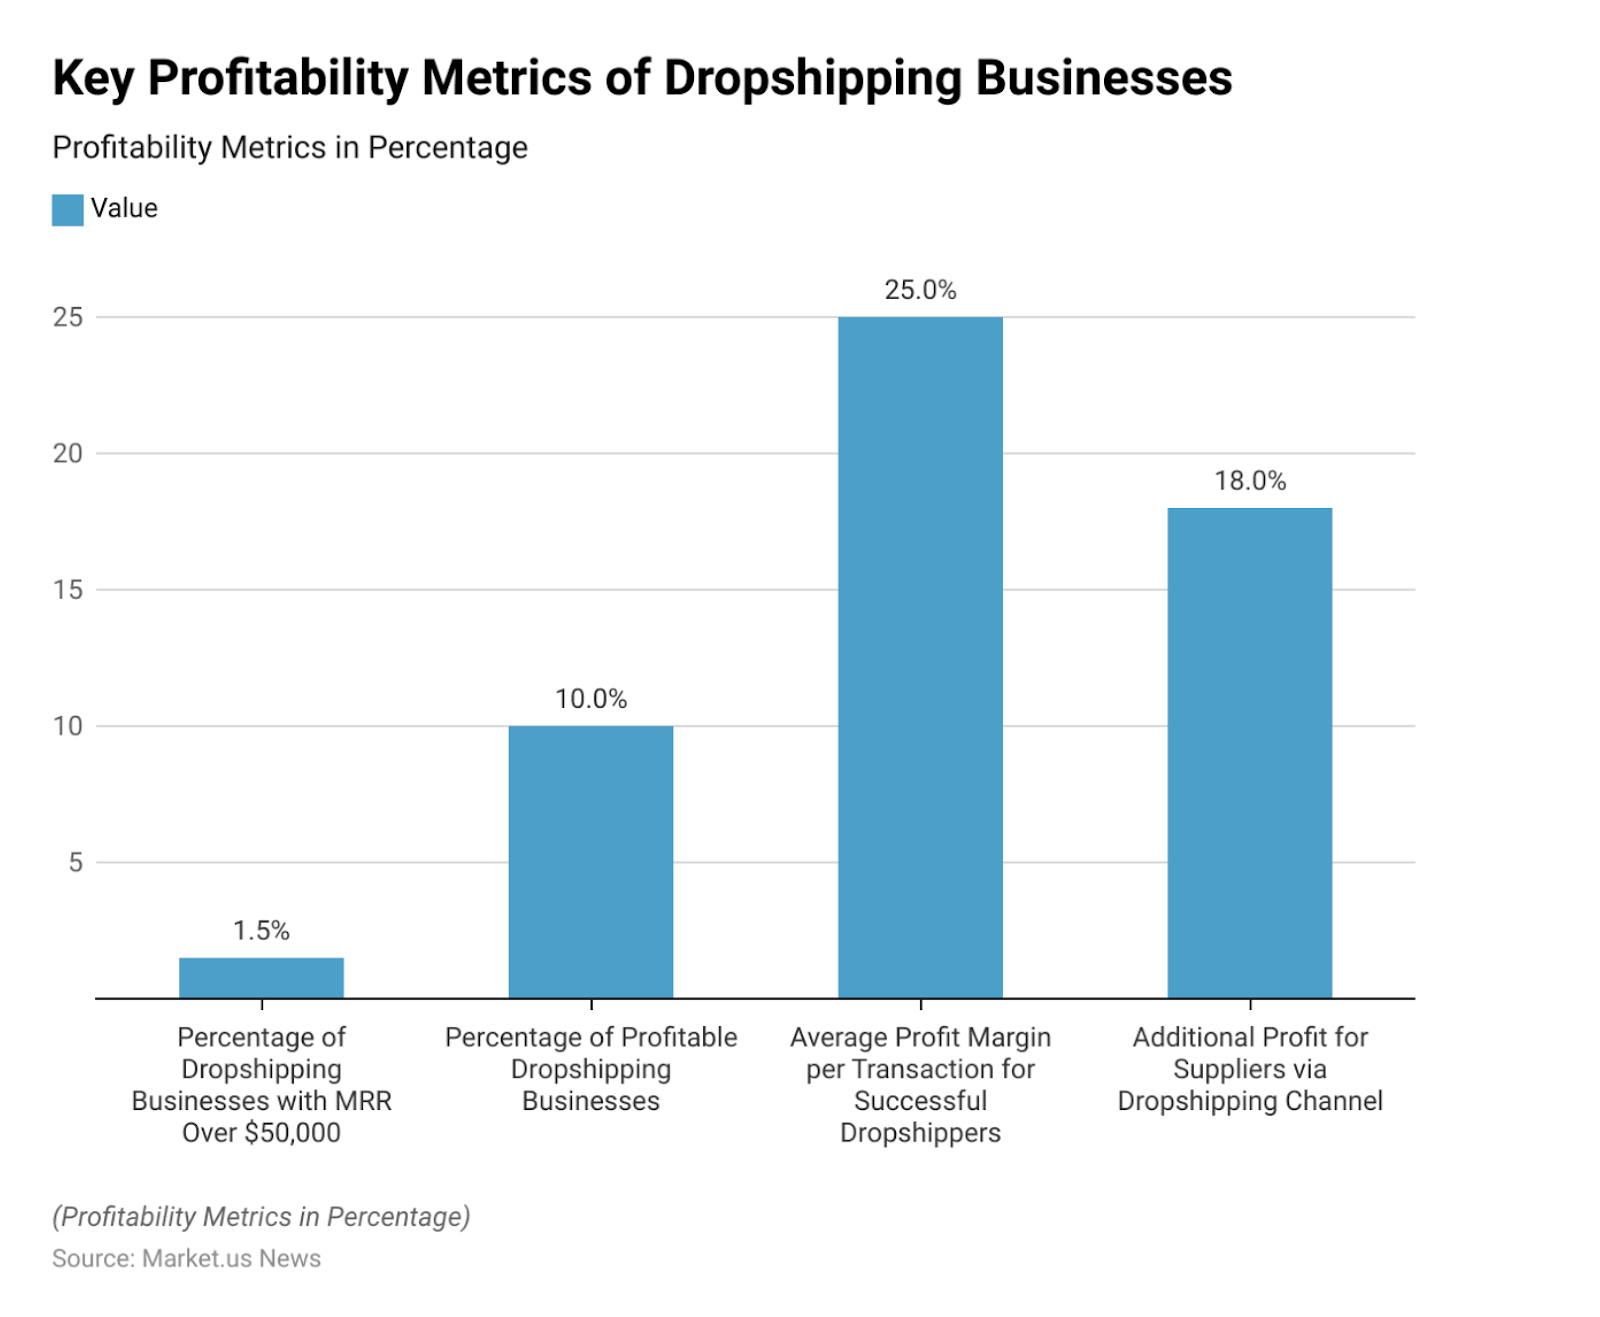
The average profit margin per transaction for successful dropshippers is 25%.
10% of dropshipping businesses are profitable in their first year17.
1.5% of these businesses have a monthly recurring revenue (MRR) of over $50,000.
On Amazon, one of the biggest dropshipping and ecommerce platforms, 94% of dropshippers were profitable in 202418.
48% of dropshippers on Amazon saw profit margins between 11%-25%. Additionally, 39% of dropshippers earned $5,000 or less dropshipping products on Amazon.
Dropshipping cost statistics
In 2024, estimates suggested that the average ecommerce entrepreneur spent around $40,000 in their first year19.
This included product costs of up to 32%, with 21% of businesses stating that other costs such as inventory testing, returns, and storage added up quickly.
Without the typical inventory costs, setting up a dropshipping store cost anywhere between $500 to $2000 per year in 2024.
This was up to 80x cheaper than setting up a traditional ecommerce store.
Typical dropshipping startup costs included:
- Business registration - $50-$500 once-off.
- Branding - $100-$500 once-off.
- Website costs - $5-$25 per year.
- Hosting (Shopify/WooCommerce etc) - $29 per month.
- Payment processing fees (PayPal/Stripe) - 2.9% + $0.30 per transaction.
- Supplier subscription fees - $20 - $100 per month.
- Order fees - $1-$5 per order.
- Competitive/Marketing tools - $10-$200 per month.
Overall, industry estimates placed the initial cost of starting a dropshipping store in 2024 at:
- A minimum of $300-$50020 (minimal costs for each essential component, focusing on budget-friendly options for hosting, ads, and tools).
- A maximum of $800-$2800 (higher-tier website builders, hosting plans, ad spend, and premium dropshipping tools).
50% of dropshippers spent less than $2,500 to start selling on Amazon.
Meanwhile, 17% spent $500 or less.
Dropshipping niche statistics
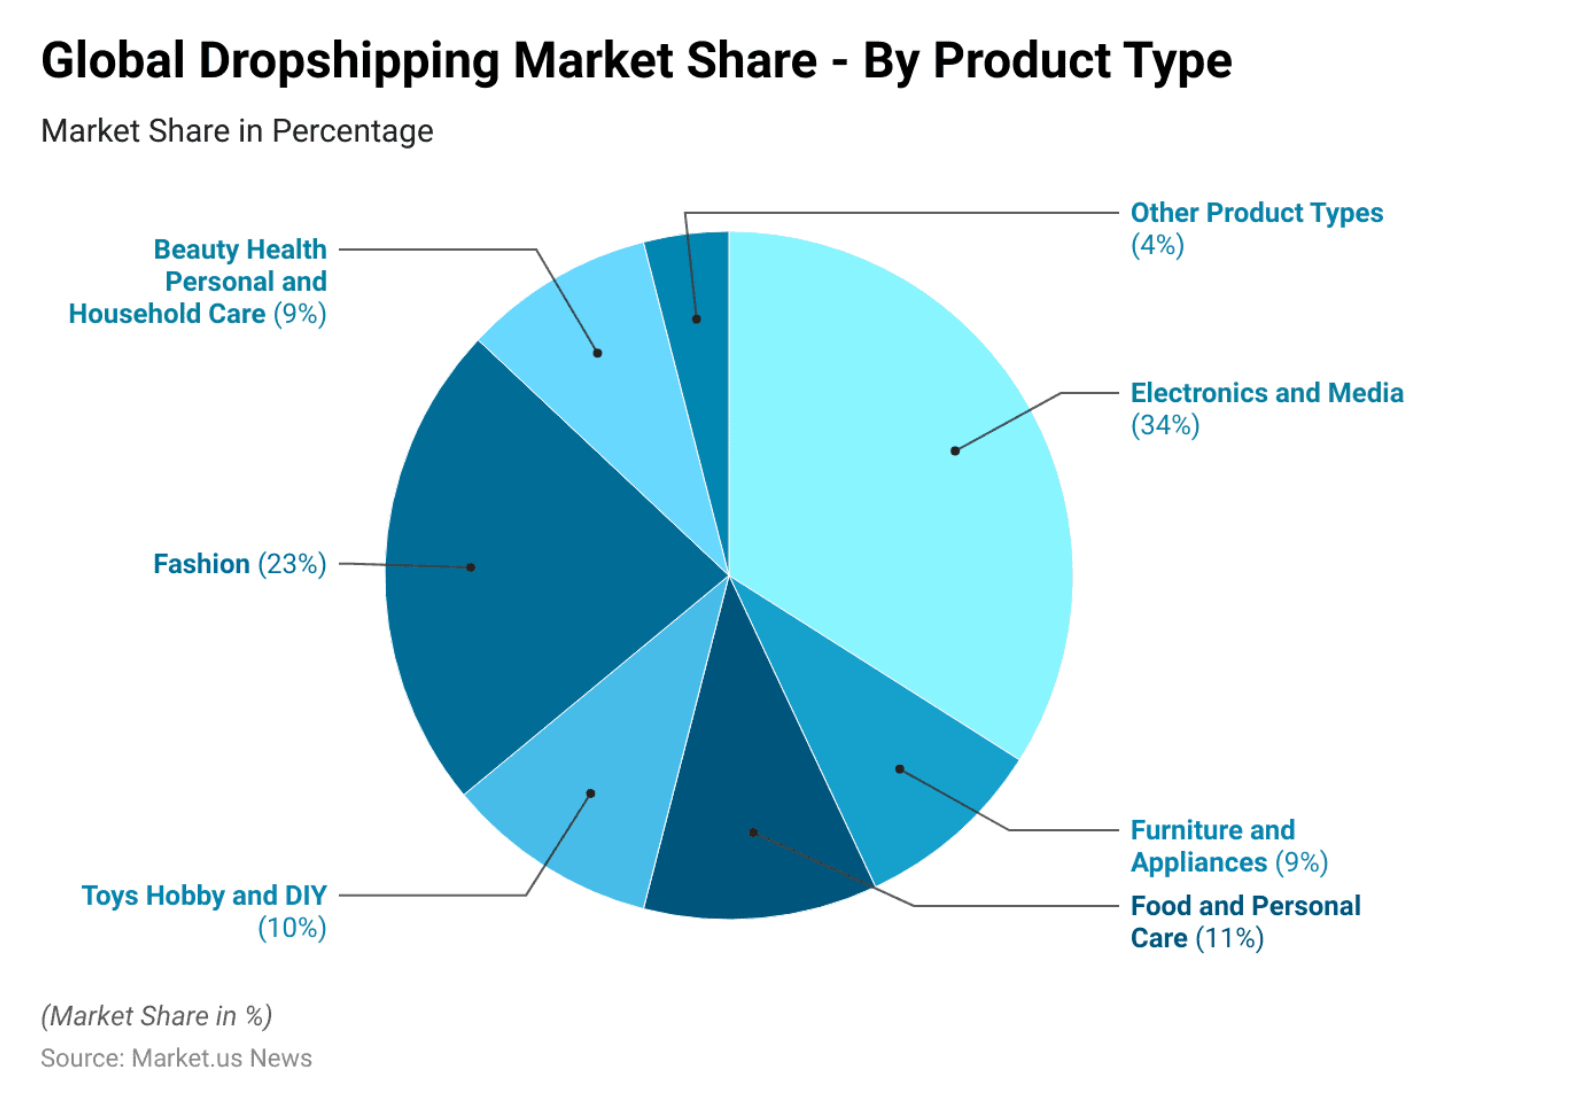
As of 2025, Electronics and Media was the most popular dropshipping product category with a 34% market share.
This was followed by Fashion, which had a 23% share of the market. Other key product categories included:
- Food and Personal care with an 11% share.
- Toys, Hobby, and DIY with a 10% share.
- Furniture and Appliances with a 9% share.
The top Google shopping search between January 2024 and January 2025 was iPhone.
This was followed by:
- Samsung
- Nike
- Amazon
- Adidas
- Apple
- Lego
Overall, the top 20 searches were all in the Tech and Apparel categories.
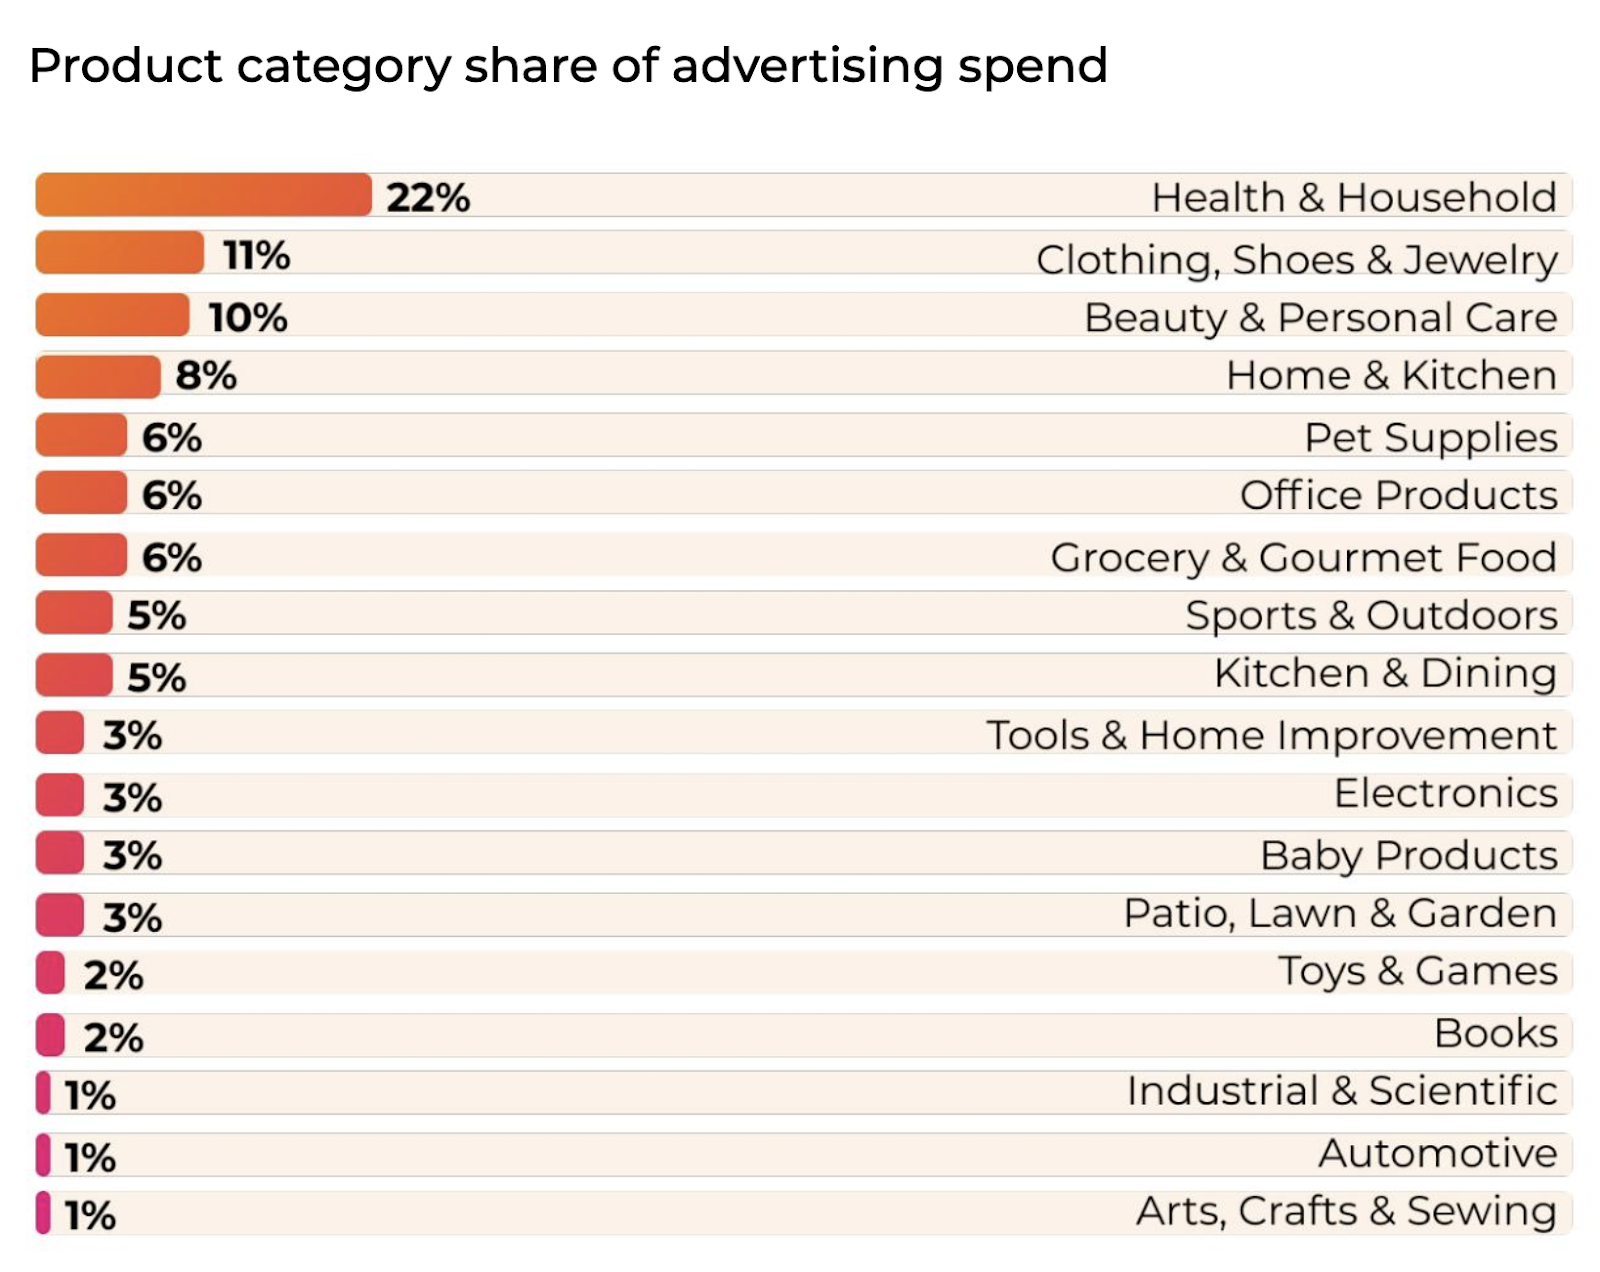
Based on Amazon ad share spend, Health and Household was the most competitive product category in 202421.
This was followed by:
- Office Products
- Beauty and Personal Care
- Grocery and Gourmet
- Kitchen and Dining
- Home and Kitchen
For 2025, over 40% of consumers on Amazon planned to buy more Groceries, making it the most popular category for the year.
This was followed by Apparel at 30%, Cleaning Supplies at over 25%, and Vitamins/Dietary Supplements at just over 20%.
The top niche for high ticket sales was the furniture category, worth over $800 billion in 202522.
This was followed by categories such as:
- Home Decor, worth $202.3 billion in 2025.
- Bathroom, worth $33.9 billion in 2025.
- Lighting, worth $24 billion in 2025.
- Fashion, worth over $880 billion in 202523.
- Home electronics, worth $989 billion by 2027.
On Amazon, the most popular product categories for dropshippers in 2024 were:
- Home and Kitchen - 50%
- Sports and Outdoor - 35%
- Kitchen and Dining - 32%
- Tools and Home Improvement - 32%
- Garden and Outdoor - 31%
Consumers spent an estimated $771 billion on Fashion, making it one of the most lucrative dropshipping categories.
Other key categories included:
- DIY and Hardware at $494 billion.
- Electronics at $465 billion.
- Physical Media at $439 billion.
- Furniture at $283 billion.
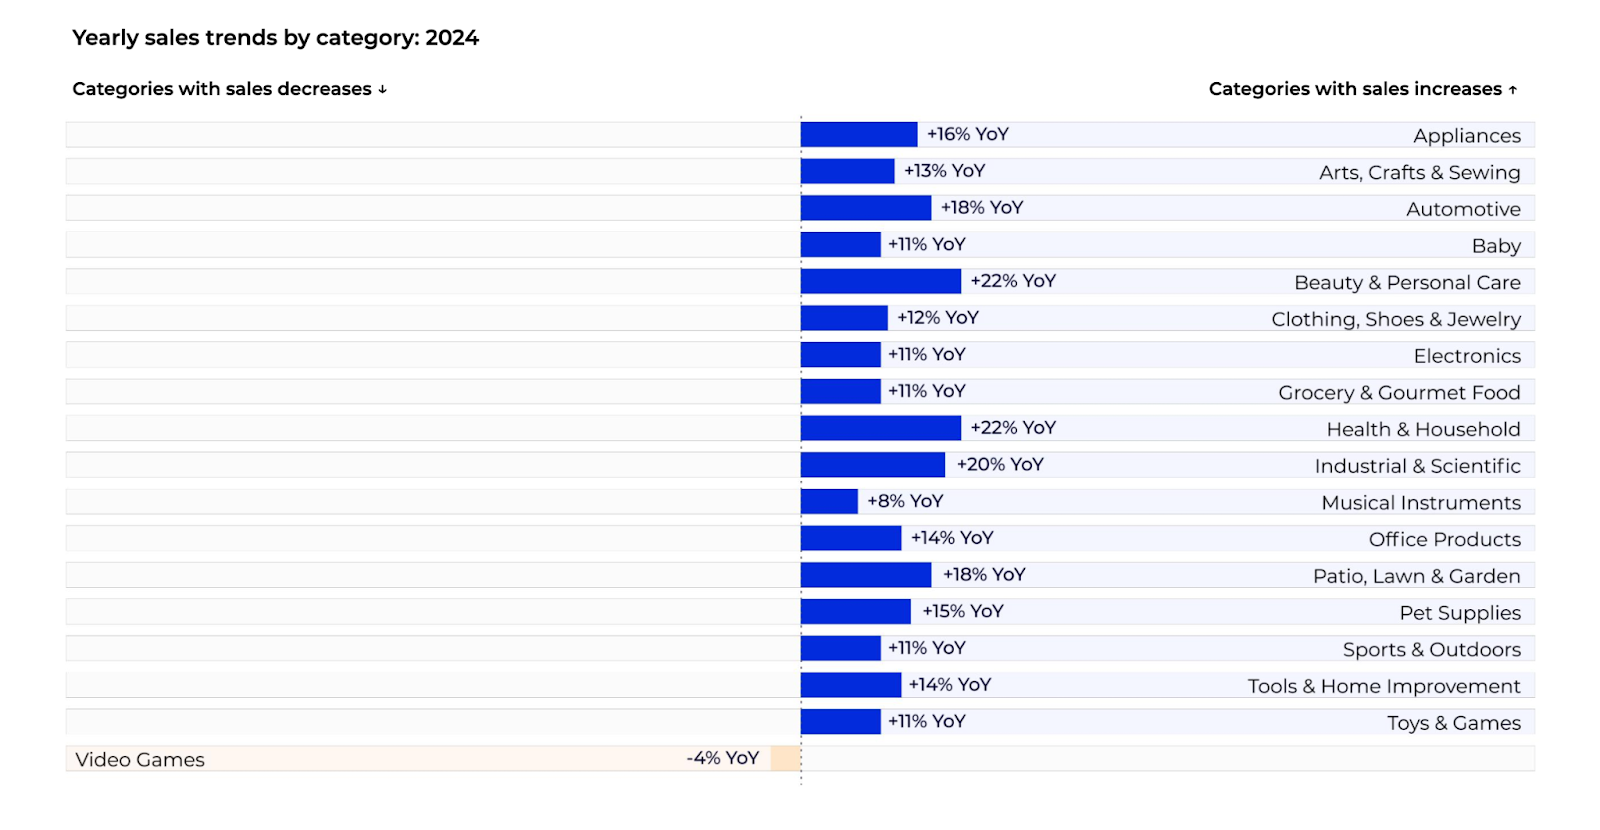
Out of the 18 most common Amazon product categories for dropshippers, 17 or 94% experienced revenue increases in 202424.
The categories that experienced the most growth were Health and Household, as well as Beauty and Personal Care with a 22% growth rate each.
Other popular categories included:
- Industrial and Scientific with a 20% increase.
- Automotive, with an 18% increase.
- Patio, Lawn, and Garden, with an 18% increase.
- Appliances, with a 16% increase.
- Pet Supplies, with a 15% increase.
Globally, Apparel accounted for the most dropshipping sales in 2023.
This was followed by Jewelry, which accounted for over 14% of all dropshipping sales. Home and garden was next, with an 11% share of dropshipping sales.
That year, over 532,000 clothing items were dropshipped on Shopify stores alone, reflecting the popularity of Apparel as a dropshipping product category.
This was followed by:
- Home and Garden - 369,572
- Jewelry and Watches - 282,333
- Health and Beauty - 194,964
- Fashion Accessories - 193,952
Digital dropshipping statistics
Consumers spent over $135 billion on digital products in 2024, making digital dropshipping a lucrative opportunity for online sellers.
Key dropshipping products included:
- Courses
- Ebooks
- Software/ SaaS tools
- Online memberships and communities
In Q3 2024, over 68% of consumers paid for all types of digital content each month, up from 67% in the first quarter.
Within the most popular digital dropshipping categories, 11% of consumers purchased courses while 10% purchased ebooks.
As of 2025, the online learning market was worth over $388 billion25.
Online courses alone were estimated to attract over $850 billion in spending by 2030, with the most profitable niches being:
- B2B
- Entrepreneurship
- Fitness
- Marketing
The ebooks market was worth around $15 billion as of 202526.
The most ebook profitable niches in 2024 included:
- Personal Development and Self-Help
- Relationships
- Health and Wellness
- Business and Entrepreneurship
By 2027, the market is expected to have over 1.1 billion ebook customers.
The global Saas industry, worth around $317 billion in 2024, is projected to exceed $1.2 trillion by 203227.
Some of the most in-demand Saas tools include those that reduce costs, enhance productivity, and improve customer experiences.
Online memberships and communities, which also present opportunities for digital dropshippers, generated $9.81 billion in 202428.
These thriving online revenue models are expected to generate over $43 billion by 2033.
Dropshipping platform statistics
Based on global monthly active users, the most popular mobile shopping app between September and November 2024 was Amazon.
This was followed by Shopee and Flipkart in 2nd and 3rd place, respectively. Occupying positions 4 to 10 were:
- Temu
- Shein
- Meesho
- Aliexpress
- Mercadolibre
- Lazada
- Myntra
In the US, the most popular online store was Amazon, with 73% of consumers making a purchase on the site. This was up 17% from 2023.
Other competitors included:
- Walmart with a 37% market share.
- eBay with a 20% market share.
- Facebook Marketplace with a 17% market share.
- Temu with a 17% market share.
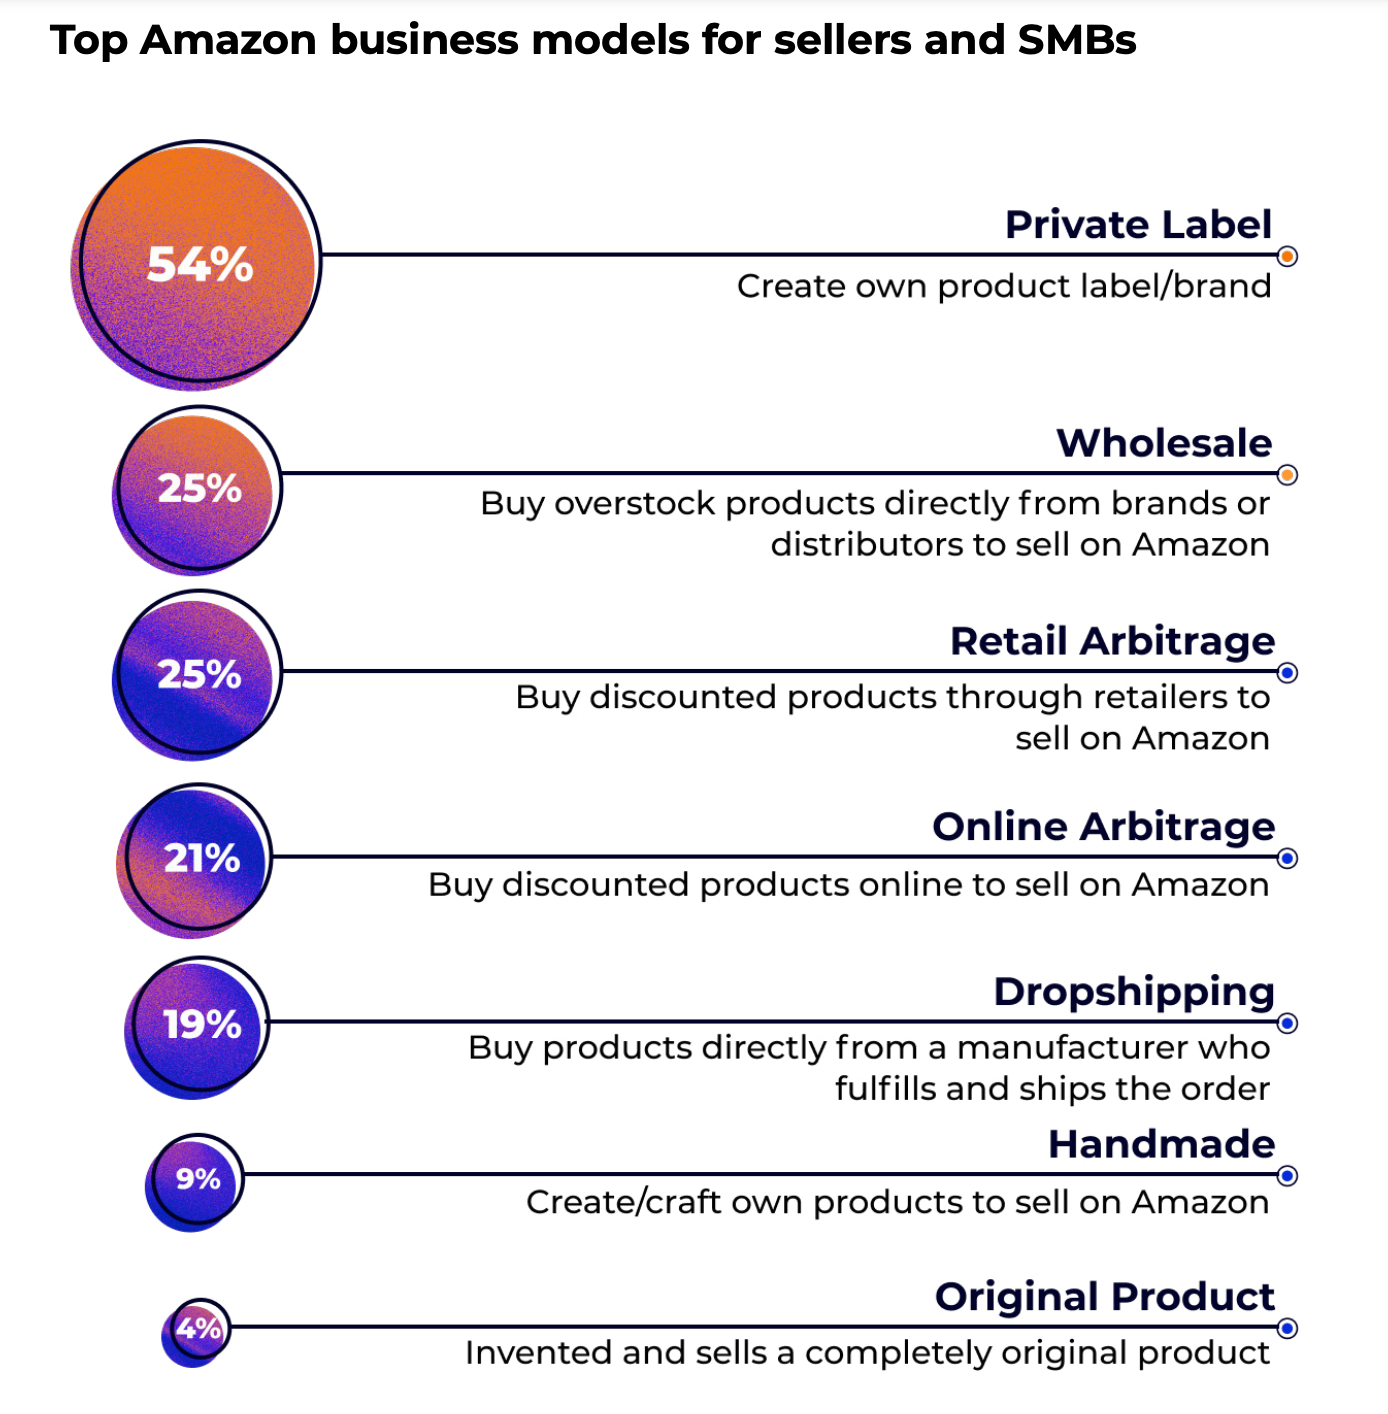
In 2024, 19% of sellers and small-to-medium businesses (SMBs) on Amazon used a dropshipping business model29.
This was behind business models such as:
- Private label - 54%
- Wholesale - 25%
- Retail Arbitrage - 25%
- Online Arbitrage - 21%
As of February 2025, dropshippers on Amazon had built-in access to an audience of over 200 million unique visitors30.
Typical dropshipping costs included:
- $39.99 per month for a professional account.
- Product-dependent shipping costs.
- Amazon referral fees of between 6% to 15%, depending on the product category.
Profit margins for Amazon dropshipping were 20% on average in 2024.
Beginners had a profit margin of 10%, while more experienced sellers had profit margins of around 30%.
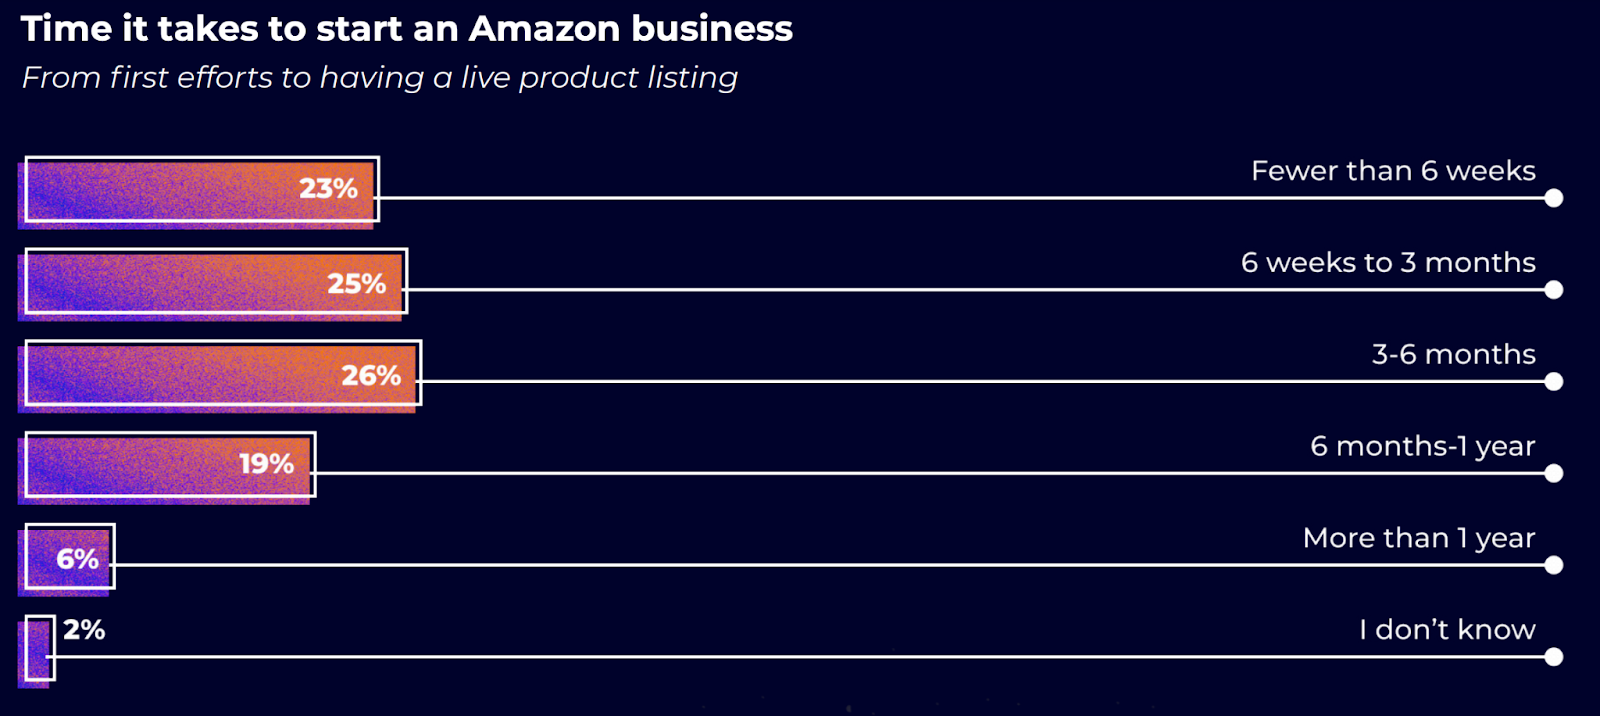
Compared to other Amazon sellers, 56% of dropshippers took longer than 6 weeks to get up and running on Amazon.
10% stated that it took over a year to get started.
Dropshippers also spent more time working on their businesses than other Amazon sellers, with 54% spending over 20 hours per week on their stores.
25% of dropshippers spent over 40 hours a week on their stores.
When shopping on Amazon, 63% of consumers looked for the product with the lowest price.
A further 63% were influenced by products with the best ratings and reviews, while 53% were influenced by ratings and reviews containing photos or videos.
There were approximately 30.7 million ecommerce sites worldwide, an 11% increase from 27 million in 202331.
The top ecommerce platforms based on market share were:
- Shopify at 23%
- WooCommerce at 20%
- Magento at 9%
- BigCommerce at 8%
- Wix eCommerce at 7%
As of February 2025, close to 2,5 million ecommerce stores ran on Shopify’s platform. Notably, dropshipping apps were installed by an estimated 477,849 or 19% of stores32.
Additionally, 14% of the top 100 US Shopify stores used dropshipping apps to streamline their selling33.
With 119,188 or 25% of all installs, DSers-AliExpress Dropshipping was the most popular dropshipping app on Shopify.
This was followed by:
- Printful with 23% or 109,405 installs.
- Printify with 18% or 83,805 installs.
- CJDropshipping with 11% or 54,486 installs.
- Auto DS with 7% or 34,233 installs.
- Gelato with 5% or 24,022 installs.
- Ali Reviews with 5% or 23,686 installs.
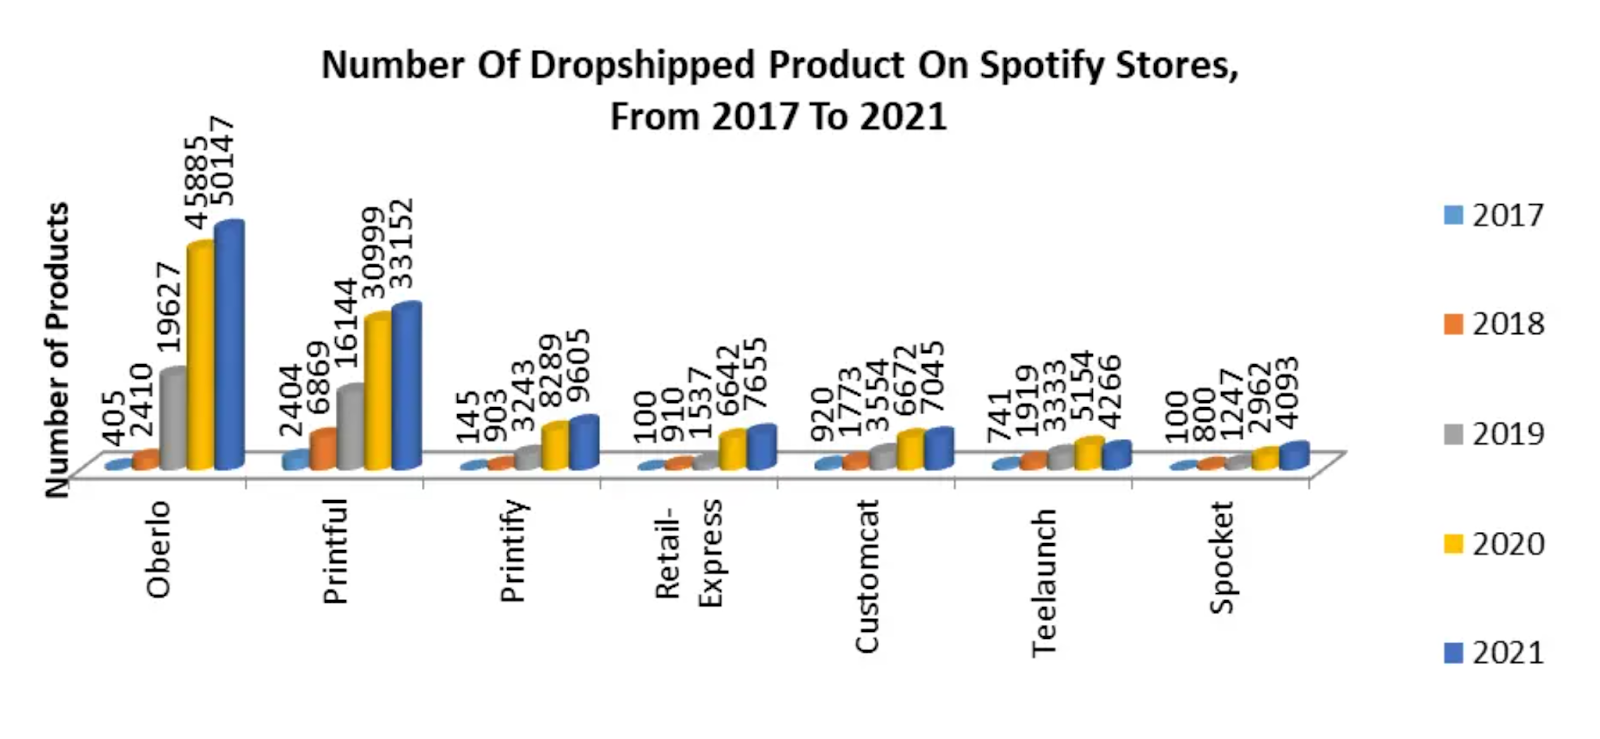
Between 2017 and 2021, dropshipping products on:
- Oberlo increased by over 12,000% from 405 to 50,147.
- Printful increased by 1,280% from 2,404 to 33,152.
- Printify increased by over 6,500% from 145 to 9,605.
- Retail Express increased by over 7,500% from 100 to 7,655.
- Custom Cat increased by over 600% from 920 to 7,045.
- Teelaunch increased by over 400% from 741 to 4,266.
- Spocket increased by close to 4000% from 100 to 4,093.
At 79%, email marketing and advertising apps were the most popular apps installed by the top Shopify stores in the US.
Klaviyo was the top email and marketing app, used by 61% of stores. This was followed by Bing Shopping at 57%.
76% of Shopify stores also used product review stores to take advantage of the power of social proof.
38% also used rewards and referral apps, while 24% used personalization for a better customer experience.
As of 2025, Dsers, the official AliExpress ecommerce solution, helped over 4.5 million dropshippers start and scale their own stores34.
The dropshipping tool also managed over 220 million orders, saving dropshippers 97% ordering time.
Printful, a print-on-demand (POD) partner and the second most popular dropshipping supplier on Shopify, shipped over 99 million items between 2013 and 2025.
99% of all orders met customer standards and 90% were delivered within 1-3 business days.
Other notable POD competitors included:
- Gelato, with 140+ print partners, 100% free editing tools, and 50% lower prices in select markets36.
- Printify, with 900+ products, 100 printing locations, and 90% of products shipped in two business days37.
CJDropshipping, the third most popular dropshipping vendor on Shopify, had close to 1.7 million products and a 99.9% customer satisfaction rate as of 202538.
The dropshipping provider also offered integrations across other platforms such as TikTok, eBay, Shopee, and more, with an increased efficiency rate of 70%.
As of 2025, Spocket, an automated dropshipping software designed to surface trending products from thousands of dropshipping suppliers worldwide, was used by over 500,000 dropshippers39.
The platform also gave dropshippers access to suppliers in the US and Europe and a product catalog of over 100 million.
Other top dropshipping platforms as of 2025 included:
- Doba, used by over 890,000 dropshippers, offered access to 90% of products stocked locally in the US and partnerships with over 500 top US brands40.
- Zendrop, used by over 3 million dropshippers, fulfilled over $100 million in orders and sourced over 1 million products41.
- SaleHoo, used by over 137,000 dropshippers, offered access to over 8,000 vetted suppliers and 1.6 million branded products42.
- Modalyst, used by over 600,000 dropshippers, offered access to millions of premium dropshipping products from thousands of suppliers in the US, Europe, Canada, and Australia43.
Dropshipping consumer statistics
As of February 2025, 75% of internet users over the age of 16 visited online shopping websites.
This was highest for consumers aged 35-44 (77%), followed by those aged:
- 25-24 at 76%
- Over 65 at 77%
- 55-64 at 72%
- 16-24 at 73%
- 45-54 at 75%
Consumers spent 1.5% of their time shopping on mobile phones.
In Q3 2024, 56% of consumers purchased a new product online. This is up from 55% in Q2 and 54.5% in Q1.
In 2024, consumers spent 4x more online than they did in stores44.
This was despite projections of lower customer spending in 2023.
Globally, mobile emerged as the top ecommerce channel, with 58% of consumers across generations turning to their devices for online shopping.
53% of consumers shopped online via laptop/PC, while a minority turned to their tablets at 14%.
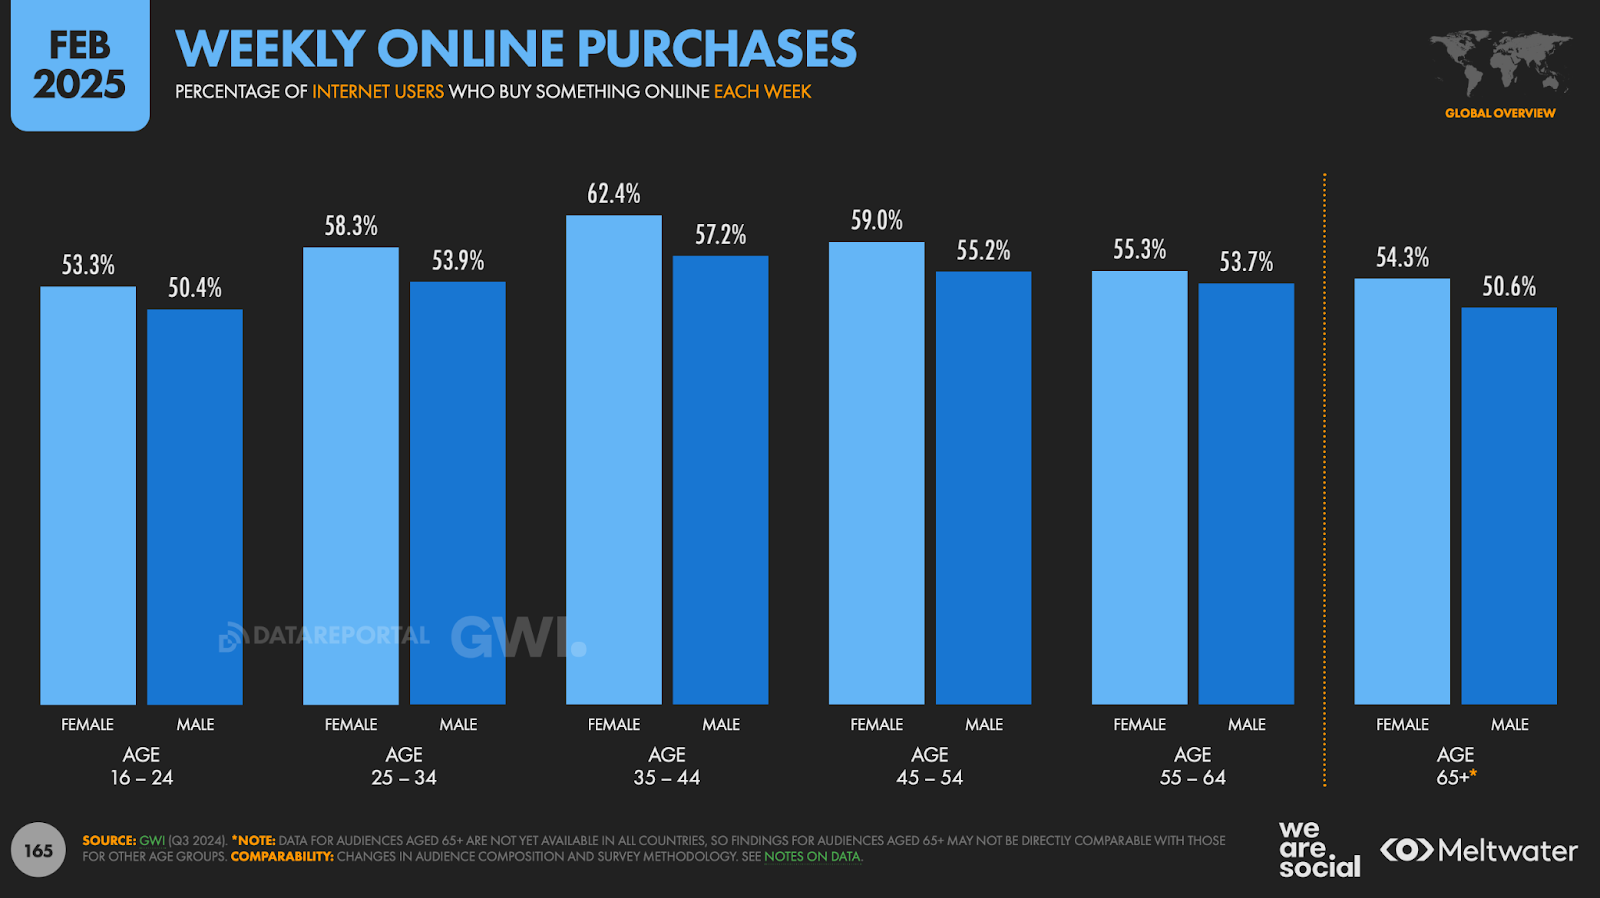
Across all age groups, women engaged in more online shopping weekly than men. Notably, over 62% of women aged 35-44 bought something online each week.
Men in this age group also made the most weekly online purchases.
Millennials emerged as the heaviest mobile users, with 74% using their smartphones for online shopping at least 50% of the time.
58% said they used their smartphones to make purchases most of the time.
Gen Z consumers were next, with 68% using their smartphones for online shopping at least 50% of the time.
A further 54% said they used their smartphones to make purchases most of the time.
Gen X consumers made use of both mobile and desktop channels for online shopping.
Notably, 60% used smartphones for online shopping at least 50% of the time, while 47% used them most of the time. On the other hand, 52% used a laptop/PC over 50% of the time, while 36% did so most of the time.
Boomers were the least interested in mobile online shopping, with 55% using a laptop or PC for online purchases 50% or more of the time.
Meanwhile, 46% used a laptop or PC for online shopping most of the time.
97% of consumers backed out of buying an item online due to inconvenience and poor customer support in 202445.
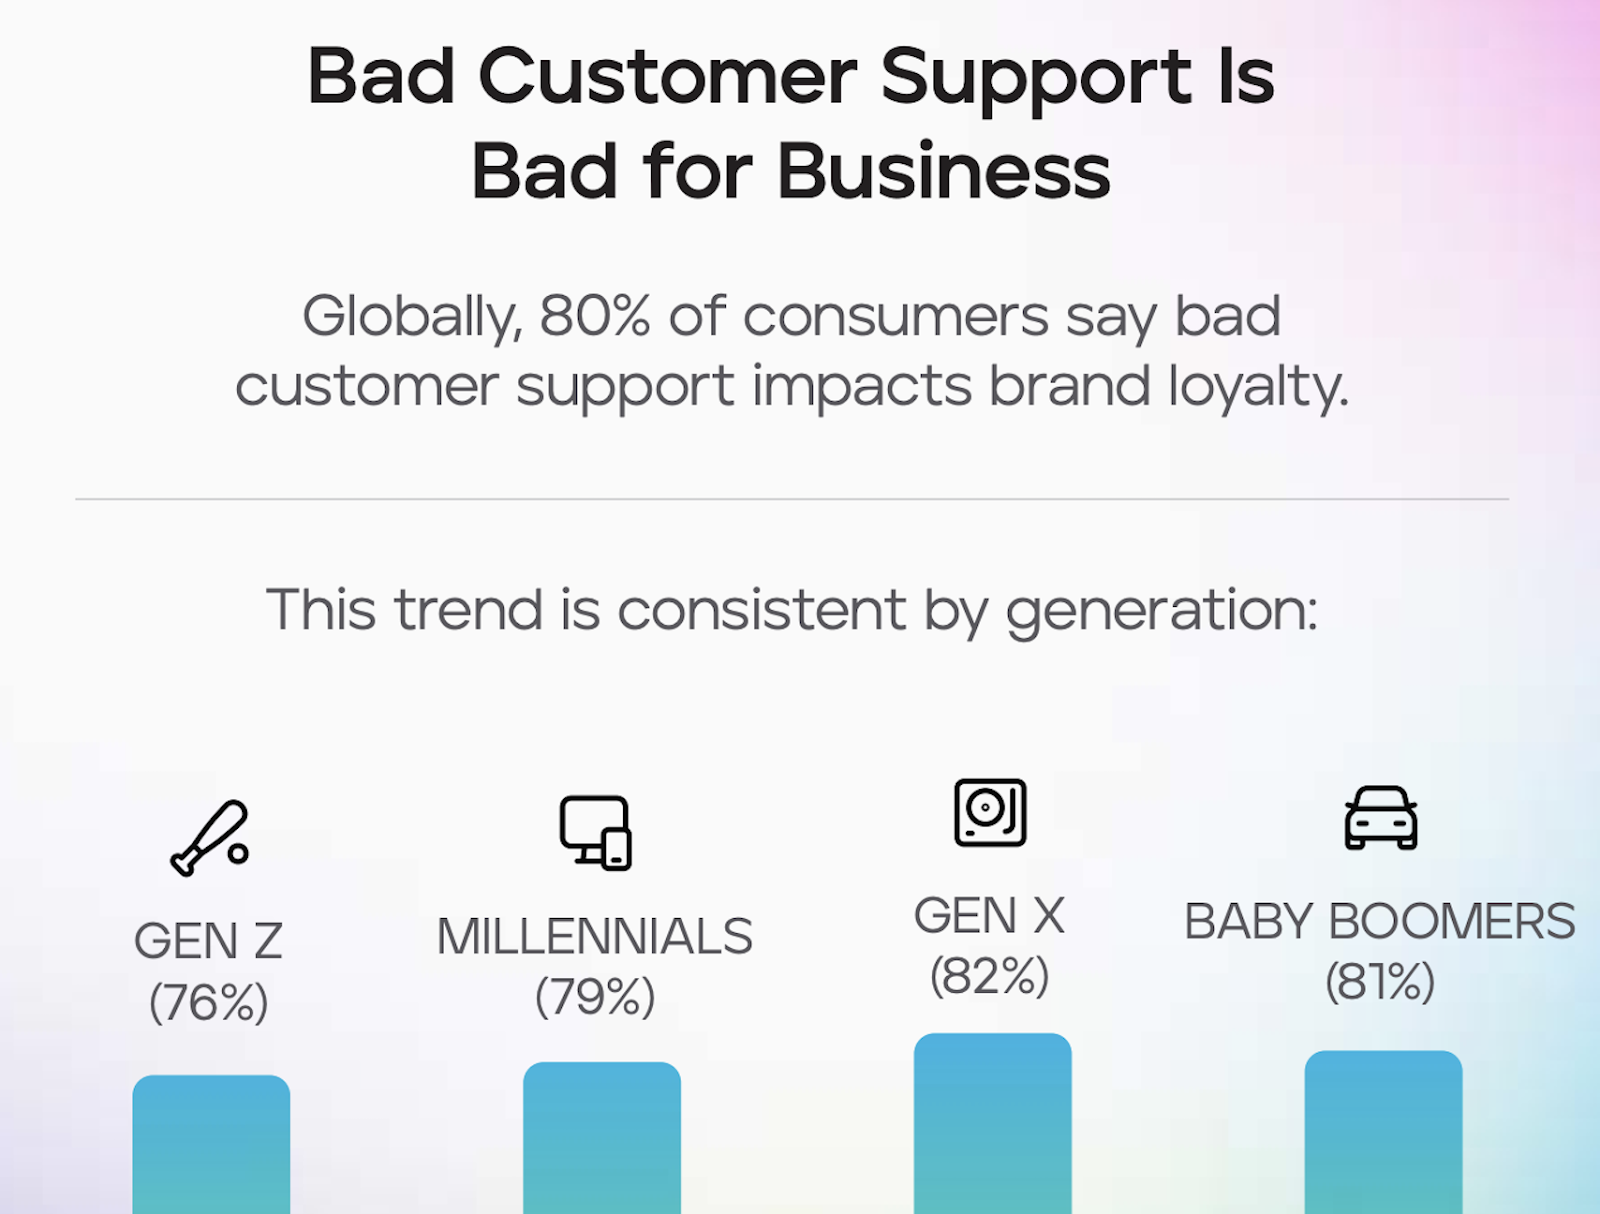
Emphasizing the importance of good customer support for dropshipping businesses, 80% of consumers stated that bad customer support impacted their buying decisions.
This was consistent across generations:
- Gen X - 82%
- Baby Boomers - 81%
- Millennials - 79%
- Gen Z - 76%
In terms of customer support channels, 68% of consumers preferred live chat over support calls.
Across generations, this was the case for:
- 74% of Millennials
- 72% of Gen X
- 70% of Gen Z
Another key focus area for dropshippers was protecting customers against fraud. This came as 90% of consumers valued fraud protection in 2024.
84% stated they wouldn’t buy from online stores that didn't protect them from fraud. A further 33% said they would pick a safe online shopping experience over lower prices.
The most common payment methods used by online shoppers in 2024 included digital wallets (50%) and debit or credit cards (34%).
Other payment methods included account-to-account transfers at 7% and BNPL at 5%.
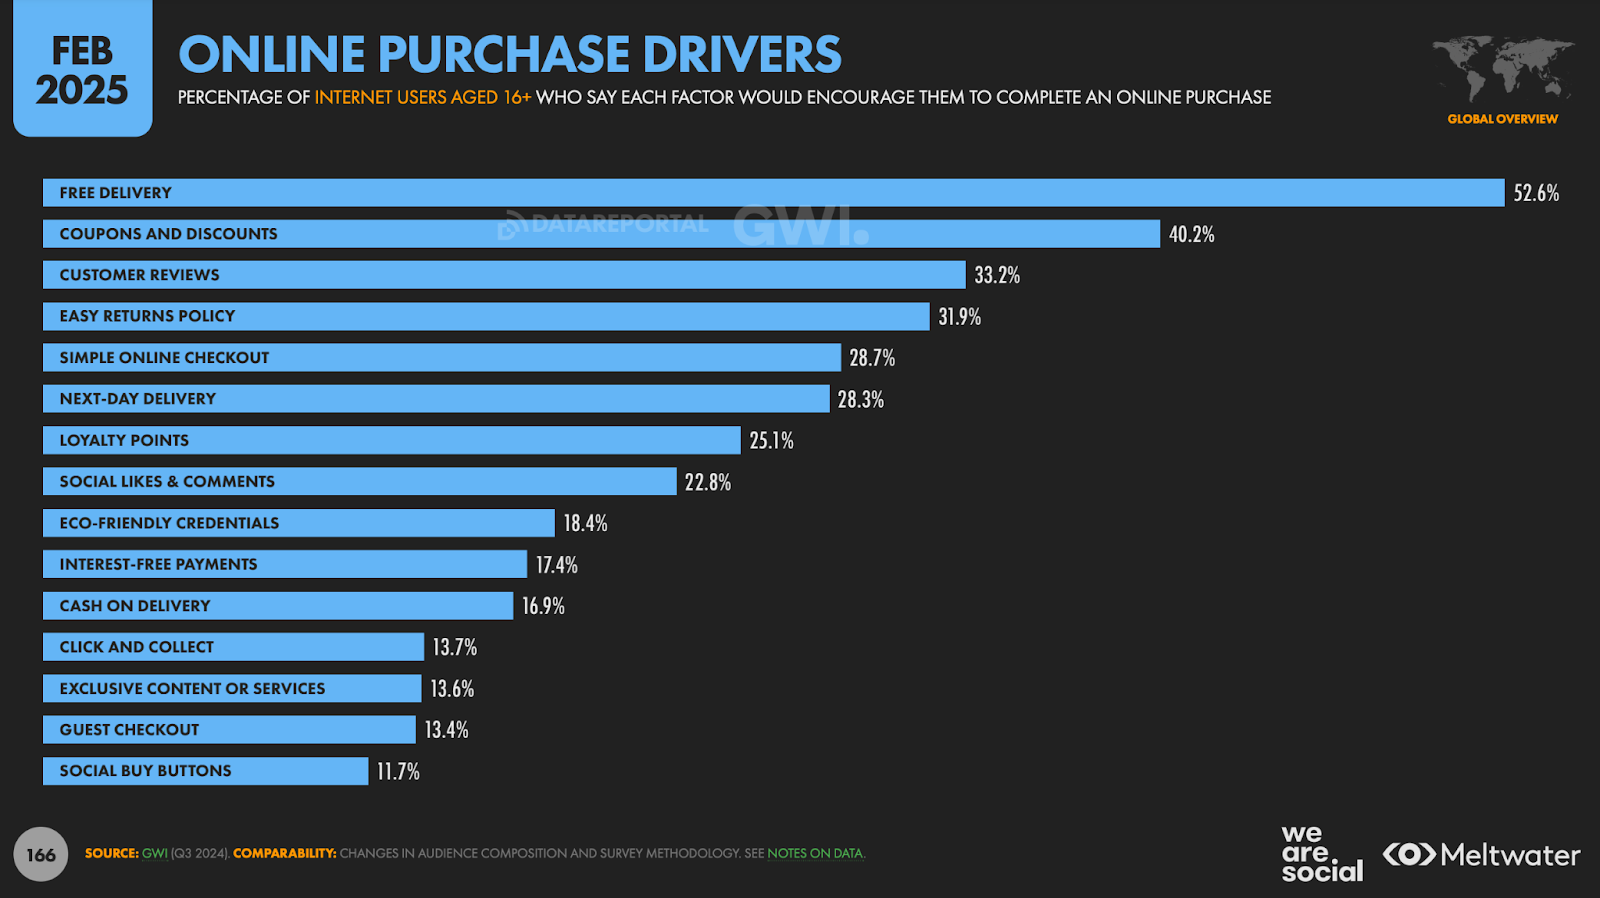
As of February 2025, key online purchase drivers included:
- Free delivery - 53%
- Coupons and discounts - 40%
- Customer reviews - 33%
- Easy returns policy - 32%
Baby boomers were the most price-conscious consumers, with 80% considering pricing before making an online purchase.
Gen X came in second at 77%.
Boomers were also the most likely to be influenced by free shipping at 79%.
This was followed by Gen X consumers at 77%.
73% of Gen Z and 71% of millennial consumers ranked price as the most important online shopping driver.
71% of millennials and 69% of Gen Z consumers considered free shipping the second most important driver.
Of all consumer generations, product selection mattered least to Millennials (49%) and Gen Z shoppers (51%).
On the other hand, it mattered most to Boomers (56%) and Gen X shoppers (54%).
In 2024, more than 80% of consumers were willing to pay more for sustainable products46.
Some consumers were willing to pay up to a 10% premium for locally sourced products or those made from recycled or eco-friendly materials.
At 76%, price was still the key factor that impacted consumers' online shopping frequency and cart abandonment.
Free shipping (75%) and product selection (53%) were other key factors impacting online shopping frequency.
Over 30% of consumers ranked product reviews and ratings as important.
Free shipping options and brand reputation were next in line.
80% of ecommerce leaders stated that consumer shopping decisions were highly influenced by delivery speed and costs, as well as how these were communicated47.
82% also stated that offering faster delivery speeds had increased conversions.
85% of ecommerce leaders believed consumers had become more demanding in their delivery speed expectations.
A further 80% predicted this trend would continue over the next 5 years.
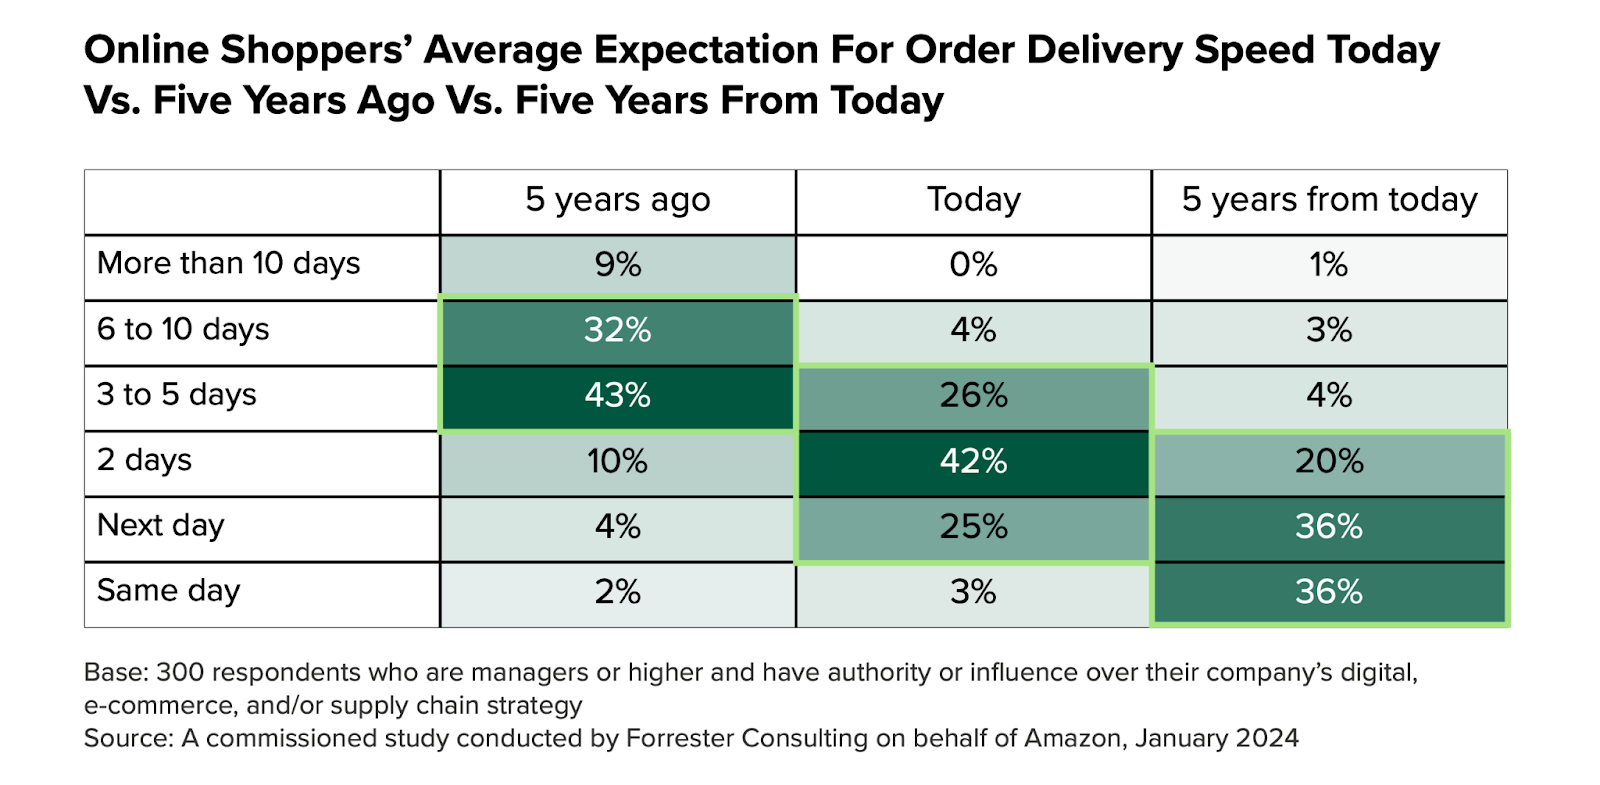
Notably, consumers expected a click-to-delivery speed of 2.5 days on average.
In 2019, they expected an average click-to-delivery speed of 5.7 days. By 2029, consumers will expect an average click-to-delivery speed of 1.5 days.
76% of consumers considered free returns important when shopping online in 202448.
In fact, 46% of consumers abandoned a purchase if a seller didn't offer convenient returns.
92% of consumers were more likely to make a repeat purchase if the return process was easy.
Meanwhile, 67% were less likely to make a repeat purchase if they had a poor returns experience.
Dropshipping marketing statistics
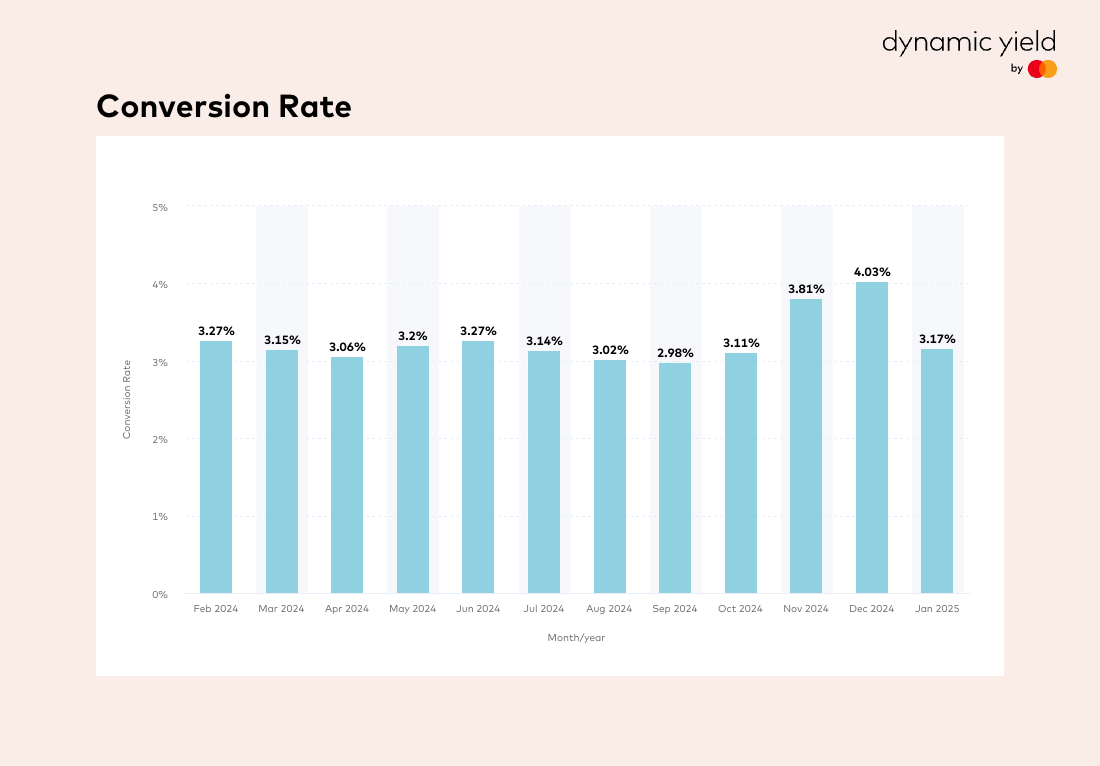
Dropshippers had an average conversion rate of between 2% and 3%, as of 202549.
This was on par with the global ecommerce conversion rate of around 3.29%. By region, the Americas had the highest conversion rate at 3.55%, followed by EMEA (3.16%) and then APAC(2.49%).
Online shoppers were nearly 3x more engaged on mobile than on desktop in 202450.
Mobile engagement was 73% versus 25% for desktop. However, in terms of conversion rates, online shoppers were more likely to buy on desktop. The desktop conversion rate was 4.8%, while the mobile conversion rate was 2.9%.
For 2024, the Food and Beverage category saw the highest conversion rates at 6.04%, while Home and Furniture saw the lowest at 1.2%.
The average conversion rate across other popular dropshipping industries was:
- Pet - 3.04%
- Consumer Goods - 3.69%
- Beauty and Personal Care - 4.73%
- Multi-Brand Retail - 4.67%
- Luxury and Jewelry - 1.2%
- Fashion, Accessories and Apparel - 3.25%
In 2024, ads for products in the Appliances category resulted in the highest average return on ad spend at $7.47.
Return on ad spend was also high for categories such as Office products ($7.42) and Musical Instruments ($7.19). It was lowest for Pet supplies ($2.23) and Health & Household ($2.27) and Apparel ($2.27).
87% of online shoppers found enhanced content such as comparison charts, extensive image galleries, feature tours, and videos helpful51.
This was particularly the case for Millennials (93%) and Gen Zers (92%). And slightly lower for Gen Xers (87%) and Baby Boomers (74%).
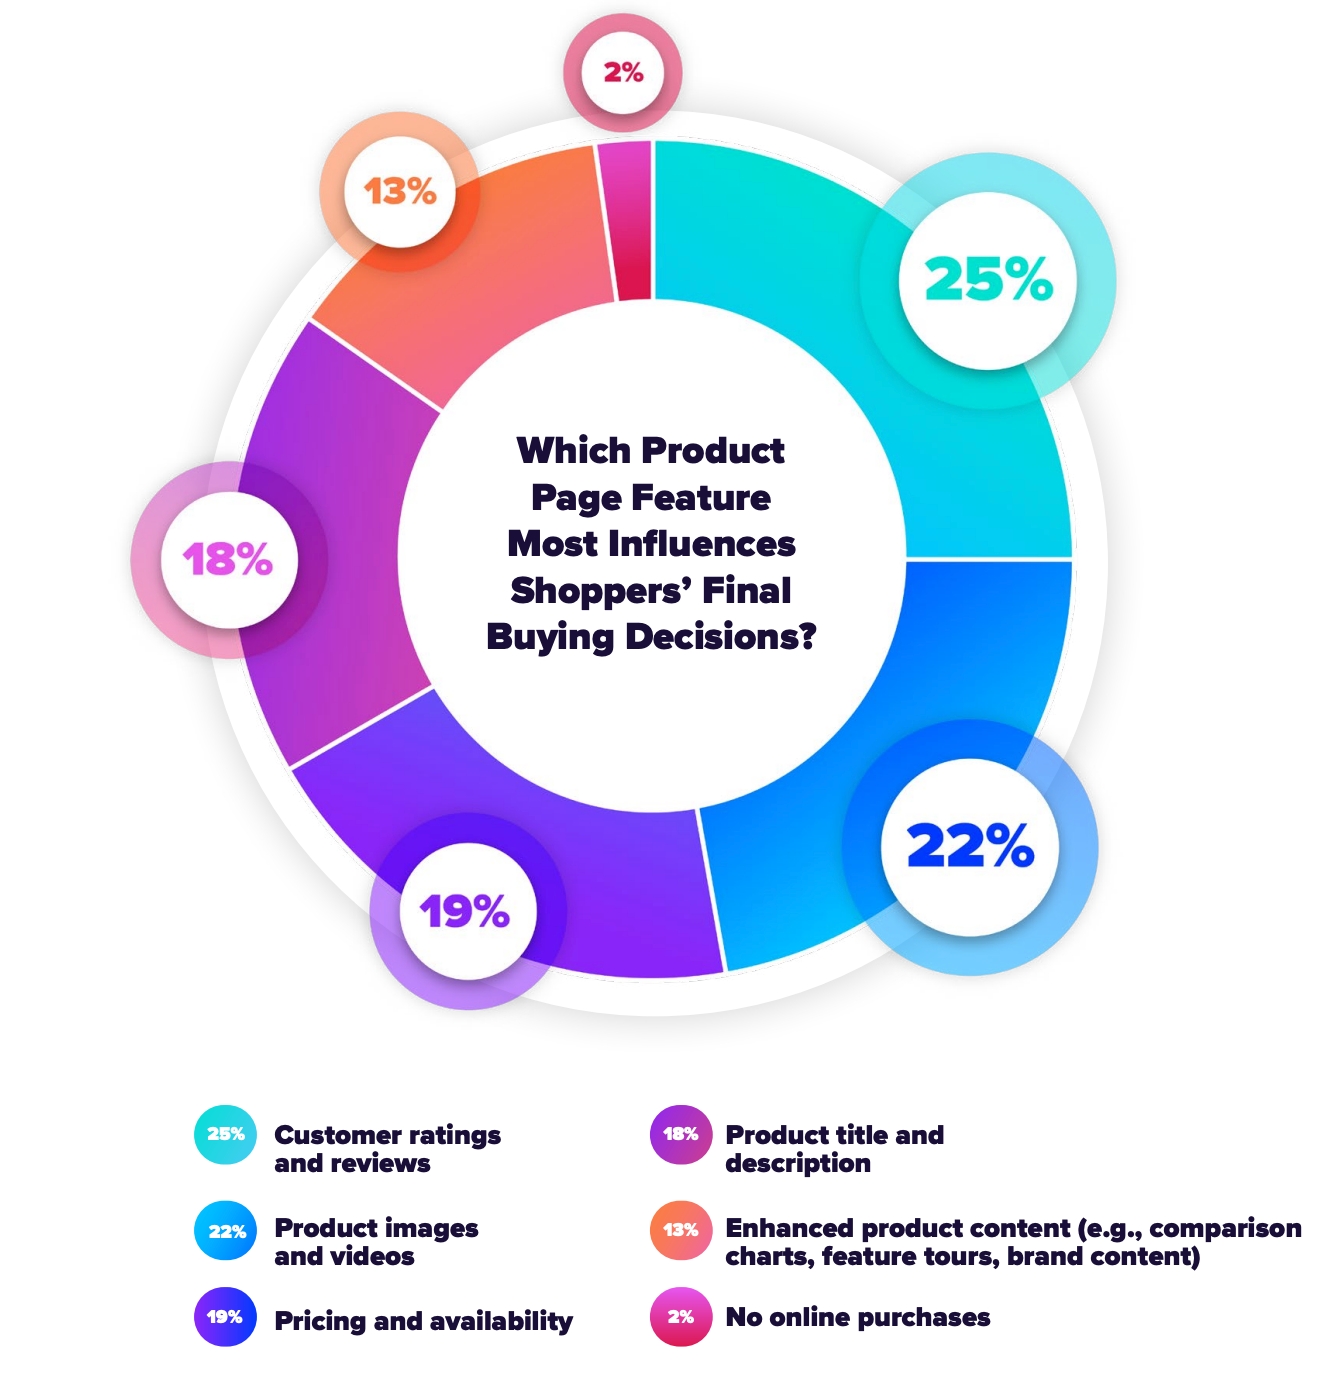
At 25%, customer ratings and reviews were the product page features that influenced online shoppers’ final buying decisions most.
This was followed by:
- Product images and videos - 22%
- Pricing and availability - 19%
- Product title and description - 18%
The most influential online advertising types of 2024 as ranked by consumers were:
- Search engine ads (Google ads, Bing ads)
- Sponsored product listings (Amazon and other ecommerce sites)
- Email marketing (Promos, newsletters)
- Video ads (YouTube ads, social media videos)
- Social media ads (Ads on Instagram, Facebook and TikTok)
- Influencer or celebrity promotions/recommendations
By generation:
- Gen Z consumers were influenced most by video ads and least by email marketing.
- Millennials were influenced most by search engine ads and least by influencers.
- Gen X consumers were influenced most by search engine ads and least by influencers.
- Boomers were influenced most by search engine ads and least by influencers.
Email marketing had the most impact on older generations and the least impact on Gen Z. The latter was more likely to be swayed by video and influencer marketing—a notable difference from all other generations.
- Older generations were less likely to respond to newer advertising tactics such as video ads and influencers.
- Social media ads were more likely to influence Millennials and Gen Z more than any other generation.
With an estimated return on investment of up to $45 for every dollar spent, email marketing was rated one of the most effective marketing channels for growing a dropshipping business52.
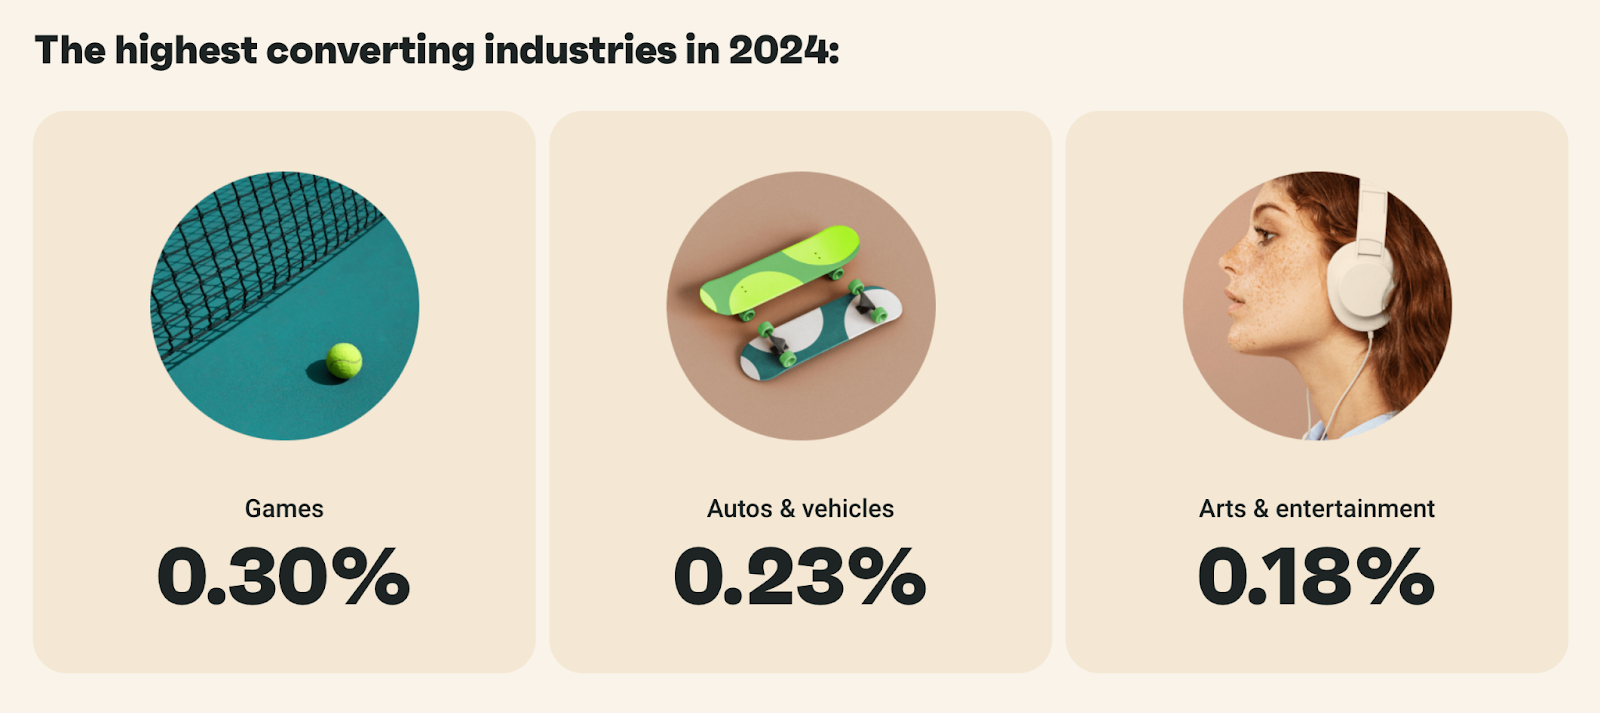
In 2024:
- Email click-to-conversion rates increased by 27.6%53.
- Open rates increased by 6% year over year.
- The highest converting industries included games (0.30%), Auto ( 0.23%), and Arts & Entertainment (0.18%).
Automated emails (abandoned carts, welcome messages, browse abandonment, and back-in-stock) outperformed manual campaigns with:
- 52% higher open rates.
- 332% higher click rates.
- 2361% higher conversion rates.
Additionally, 50% of consumers who clicked on an automated welcome or abandoned cart email made a purchase.
Unlike crowded ad spaces, SMS marketing gave dropshippers an affordable, direct line to customers. 31% more messages were sent in 2024. And in the US, brands generated over $25 million in SMS sales.
In the ecommerce space, SMS campaign volume grew 55% from 2023. Additionally. In 2024, SMS marketing saw:
- 37% higher click rates.
- 28% more orders.
As with email automation, automated push notifications stood out with higher engagement metrics across the board. Generally, conversion rates for automated SMS were 500% higher while view and click rates increased by 28% and 65%, respectively.
The average click-to-conversion rate was 13.94% and notably higher in Australia (51%) and Canada (25%).
44% of small Amazon sellers, including dropshippers invested in social media ads.
Additionally, 38% invested in paid search advertising, and of these sellers, 95% used Google ads.
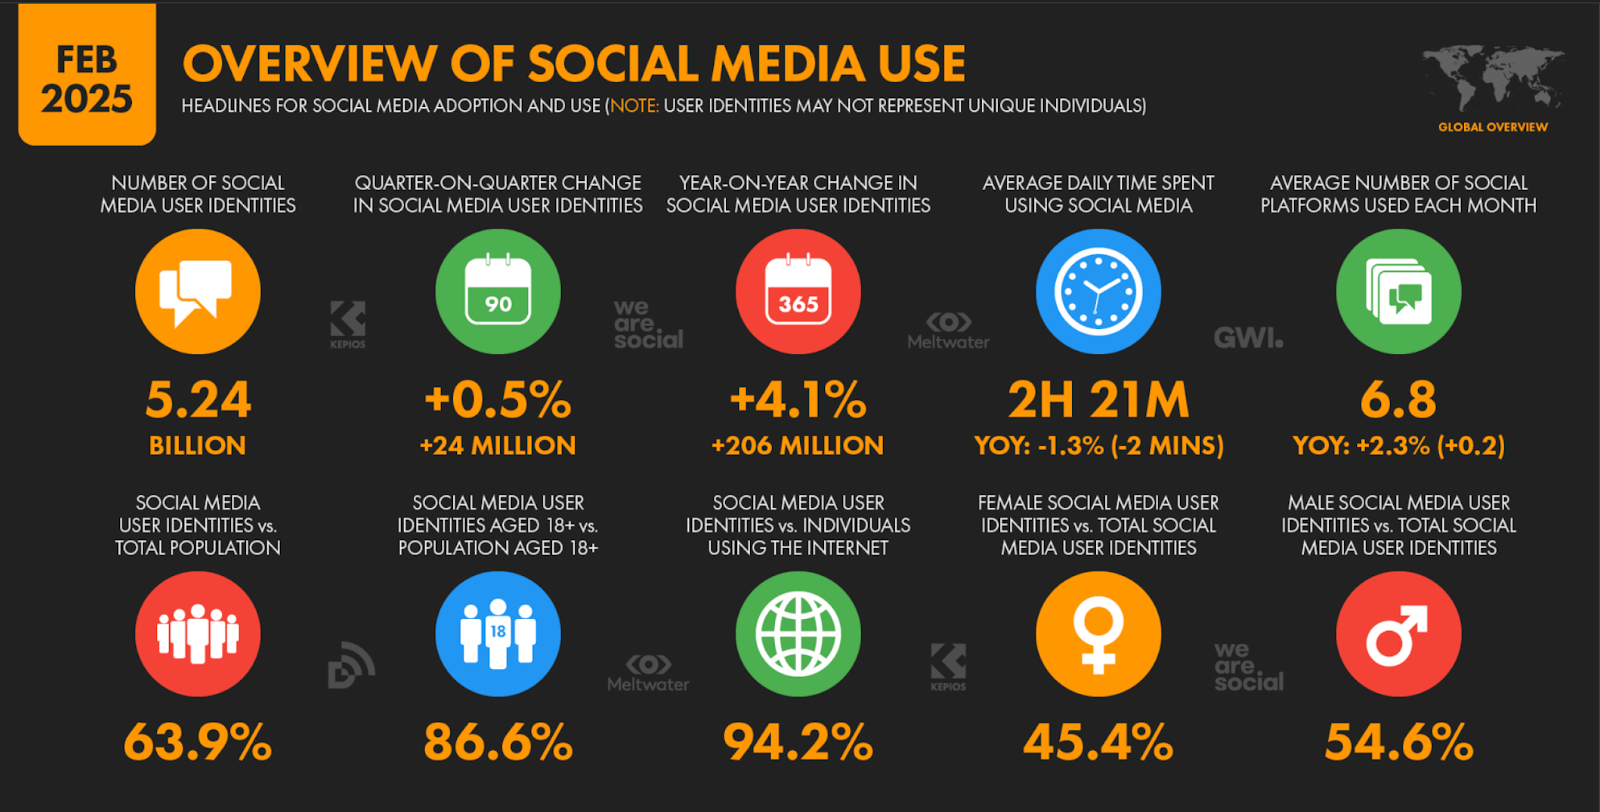
As of February 2025, social media platforms offered access to over 5.24 billion consumers along with various paid and organic strategies to scale a dropshipping business54.
That’s why over 93% of dropshippers used Facebook advertising in 202455. As of December 2024, key metrics for Facebook ad campaigns were as follows:
- The median cost per click (CPC) was $0.4956.
- The average campaign reached 33,000 users each month.
- The median monthly spend was $784.33.
- The median click-through rate (CTR) was 1.77%.
- The median cost per lead was $41.26.
70% of small businesses including dropshippers tapped into the big 3 (TikTok, Instagram reels, and YouTube shorts) to leverage the effectiveness of short-form video57.
In 2024 alone, there was 4x growth in ecommerce brands using short-form video. Short-form videos resulted in 2.5x more engagement than long-form videos. Meanwhile, beyond 2025, short-form video ad revenue is expected to exceed $10 billion.
Across major social media platforms, user-generated content (UGC) saw a 29% boost in conversions.
Plus, 92% of consumers preferred the authenticity of this type of content over other ad types.
Dropshipping challenges statistics
At 64%, optimizing product listings was the key challenge faced by dropshippers on Amazon in 2024.
This was followed by:
- Monitoring and managing expenses, revenue, and other financial metrics at 54%.
- Getting customer reviews at 50%.
87% of dropshippers admitted that finding a good supplier was challenging58.
84% also stated that supplier relationships were the most challenging part of starting a dropshipping business59.
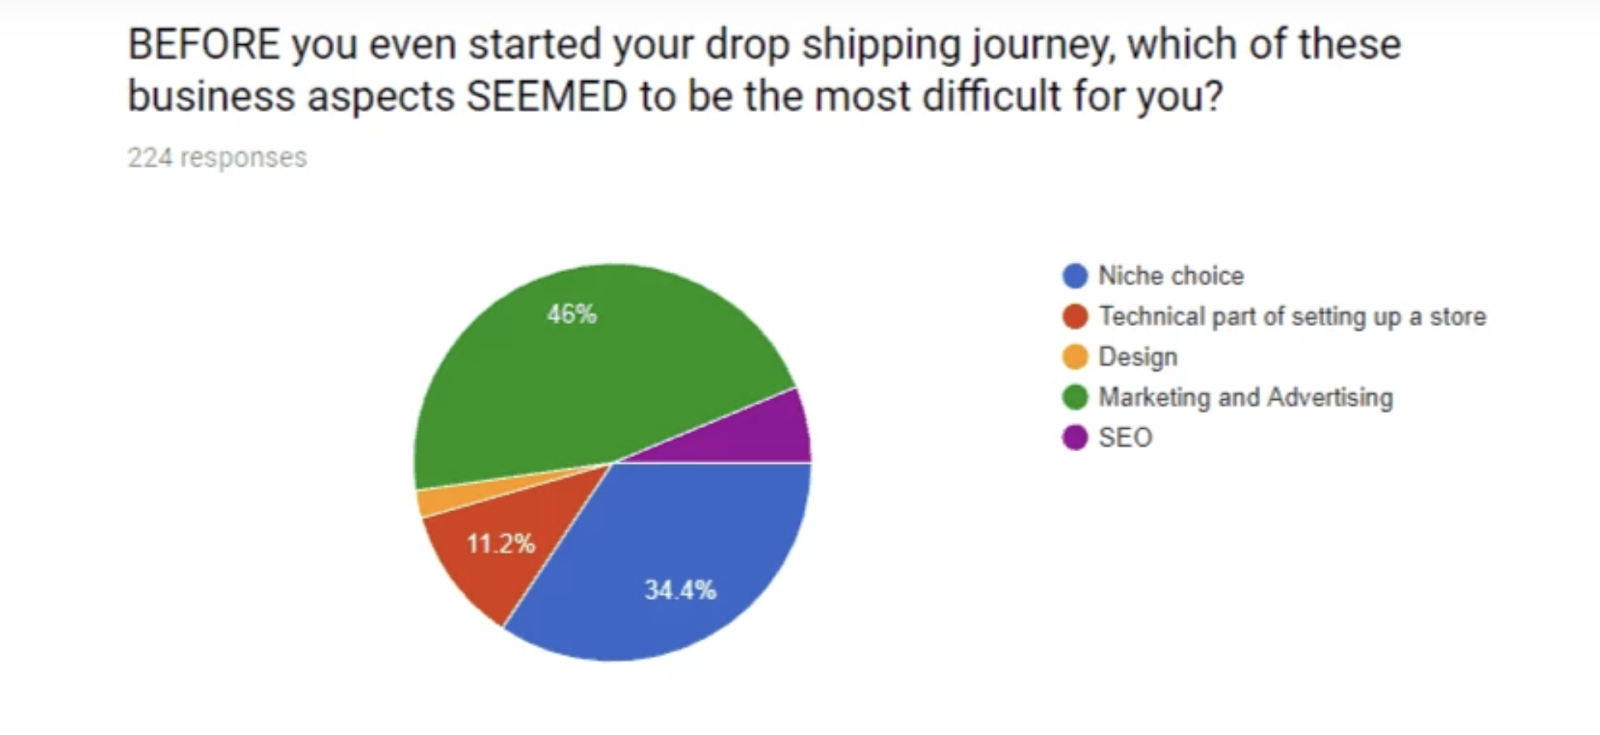
When asked about the most difficult aspects of starting on the dropshipping journey, most beginner dropshippers (46%) selected marketing and advertising60.
This was followed by niche choice at 34% and the technical aspects of setting up a store at 11%.
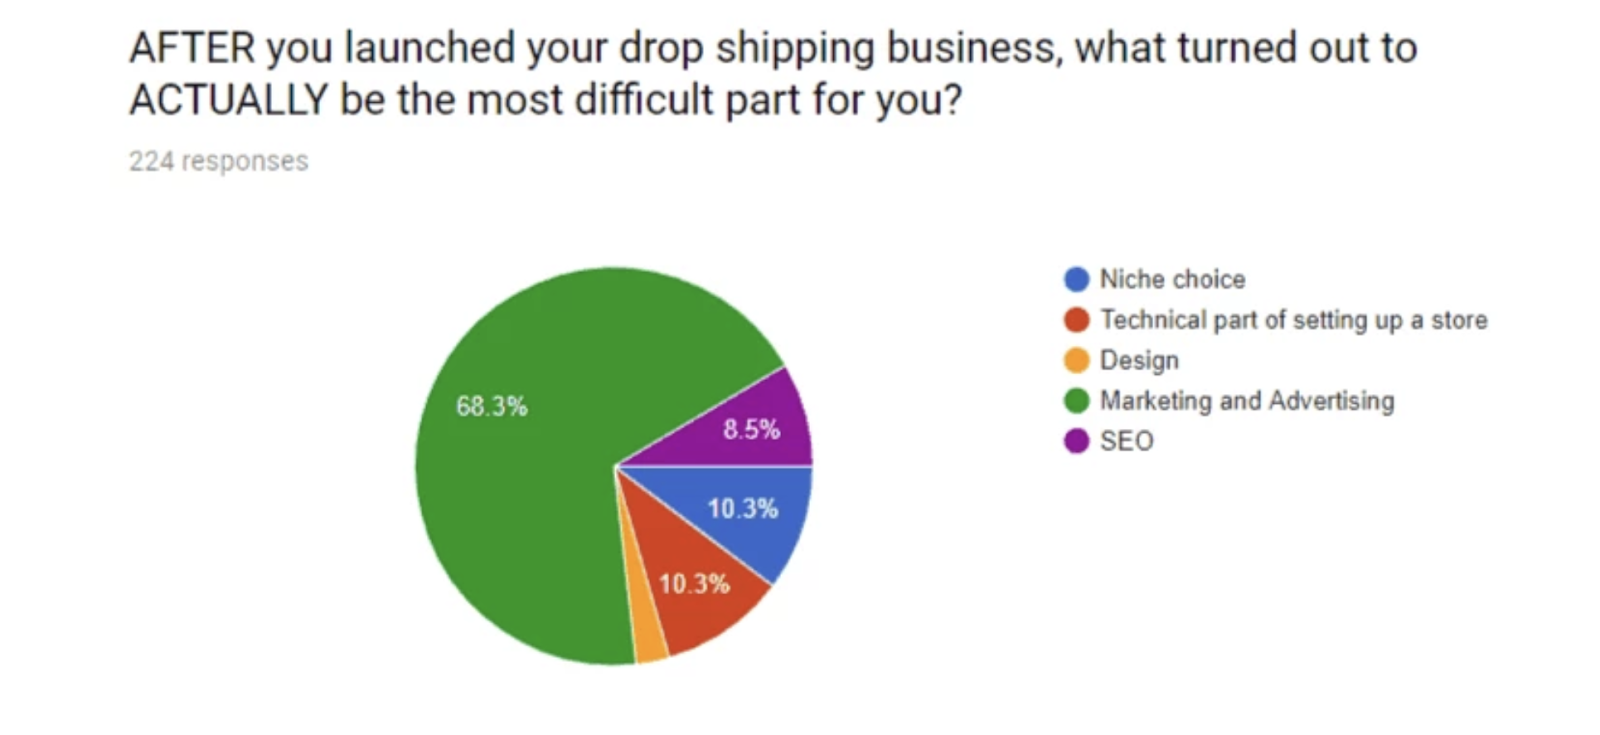
Over 68% of experienced dropshippers cited marketing and advertising as the most difficult aspect of dropshipping.
This was followed by:
- Niche choice at over 10%
- Technical store setup at over 10%
- SEO at 8.5%
The average dropshipping return rate was around 10% to 30%61 in 2024.
The key reasons customers returned dropship products included:
- Receiving a damaged product - 20%
- Receiving product that looks different - 22%
- Receiving the wrong item - 23%
With nearly 40% of consumers returning at least one item purchased online per month62, rising return rates were a key challenge for online sellers and dropshippers alike.
Strikingly, the return rate for online sales (25%) was almost 3x that of in-store returns (8.7%).
Overall, fraudulent returns made up 15% of all retail returns in the US63.
This resulted in substantial losses of over $103 billion for dropshippers and other online sellers, up 2% from $101 billion in 2023.
Particularly, when it came to apparel and footwear, an alarming 9% of consumers admitted to always ordering multiple items with the intent of returning them.
31% engaged in this behavior, known as bracketing, sometimes. This practice was more common with Gen Z (37%) and Millennials (36%).
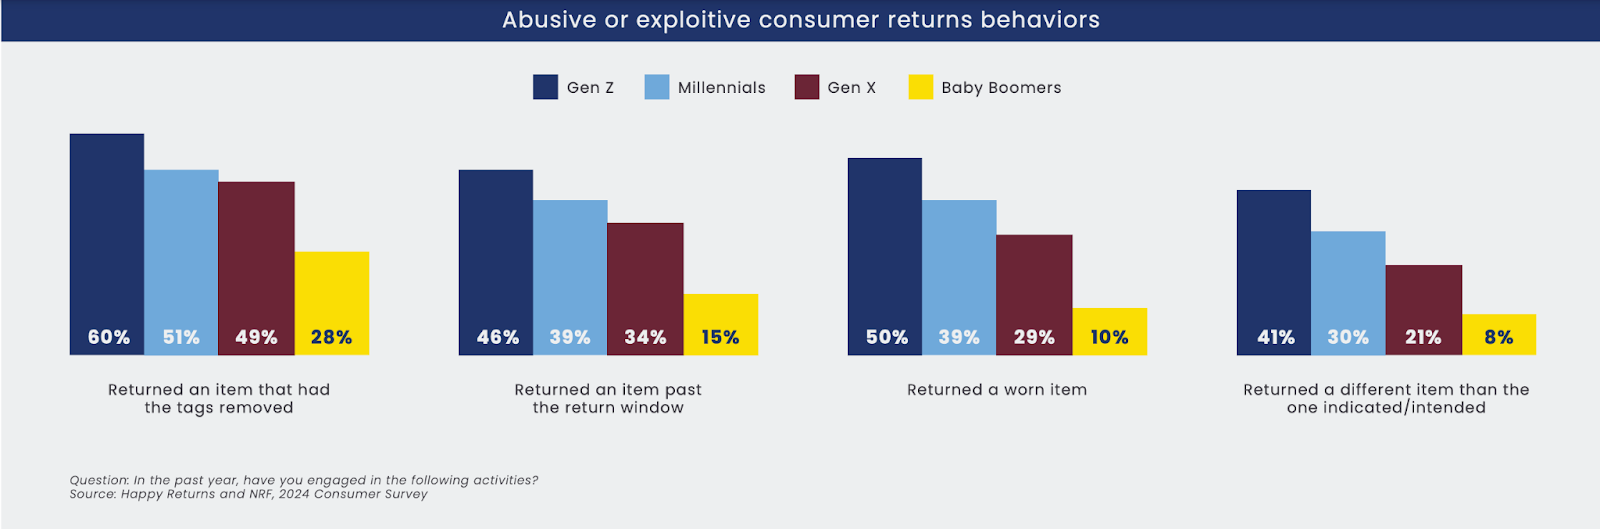
Other abusive returns practices included:
- Returning items with tags removed (60% for Gen Z and 51% for Millennials).
- Returning items past the return window (46% for Gen Z and 39% for Millennials).
- Returning worn items (50% for Gen Z and 39% for Millennials).
Chargebacks or customer transaction disputes cost dropshippers and other online sellers over $54 billion in 202464.
With an 18% increase year-over-year, sellers felt chargeback abuse was a greater threat than refund abuse. They also stated that recovering revenue from incorrectly filed chargebacks and reducing overall chargeback rates was a key challenge.
Increase your chances of dropshipping success with Whop
Looking to venture into the world of dropshipping?
Whop is here to help!
From finding the right supplier, to choosing a reliable platform and using the right marketing strategies, there is so much to consider when it comes to dropshipping. What do you do when there is so much to learn? You listen to the experts.
Whop is home to thousands of creators who share their knowledge and experience inside of their whops. In these whops you can find online courses, masterminds, communities, ebooks, webinars, tools, and everything in-between.
Just head to the ecommerce category on Whop, find dropshipping groups, and choose the right whop for you.
Sources
References
- Statista
- Brainy Insights
- DCLCorp
- Mordor Intelligence
- Printify
- Cloudways
- Maximize Market Research
- GM insights
- Google Trends
- Oberlo
- Amazon
- Market
- Meltwater
- Similarweb
- Zendrop
- Printful
- Market
- Jungle Scout
- Shopify
- Dropshipping
- Jungle Scout
- AliDropship
- Statista
- Jungle Scout
- Research and Markets
- Statista
- Fortune Business Insights
- Business Research Insights
- Jungle Scout
- AutoDS
- Seo
- Store Leads
- Helpcenter App
- Dsers
- Printiful
- Gelato
- Printify
- CJDropshipping
- Spocket
- Doba
- Zendrop
- SaleHoo
- Modalyst
- Clear
- Extensiv
- PWC
- Amazon
- NRF
- Dynamic Yield
- Dynamic Yield
- Salsify
- Statista
- Omisend
- DataReportal
- Minea
- Agency Analytics
- Munch
- Printiful
- Wix
- Alidropship
- Sell the Trend
- Retail Dive
- NRF
- Chargebacks 911