Discover over 100 subscription statistics you need to know, including subscription behavior, revenue, key metrics, and more.
Key takeaways
- Subscription companies outperform traditional businesses, growing 3.4 times faster than S&P 500 companies over 12 years.
- Subscribers generate 3x more revenue per customer than non-subscribers, making retention crucial for business growth.
- Converting free users to paid subscribers remains challenging, with only 1.7% of app downloads becoming paying customers.
Subscriptions have transformed how consumers experience products and services, offering convenient, ongoing access to what they value most. For businesses, the subscription economy has unlocked a lucrative and reliable revenue stream. With an estimated value of $3 trillion in 2025, this booming business model shows no signs of slowing down.
At Whop, we’ve compiled over 100 subscription statistics for 2026, ensuring you have the insights to make informed decisions. Read on as we explore the subscription economy, subscriber behavior, key subscription metrics, and more.
Subscription Economy Statistics
The subscription economy, or the trend of businesses shifting to subscription-based business models, was valued at a whopping $3 trillion in 2024, up from estimates of around $2 trillion in 20231.
While the 21st century has accelerated digitalization and the demand for convenience, the concept of subscriptions has been around for centuries:
- The first subscriptions were book subscriptions and can be traced back to the 1610s2.
- The 1630s brought about the first insurance schemes, and by the 1690s, subscriptions to educational lectures were introduced.
- By the 1830s, newspaper subscriptions were launched and the 1880s ushered in telephone subscriptions.
- In the 1970s, TV subscriptions were created, and by 1989, the first internet subscriptions were introduced.
- The 2000s spawned subscription giants like Netflix, Amazon, Spotify, and YouTube while the 2010s and 2020s brought new models like subscription boxes, curated memberships, and more.
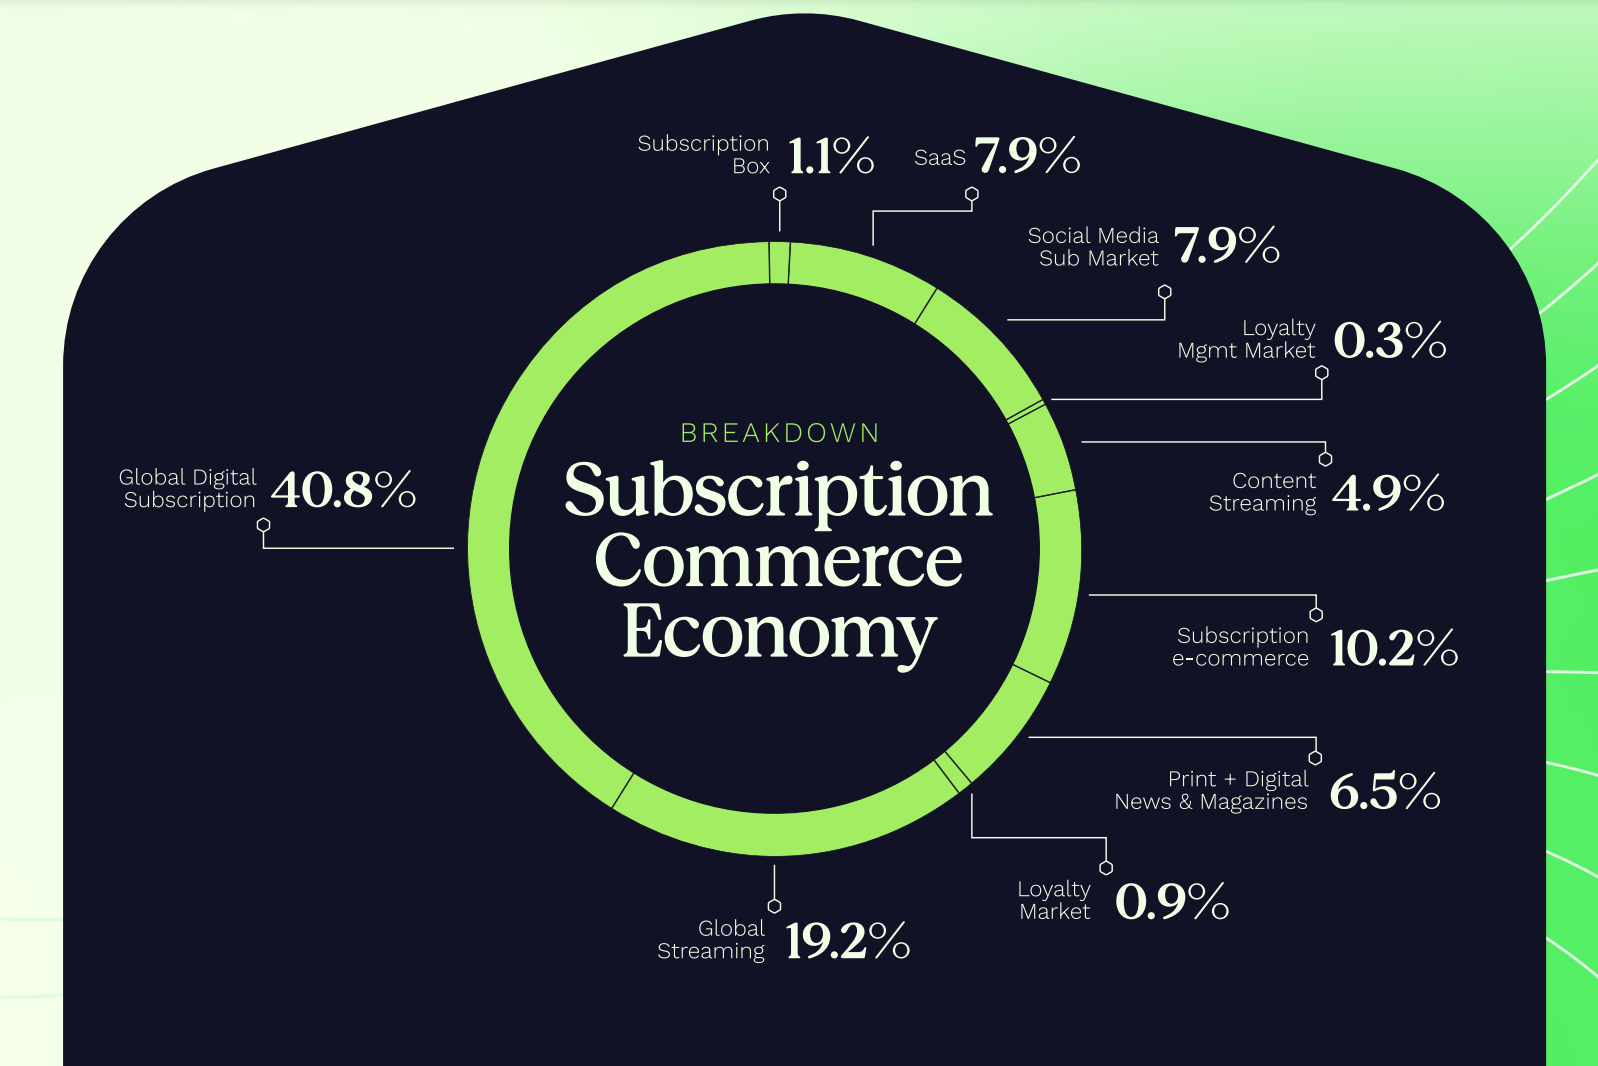
At over 40%, global digital subscriptions accounted for the lion's share of revenue generated in the subscription economy.
In second place was global streaming at 19%. This was followed by:
- Subscription ecommerce at 10%
- SaaS at 8%
- Social media subscriptions at 8%
- Print & Digital News and Magazines at 7%
- Content Streaming at 5%
- Subscription boxes at 1%
- The loyalty market at 1%
Over the last 12 years, companies in Zuora’s Subscription Economy Index (SEI) have grown 3.4 times faster than companies in the S&P 5003.
Over the period, the compound annual growth rate (CAGR) for companies in the index was 16.5% compared to 4.8% for S&P 500 companies.
Streaming Subscription Statistics
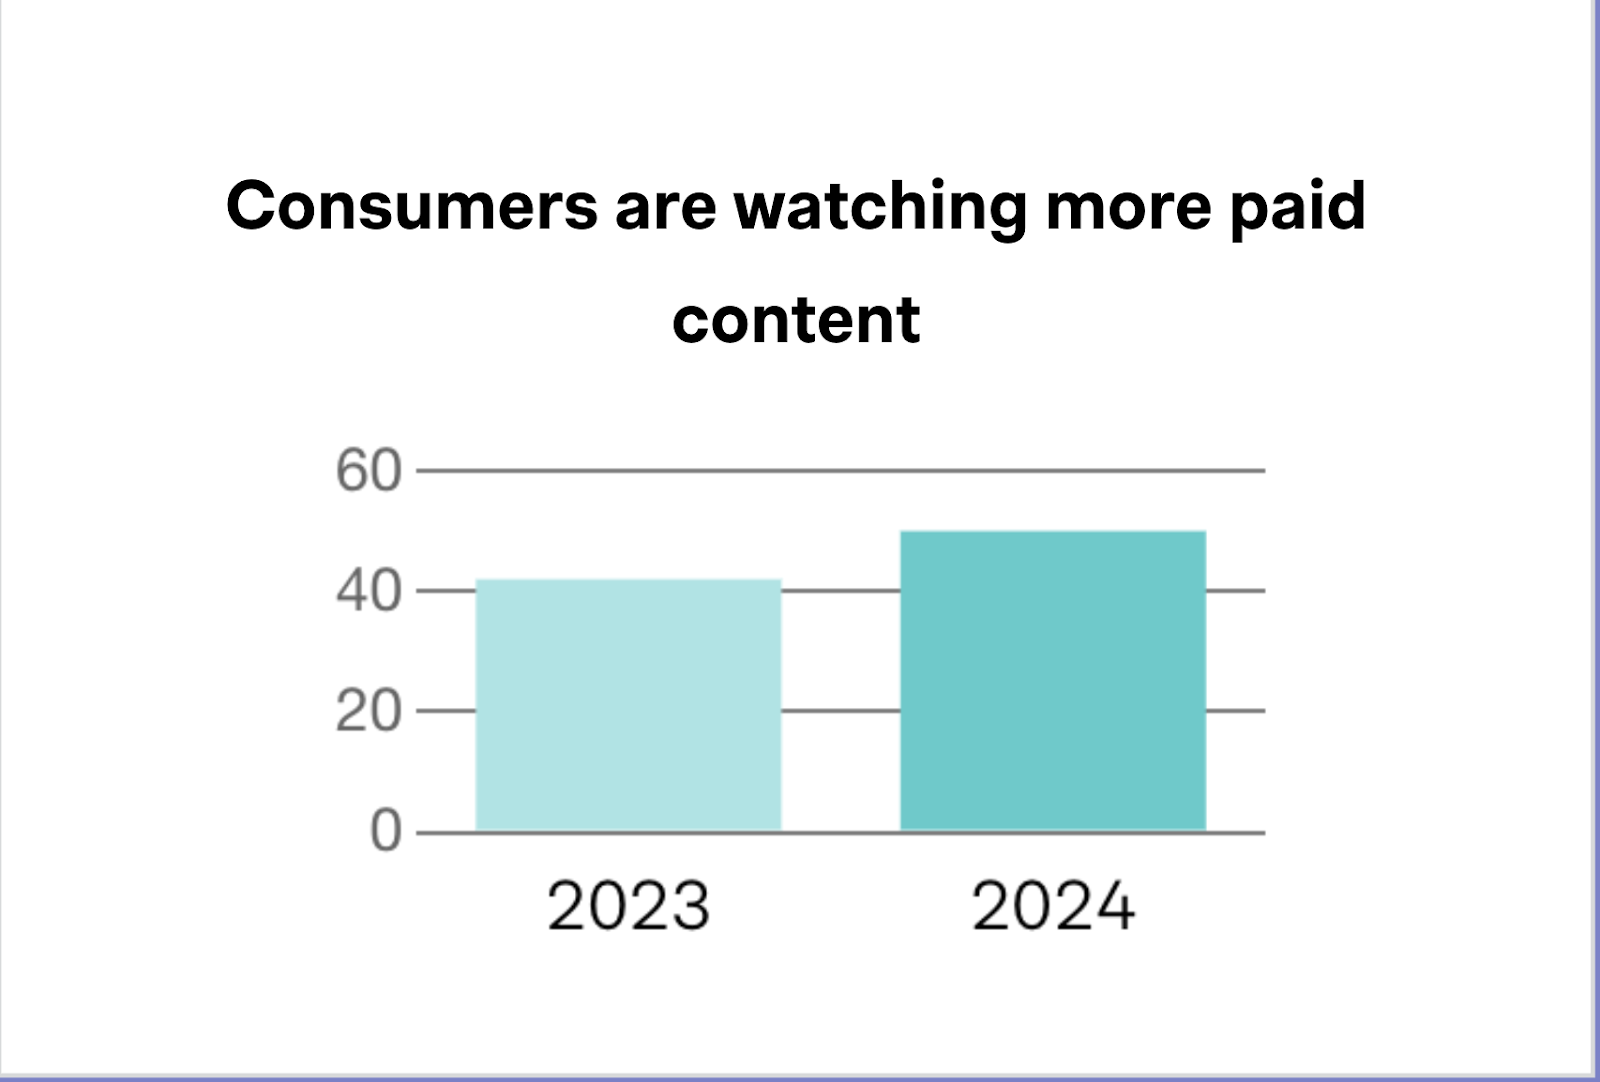
Over 87% of consumers made use of streaming services in 2024, with 50% paying for subscriptions4.
The top 3 streaming platforms they paid for were Netflix, Spotify and Disney+.
Due to challenges like competitive intensity, churn, and the impact of social media, there was a 4% decrease in consumer streaming in 2024 compared to 2023.
Subscriptions increased from 2.4 to 3 per subscriber, representing a 25% increase in subscriptions per streamer.
This was driven primarily by platforms like Netflix and Disney+ restricting password sharing.
As a result of subscription fatigue, 39% of global subscribers planned to cancel at least one subscription within the next year.
54% planned to cancel due to content issues while 43% felt they spent too much on streaming.
Average spending on streaming increased by 30% from $48 in 2023 to $61 in 2024.
Monthly spending varied across generations with millennials spending $67, Gen Z spending $63, Gen X spending $62 and Boomers spending $53.
Social Media Subscription Statistics
Citing benefits like user verification, no ads, and more, major social media platforms have implemented paid subscriptions.
For example as of 2024:
- YouTube Premium had 100 million subscribers.
- SnapChat+ had 7 million subscribers.
- Twitter (X) had 640,000 premium subscribers.
- Meta Verified (Facebook) had an estimated 12 million subscribers.
- Reddit had over 530,000 premium subscribers.
When asked about their quality expectations for social media subscriptions (1 being “not very high” to 10 being “very high”), social media users’ responses ranged from 7.25 to 7.38, with Instagram users being the most optimistic5.
The study found that users under 35 perceived social media subscriptions as higher in quality, value, and potential satisfaction and were more likely to sign up for them. Gender-wise, men had higher expectations of social media subscriptions.
In terms of meeting users' personal requirements, (1 being “not very well” to 10 being “very well”), users' responses ranged from 7.31 for Facebook to 7.41 for Instagram.
College-educated and conservative users perceived the features offered through subscriptions on Facebook, Instagram, Twitter (X), and Snapchat as of a much higher quality.
Given the price of social media subscription services, (1 being “very poor price given the quality” to 10 being “very good price given the quality”), users rated major social media platforms as follows:
- Snapchat had the highest score at 7.38.
- Twitter (X) received the second-highest score at 7.37.
- Instagram had a score of 7.28.
- Meta Bundling had a score of 7.25.
- Facebook had the lowest score at 7.23.
On a scale of 1-10, users were more satisfied with Instagram (7.42) and Snapchat’s (7.41) subscription services than they were with features offered by Facebook (7.32) and Twitter/X (7.35).
Overall, when it came to the likelihood of paying for a social media subscription, Snapchat received the highest score. This was closely followed by Instagram, Facebook, and Twitter(X).
Digital Subscription Statistics
Since 2020, the Digital Media and Entertainment industry has seen a 124% increase in subscribers6.
Within the industry, Publishing has shown an even greater growth rate of 536% over the same period.
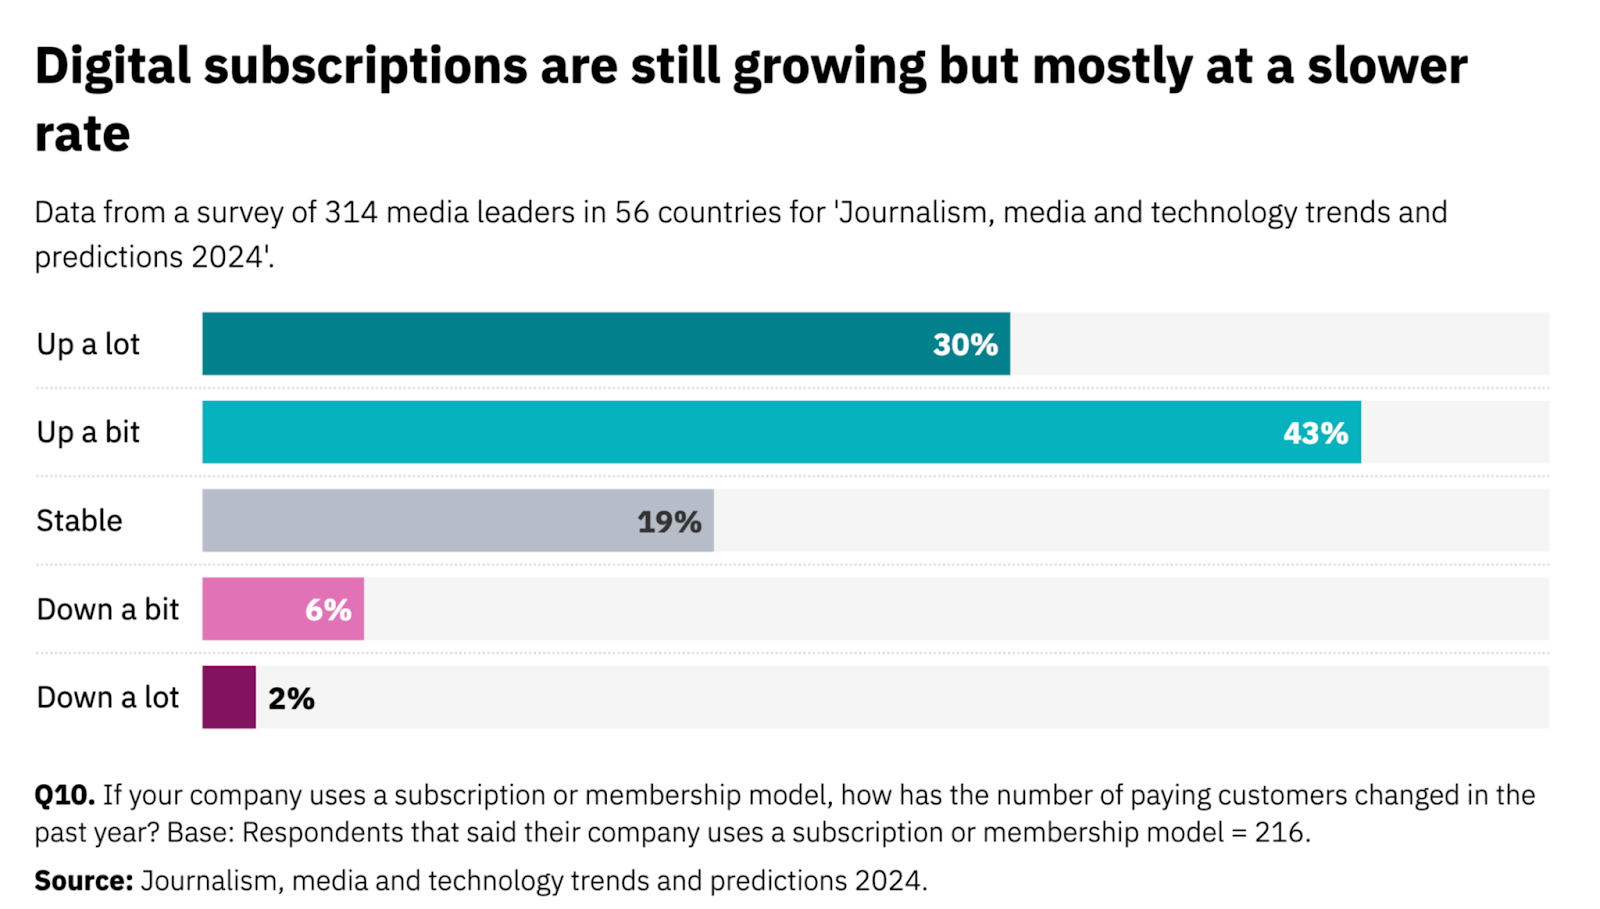
In 2023, digital subscription growth in publishing remained stable, with 73% of over 300 digital leaders across 50 studied countries stating that digital subscriptions were up7.
Meanwhile, only 8% of digital leaders reported that subscriptions were down.
80% of media leaders cited digital subscriptions and memberships as the most important revenue stream for publishers in 2024, up from 74% in 2020.
This was ahead of display ads (72%), native ads (61%), and events (49%).
When asked how they planned to increase digital subscriptions and combat subscription fatigue:
67% of publishers planned to deliver more varied content while 44% planned to produce more inspiring content. Other strategies included bundled subscriptions and personalized pricing strategies.
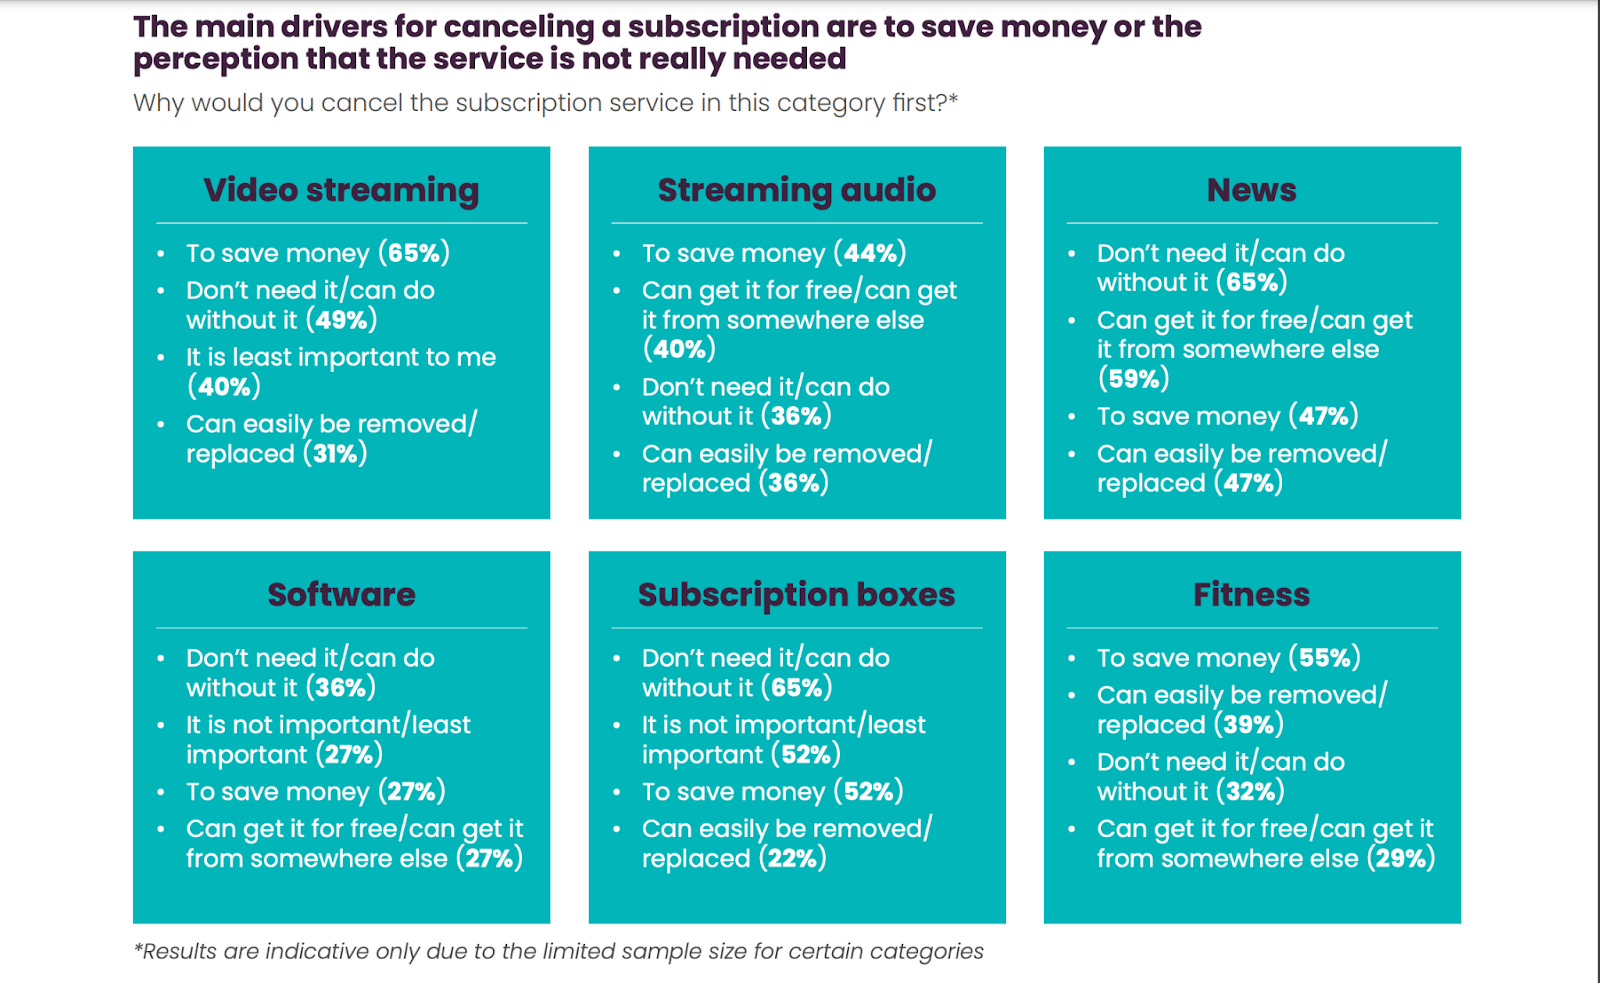
Subscribers who canceled a digital software subscription service did so primarily because they didn't need it (36%).
Other key reasons included a lack of importance or saving money (27%) and being able to get it for free (27%).
Those who canceled a digital news subscription also did so because they didn’t need it (65%).
Other key reasons included being able to access it for free elsewhere (59%) and saving money(47%).
App Subscription Statistics
As of 2024, app subscriptions generated $45.6 billion, with the United States accounting for over 50% of all app subscription revenue8.
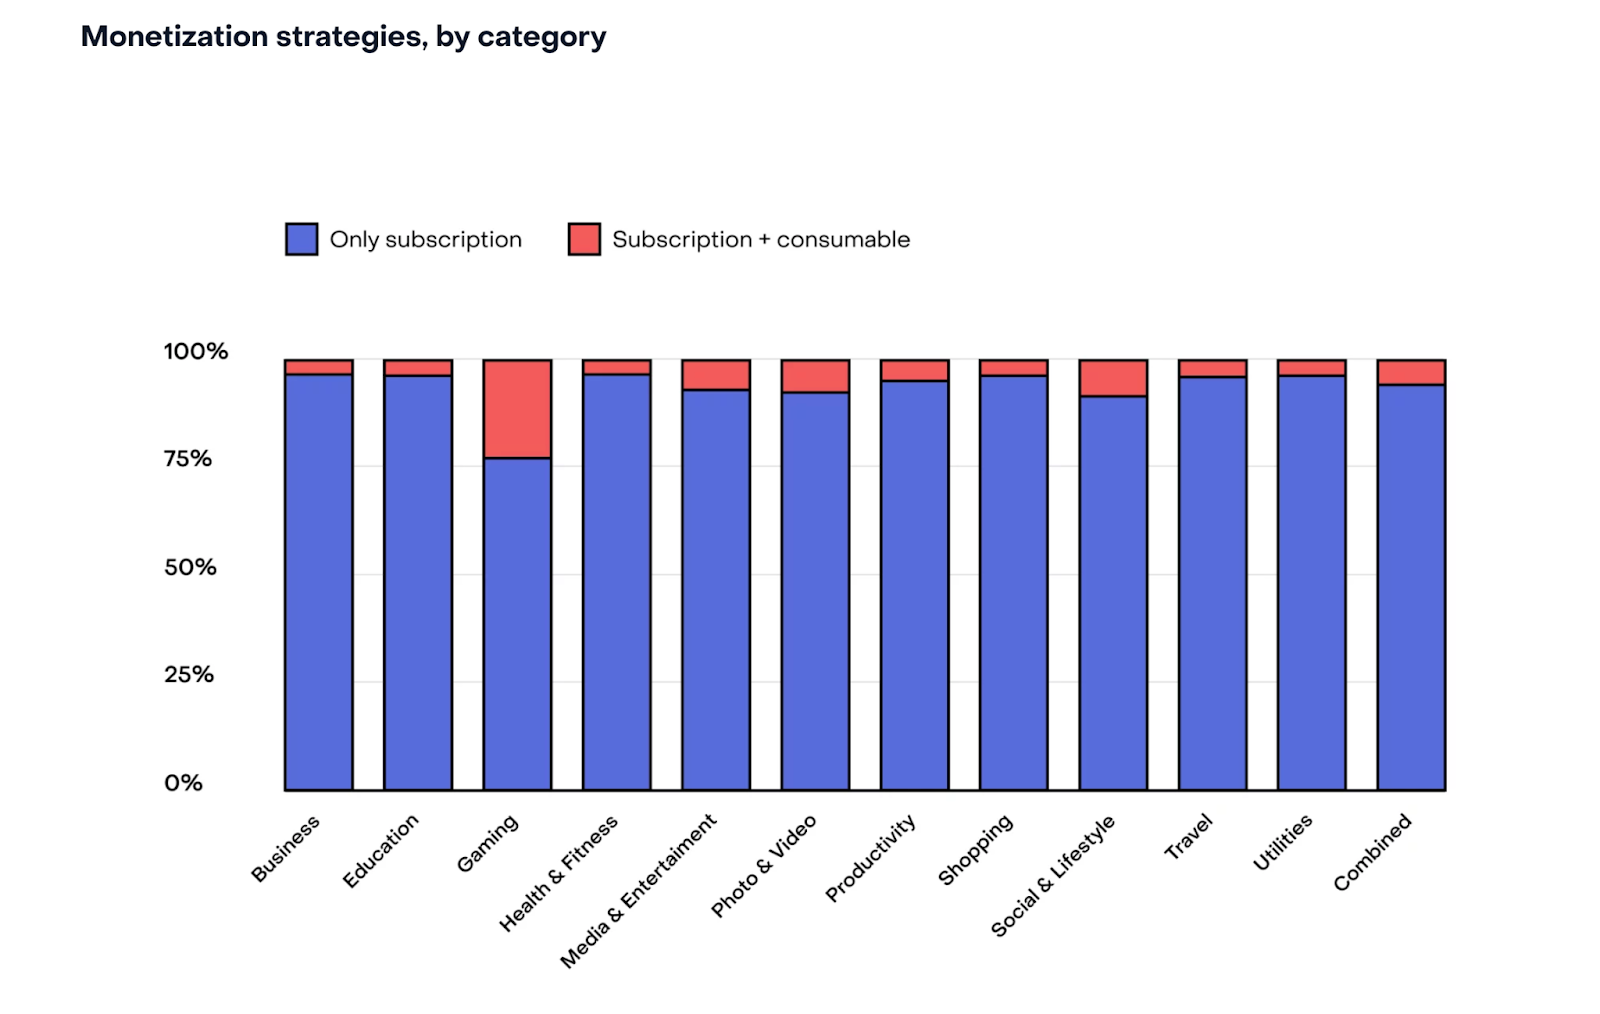
96% of app spending on the App Store and Google Play came from subscriptions and over 25% of all subscriptions were game subscriptions.
According to a 2024 Revenue Cat report, the most common price points for subscription plans were unchanged from 20239 with:
- 1 week at $4.99
- 1 month at $9.99
- 3 months to 1 year at $29.99
The report found that the most common price for a monthly subscription remained the same at $10.
The average price for a monthly subscription increased by 14% from $7.05 to $8.01. On the other hand, the average price of a yearly plan decreased by 1% from $32.94 to $32.53.
The report further revealed that subscription pricing strategies varied across categories, with $4.99 per week, $9,99 per month, and $29.99 per year being the standard.
Exceptions included Education, Business, and Shopping apps whose annual subscriptions ranged from $45-$59.99 per year.
Nearly 50% of apps offered trials, with the majority being under 9 days. Overall, 37% of trials turned into paid subscribers, a 4% decrease year-over-year.
Media and Entertainment subscriptions had relatively longer trial periods of up to 30 days while Game subscriptions had the shortest at 4 days.
In terms of conversions, 1.7% of downloads turned into paying subscribers across all categories and regions.
North America took the lead, particularly with Business (9.8%) and Health & Fitness (9.4%) app subscriptions.
The share of monthly subscribers retained after 12 months fell by 14% across all categories and in the best and worst-performing apps.
- Japan took the lead with a 42% retention rate for annual, 26% for monthly, and 10% for weekly subscriptions.
- While North America accounted for the majority of revenue for subscription apps, the retention rate averaged at 27% for annual, 15% for monthly, and 4% for weekly subscriptions.
Billing errors accounted for over 23% of subscriber churn.
However, monthly subscriptions had the highest reactivation rates (12%). Yearly subscriptions had the lowest reactivation rates (6%).
Subscription Revenue Statistics
Subscription businesses grew by more than 300% between 2012 and 201810.
Notably, this was over 5 times the revenue generated by S&P 500 companies during the same period.
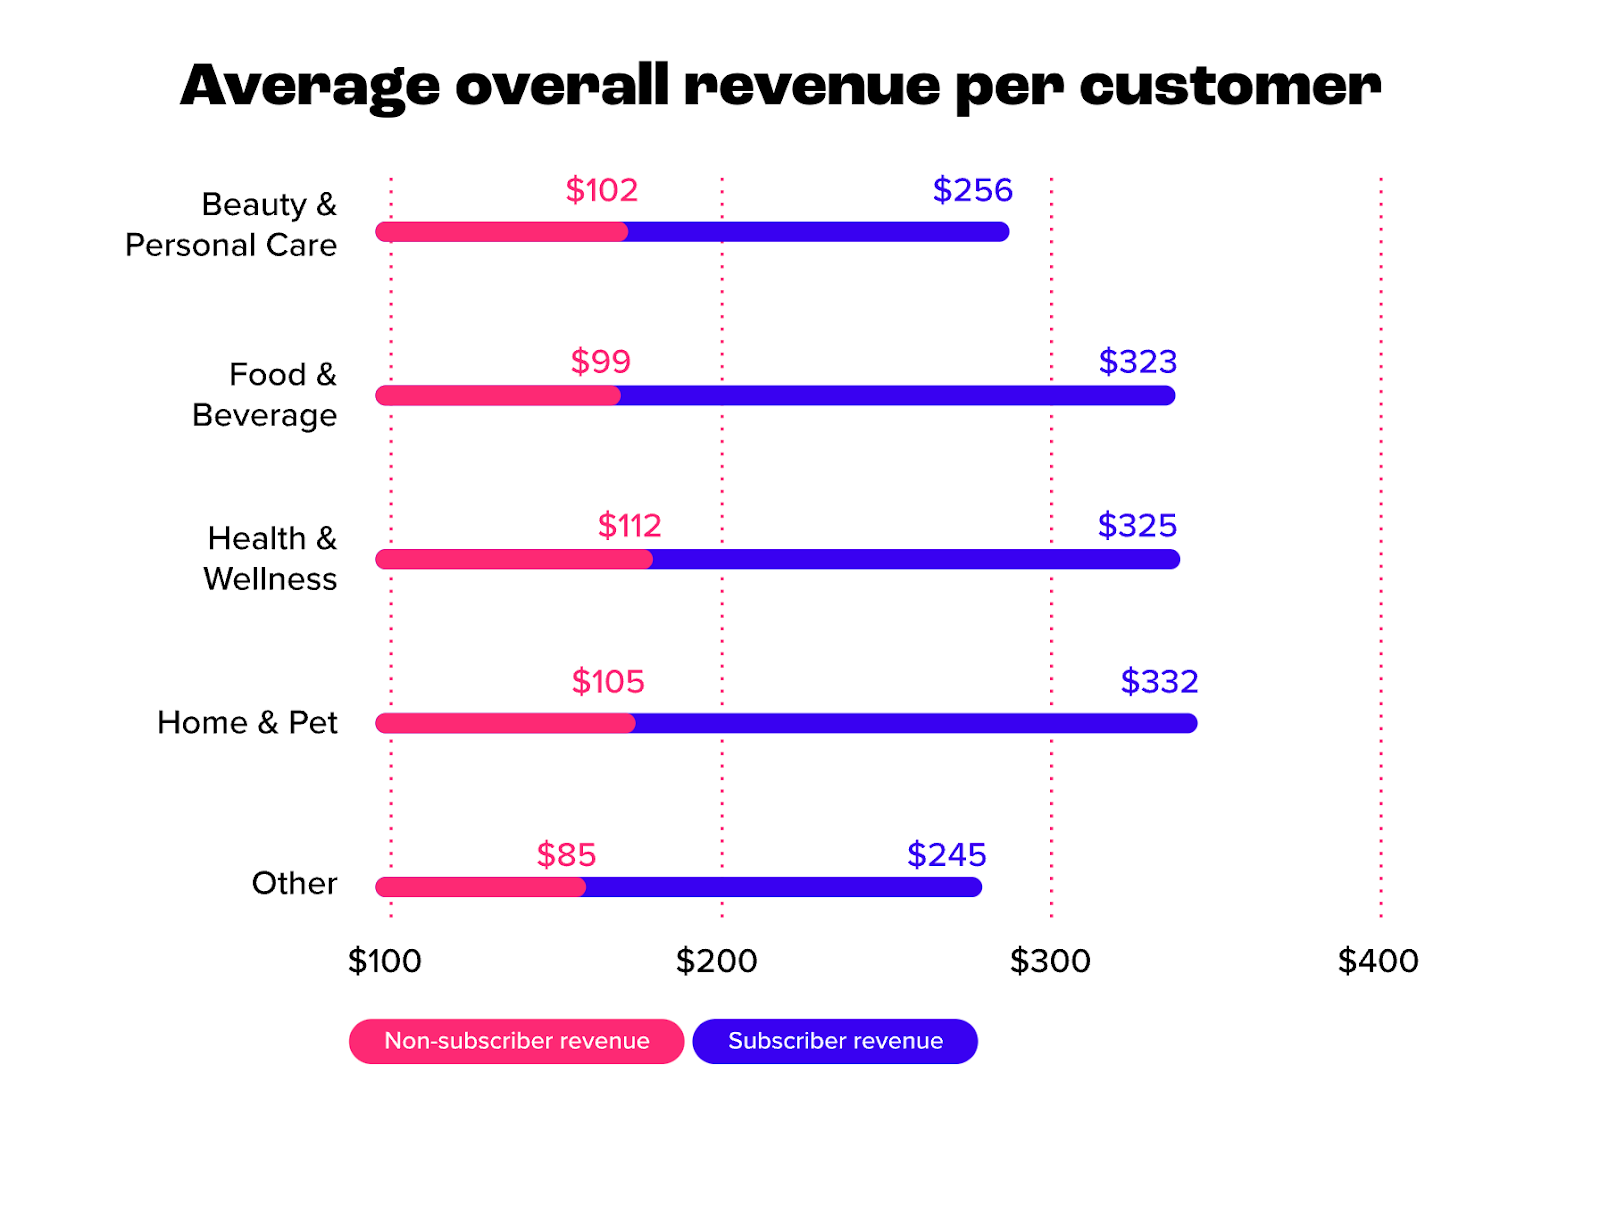
As per a 2024 Recharge report, subscription businesses in the Home and Pet industry had the highest average overall revenue per customer at $332, more than double the average revenue of $105 from non-subscribers11.
Across other verticals:
- Subscription businesses in the Beauty and Care industry had an average revenue per customer of $256 from subscribers versus $102 from non-subscribers.
- Subscription businesses in the Food and Beverage industry had an average revenue per customer of $323 from subscribers versus $99 from non-subscribers.
- Subscription businesses in the Health and Wellness and Care industry had an average revenue per customer of $325 from subscribers versus $112 from non-subscribers.
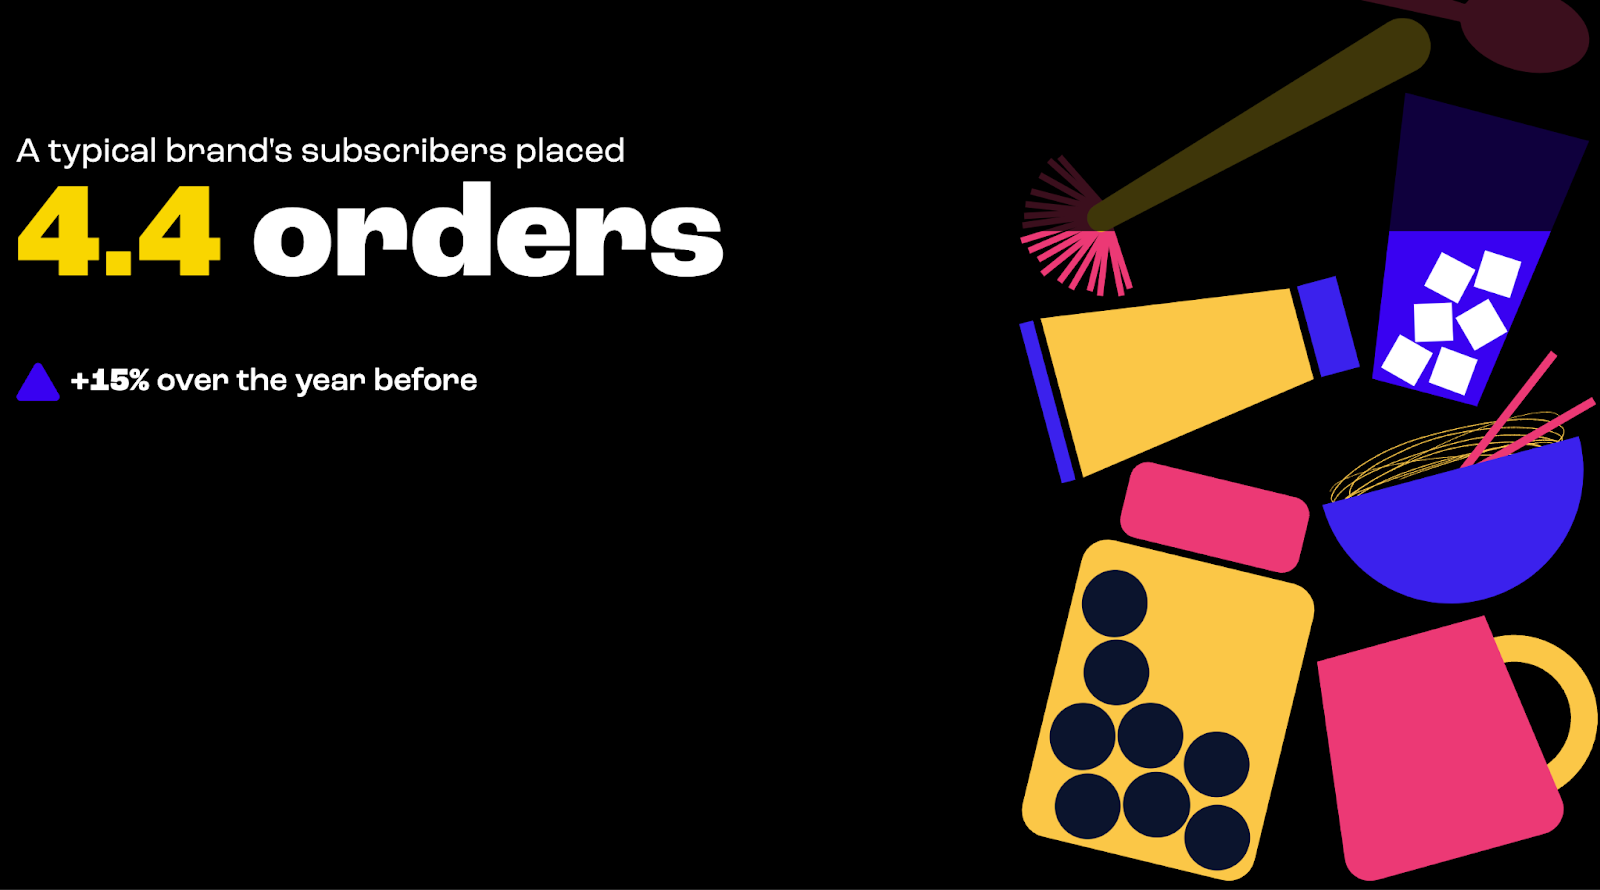
The same report found that a typical subscription company’s subscribers placed 4.4 orders, up 15% year-over-year.
Generally, across verticals, subscribers placed more orders than non-subscribers.
- Beauty and personal care subscribers made an average of 4.4 orders compared to 1.56 orders for non-subscriber customers.
- Food and Beverage subscribers made an average of 4.39 orders compared to 1.62 orders for non-subscriber customers.
- Health and Wellness subscribers made an average of 4.7 orders compared to 1.45 orders for non-subscriber customers.
- Home and Pet subscribers made an average of 3.84 orders compared to 1.62 orders for non-subscriber customers.
28% of subscription businesses offering add-on options for subscribers to personalize their subscriptions generated $2.2 billion in incremental value in 2024.
46% more subscription businesses adopted add-ons in 2024, translating to a 272% lift in incremental revenue from 2020.
As per a 2023 report, annual revenue per account (ARPA) trended upward in the quarters between 2019 and 202312.
Q1 2023’s growth rate was 0.73% and 2x higher at 1.76% in Q4 2023. Meanwhile, 2023’s average quarterly growth rate of 1.5% was a slight improvement from an average of 1.29% in 2022.
The same report found that the average order value (AOV) for subscription businesses was $47, an 11% increase year-over-year.
- Subscription businesses in the Health and Wellness industry had the highest AOV at $63, a 7% increase from 2022.
- Subscription businesses in the Home and Pets industry had an AOV of $62%, up 3% from 2022.
- Subscription businesses in the Food and Beverages industry had an AOV of $59, up 7% from 2022.
- Subscription businesses in the Beauty and Personal Care industry had an AOV of $57, up 12% from 2022.
- Subscription businesses in other industries had an AOV of $58, down 5% from 2022.
Subscription businesses saw an average of 12% lifetime value growth in 2023.
Merchants with 10,000 or more subscribers saw higher levels of LTV growth than those with fewer than 10,000 subscribers. At $258, LTV was highest among subscription merchants in the Food and Beverages industry. LTV in this vertical also saw a notable 10% increase year-over-year.
- Subscription businesses in the Health and Wellness industry had an LTV of $250, up 6% from 2022.
- Subscription businesses in the Home and Pets industry had an LTV of $212, up 2% from 2023.
- Subscription businesses in other industries such as Hobbies had an LTV of $197, down 9% from 2022.
- Subscription businesses in the Beauty and Personal Care industry had an LTV of $158, up 15% from 2022.
Monthly recurring revenue (MRR) increased by 7% for all subscription businesses in 2023.
- Subscription businesses in the Pets and Animals industry had the highest MRR at $61,202.
- Subscription businesses with over 50,000 subscribers had the highest MRR at $2 million.
- Subscription businesses in the Home Goods industry saw an average of 14% MRR growth, well above the average of 7%.
Companies in the Subscription Economy Index had a 10% revenue growth rate in 2023.
This outpaced the S&P 500 companies’ revenue growth of 6%. Looking at individual sectors:
- The SaaS sector experienced a 10.1% revenue growth rate, down 1.3% from 2022.
- The Media and Entertainment sector saw a 6% revenue growth rate.
- The New Media subsector (streaming and gaming) saw a revenue growth increase of 12%.
- The Media subset (traditional and digital newspapers and magazines) saw a revenue growth rate of 5.6%.
Subscription Acquisition Statistics
With growth rates of 2.2% in Q1 2023, 1.2% in Q2 2023, 0.5% in Q3 2023, and 1.1% in Q4 2023, customer acquisition for companies in the SEI index slowed in 2023.
This is compared to growth levels of:
- 2.2% in Q1 2022
- 2.5% in Q2 2022
- 2.5% in Q3 2022
- 2.2% in Q4 2022
In a 2024 Recurly report, the median acquisition rate was 3.7%, down from 4.1% in 202213.
Shaped by shifts in the economy, competitive forces, and consumer preferences, customer acquisition rates fell from a peak of 5.3% in 2020, to 4.7 in 2021.
25% of top-performing subscription brands offered free trials to convert shoppers to subscribers.
75% of consumers were more likely to subscribe if a free trial was offered.
73% of consumers were more likely to subscribe if they got a discount for subscribing over a longer time period.
A further 65% would be even more inclined if a free gift was included.
The trial-to-paid conversion rate, or the proportion of trial users who transitioned into paying subscribers was 50%.
This was down from:
- 56% in 2022
- 58% in 2021
- 60% in 2020
Additionally, the most effective trial length for converting to paid subscribers was 7 days or shorter.
Within this period, 79% of trials converted into paid subscriptions.
The median sign-up decline rate, or the measure of failed sign-up transactions, was 11%, up from 10% in 2022, 8.4% in 2021 and 8% in 2020.
The sign-up decline rate was highest (16%) in the Digital and Media Entertainment industry, followed by:
- Education at 13.1%
- Publishing at 11.6%
- Business and Professional services at 10.7%
- Software at 10.4%
Subscription Retention Statistics
Companies in the Subscription Economy Index experienced a churn rate of 6% in 2023, down from 6.61% in 2022.
The churn rate was also lower than in 2020 and 2021, where churn rates were 6.75% and 6.39%, respectively. This suggests that companies retained, rather than lost subscribers over the period.
In the previously mentioned Recurly report, the median customer retention rate was 95.9%.
Meanwhile, the median subscriber churn, or discontinuation of a subscription was 4.1% across industries, remaining consistent year-over-year.
Churn rates were highest (4.3%) in 2020 and at their lowest at 4% in 2021.
The Digital Media and Entertainment industry had the highest churn rate (6.9%) in 2023, followed by the Education industry at 6.6%. At 3.5% the software industry had the lowest subscriber churn rate.
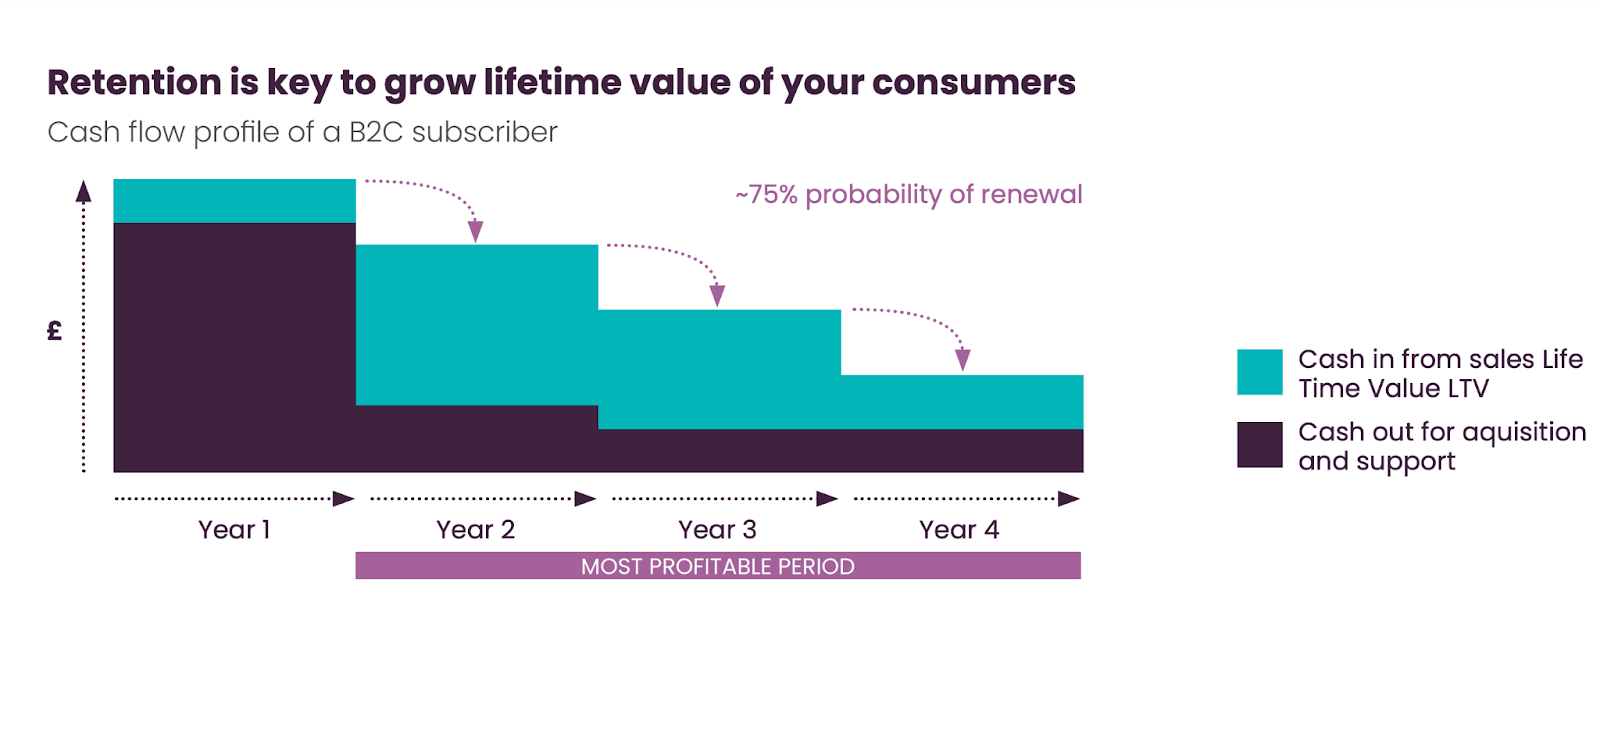
The average rate of cancellations for key subscription categories such as streaming video, audio, gaming, and software was 14% after 4-6 months subscribed14.
This highlighted that the first few months were critical in establishing and fostering a new subscription relationship. Plus, the longer a customer stayed, the less likely they were to cancel.
The cancellation of a subscription due to payment failure, otherwise known as involuntary churn rate was 1%.
- The top payment failure reasons for sign-ups included fraud (37%), generic decline (35%), and insufficient funds (5%)
- The top payment failure reasons for renewals included generic decline (39%), insufficient funds (32%), and Invalid account number (5%)
Customers extended their subscription by 141 days following a recovery event such as an email.
In addition:
- Subscribers kept subscribing for close to 40% of their total time as a customer.
- Dunning emails or reminder emails about overdue or failed payments had a recovery rate of 49%.
- A subscription pause feature was yet another effective tactic to increase retention and prevent cancellations.
Subscription Consumer Statistics
86% of consumers were active subscribers, down from 96% in 2023.
As mentioned earlier, the greatest number of subscriptions (over 70%) were in the streaming industry. Meanwhile:
- 29% of consumers paid for a retail subscription and the top 4 platforms they subscribed to included Amazon, Target, Walmart, and Panera Bread.
- 25% of consumers paid for a digital subscription and the two top platforms they subscribed to included language learning app Duolingo and online course platform, Masterclass.
A 2024 breakdown of subscription use based on income revealed that higher-income individuals made use of subscription services more often15.
- 82% of those who earned over $100,000 used subscription services.
- 72% of those who earned $50,000-$99,000 used subscription services.
- 66% of those who earned $25,000-$49,999 used subscription services.
- 52%of those who earned under $25,000 used subscription services.
Subscription use was also higher among younger consumers, with 70% of consumers aged 18-44 making use of subscription services.
This was compared to 63% of consumers aged 45-64 and 55% of consumers over 65.
In 2024, the top 3 reasons consumers subscribed included:
- Liking a subscription.
- Reasonable pricing.
- A subscription making their life easier.
The average consumer had 8.2 subscriptions in 2024.
They also spent around $118 per month or $1,416 per year on subscriptions.
Over 50% of consumers tracked their subscription spend, up 9% from 2023.
The data also showed that 37% of consumers spent more on subscriptions, mainly due to price hikes(60%) and increased usage (15%).
46% of consumers aged 18-24 spent more year-over-year, making Gen Z the age group that spent the most on subscriptions.
This was followed by 41% of consumers aged 25-34 and 37% of consumers aged 35-44.
For 45% of customers, financial incentives were the most important factor driving their decision to subscribe16.
The ability to save money was 1.6 times more important to consumers than other factors such as convenience (33%) and access to premium offerings (29%).
In terms of switching subscriptions, financial incentives were also considered the most important factor for 51% of consumers.
Being able to save money was 2.2 times more important than other factors when consumers sought to switch to a new subscription provider.
74% of consumers considered personalization as one of the top reasons for subscribing.
In fact, 65% of consumers said being able to customize their subscriptions would make them reconsider canceling.
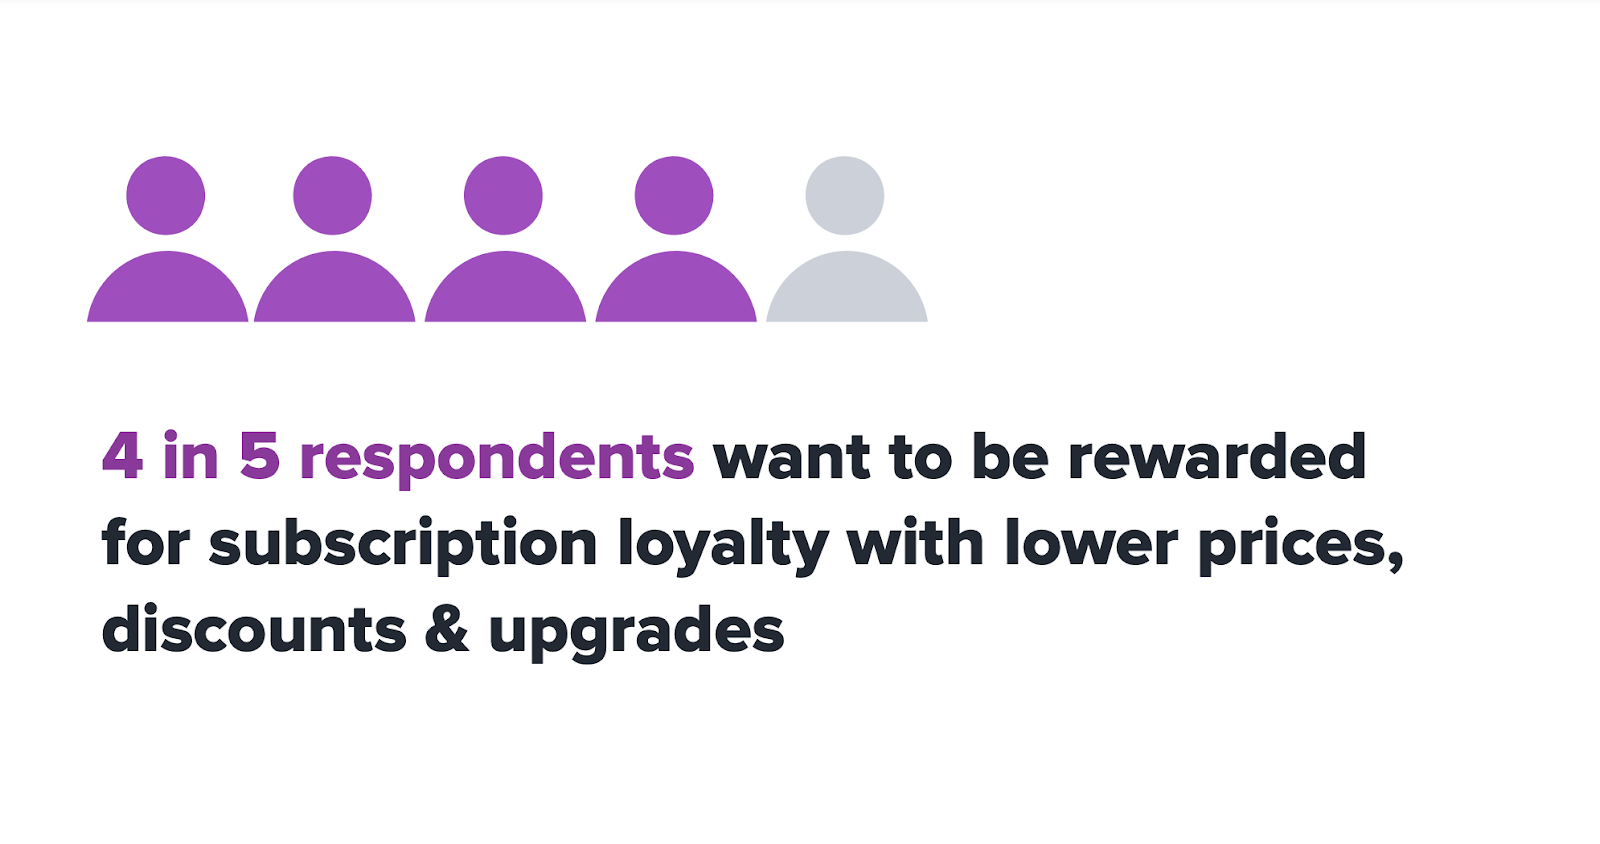
80% of consumers ranked being rewarded for subscription loyalty as important. Meanwhile, over 80% of consumers said they would stay subscribed if loyalty incentives were part of their subscription.
Their top choices included lower subscription prices (82%), discounts (81%) and upgrades (80%).
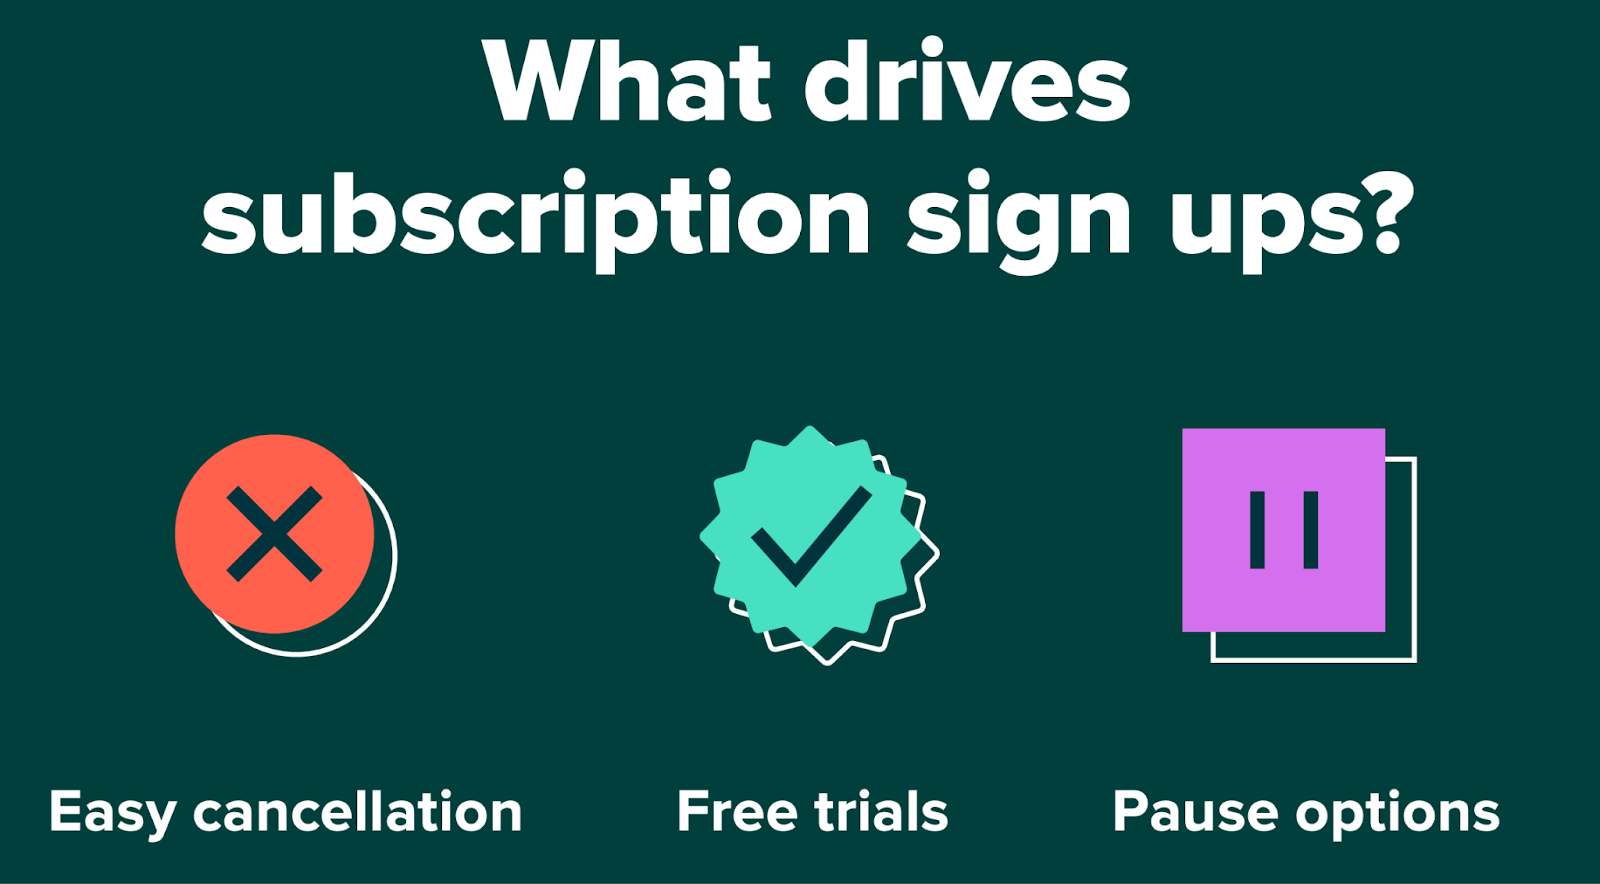
77% of consumers said they were more likely to subscribe if canceling the subscription was a hassle-free affair.
71% said they were more likely to subscribe if it was possible to pause the subscription.
61% of consumers were more likely to subscribe if given the ability to choose their own payment date.
On the other hand, 53% were more likely to unsubscribe if a payment decline caused a disruption in their subscription service. A further 18% said they would feel more valued if offered the ability to personalize their payment type.
78% of consumers said free trials were crucial to creating a great subscriber experience.
In fact, 15% felt valued when they were given a free trial to share with someone.
While 72% of consumers knew the exact number of companies they were subscribed to in 2024, 73% also wanted the ability to manage their subscriptions in one central hub.
69% also wanted to be able to pay for all of their subscriptions in one bill. An additional 61% of consumers were actually prepared to pay more for their mobile or internet bill provided it was bundled with subscriptions.
The interest in consolidated subscription management increased with the number of total subscriptions: 83% of consumers with over 15 subscriptions were interested in consolidation.
Overall, Gen Z and Millenials had higher than average interest in having an all-in-one subscription management app. They were also 2 times more likely to switch banks for this functionality.
50% of consumers canceled at least one subscription service in the first 6 months of 2024.
61% were 18-44-year-olds, while 55% were those earning under $25,000, reflecting that subscription cancellations were more common among younger and lower-income consumers.
In 2024, over 30% of consumers planned to cancel their subscriptions due to rising prices.
However, 73% of consumers said they would reconsider if offered a price decrease, while 70% said they would reconsider if given a loyalty discount or incentive.
Additionally:
- 68% would also reconsider if given the option to upgrade without a price hike, downgrade without penalty, or customize their plan.
- Over 25% of consumers said if a subscription company delivered on the above actions, they would consider remaining subscribed for an extra 4-6 months or until their next renewal.
While 20% of consumers could not remember which subscription they canceled last, of those who remembered:
- 32% had recently canceled a streaming subscription
- 15% had recently canceled a digital subscription.
- 13% had recently canceled a gym subscription.
The top 3 reasons consumers gave for canceling a subscription in 2024 included reducing spending, no longer wanting the subscription, and price hikes. When asked what may have prevented them from canceling a subscription:
- 38% would have stayed subscribed if offered a discount.
- 38% would have stayed on if offered a lower-priced tier.
- 22% would have considered staying if their subscription was part of a larger bundle.
In terms of communications, 48% of consumers said email was their preferred communication channel for receiving subscription updates, new offerings, promotions, discounts, and more.
Around 27% said they only wanted to be emailed once a month about their plan, promotions, or discounts while 16% preferred communications on an as-needed basis.
Subscription Business Statistics
Subscription businesses grow revenues 5-8 times faster than traditional business models17. They also have a customer lifetime value (CLTV) that’s 5 times higher than traditional businesses. From marketing to technology and more, we explore key subscription business insights below.
Subscription Marketing Statistics
When asked about their top 3 objectives in 2024, 57% of marketers working with subscription brands said customer acquisition.
In addition, 47% said they wanted to focus on customer engagement and loyalty while 41% said customer retention.
In terms of how subscription brands used personalization in their communications, 43% personalized based on age, gender, and location.
40% personalized based on customer journey while 38% personalized based on previous purchases.
To ramp up their marketing efforts 75% of subscription brands planned to increase content production, while 69% planned to use TikTok.
In addition, 63% planned on using AI in their marketing campaigns while 60% planned to increase their influencer marketing budget.
32% of subscription brands considered email marketing their most impactful third-party solution.
Next, 21% said payment processing. This was followed by:
- Advertising at 9%
- Web development at 8%
- Customer service at 7%
- Fulfilments at 5%
- Shipping and Logistics at 5%
- Chargeback at 5%
- Fraud prevention at 3%
- SMS marketing at 3%
48% of subscription brands collected valuable consumer data via their own data platforms.
A further 48% relied on third-party providers while 4% relied on both owned and third-party data.
The most successful sales channels for subscription businesses were email marketing and social media.
Other top channels included referrals, Google Ads, and Direct Mail.
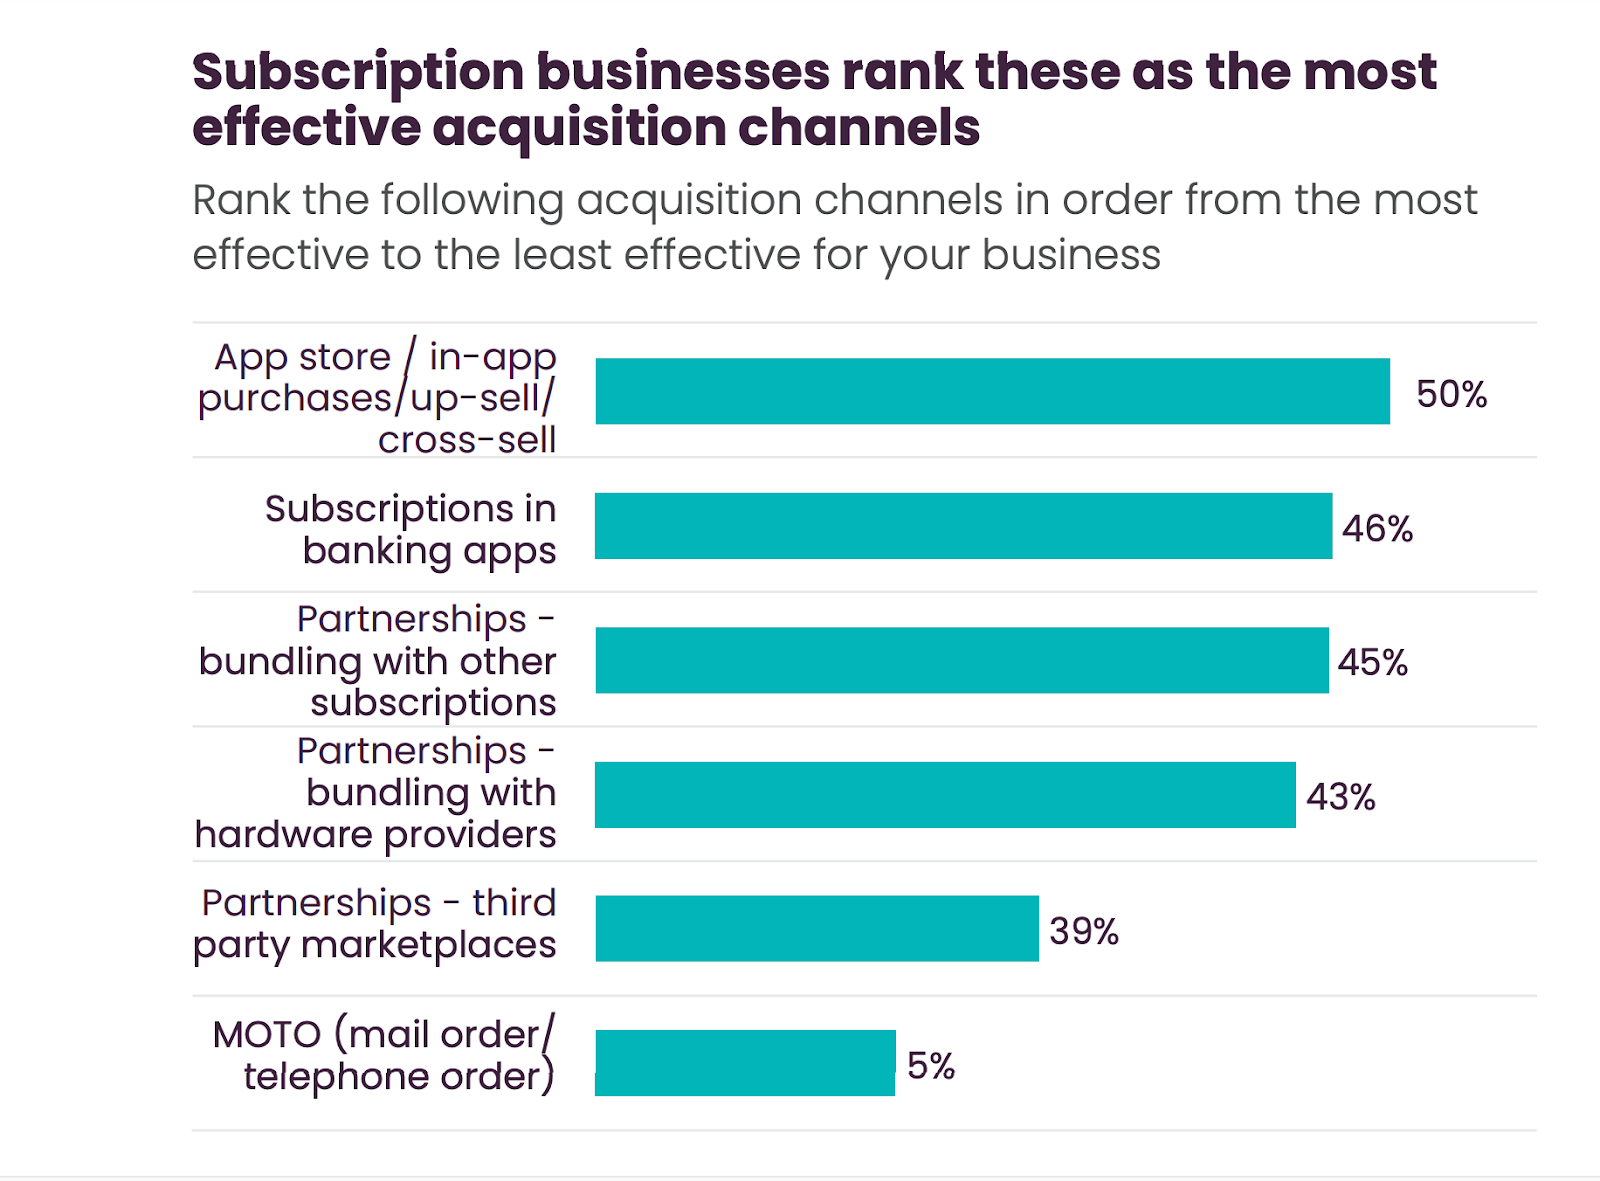
50% of subscription businesses ranked app store and in-app purchases as the most effective acquisition channel.
This was followed by subscriptions in banking apps (46%), bundling with other subscriptions(46%), and bundling with hardware providers (44%).
Subscription Strategy Statistics
50% of subscription businesses planned to diversify their product or service offerings in 2024 to mitigate against economic volatility18.
42% considered price increases while 40% planned to reduce operating costs.
96% of subscription professionals expected their revenue to increase in 202419.
Additionally, 73% of subscription businesses expected to increase their prices in 2024.
50% of subscription professionals anticipated an increase in churn rates in 2024.
As such, 47% of subscription professionals cited increasing customer retention as a key goal for 2024.
In 2023, 82% of subscription businesses were confident that customers canceled for reasons that could be managed.
This was a 32% increase from the previous year, where 62% of businesses believed the same. Experts rated free trials (24%), discounts(19%), and new offers (17%) as the most effective reacquisition tactics.
71% of high-performing subscription businesses had a company-wide churn target in 2024.
These businesses were also better at setting and acting on their retention goals.
73% of companies used churn management strategies while 20% adopted a reactive approach.
Meanwhile, 70% used offers to encourage resubscription.
98% of subscription businesses said their collection of first-party data had increased between 2023 and 2024.
In addition:
- 94% used first-party data collection to drive personalization.
- 81% said collecting first-party data was a strategic priority.
- 80% optimized their first-party data capabilities to stop users from exploiting free trials.
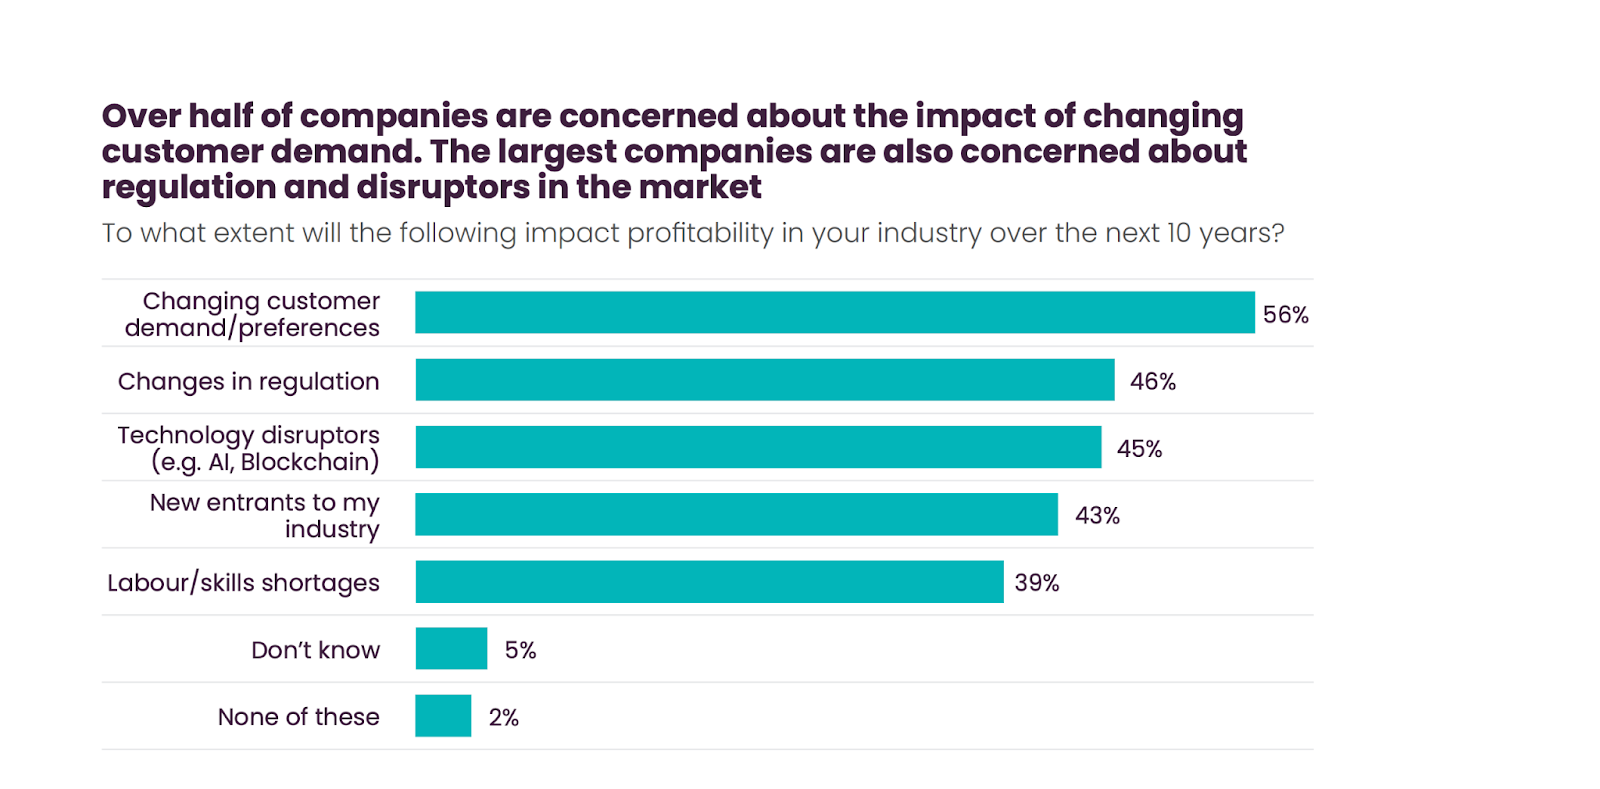
Subscription Challenges Statistics
As of 2024, businesses with a turnover of more than $100 million were more likely to be concerned about changing customer demand and preferences (80%).
Technology disruptors were next with 68% of subscription businesses citing them as a concern.
23% of subscription businesses cited rapidly changing technology and keeping up with market trends as their top concern.
This was followed by hiring and retaining top talent at 16% and achieving revenue goals at 14%.
Subscription businesses that expected their revenue to increase were primarily concerned about new channels (15%) as well as meeting their revenue targets(12%) in 2024.
On the other hand, businesses that expected their revenue to decline or stay flat were primarily concerned about staying solvent (15%) and the costs of acquiring customers (11%).
21% of subscription businesses stated that prioritizing customer retention was a challenge because it distracted them from acquisition.
A further 20% said that retention was a challenge due to a lack of the right tools and technology.
Subscription Technology Statistics
In 2024, subscription companies allocated 32% of their budgets to product, data, and tech.
Additionally, 75% increased their investment into product, data, and tech in 2024.
Over 83% of subscription businesses invested or planned to invest in AI.
66% of businesses used or planned to use AI for round-the-clock customer service, while 61% used or planned to use AI for messaging, pricing, and product personalization.
In terms of leveraging AI, 33% of subscription brands used AI for content selection and generation.
Meanwhile, 45% used AI for email subject lines, and 41% used AI for customer retention.
As of 2024, Cloud was the most common type of capability subscription businesses invested in at 71%, followed by advanced analytics tools (56%).
44% of subscription businesses invested in AI tools, while 50% planned to invest in both AI and API integrations.
The most common subscription billing and invoicing system among subscription businesses in 2023 was Stripe, with a 23% share.
This was followed by Maxio/Chargify with a 19% share and Chargebee with a 13% share.
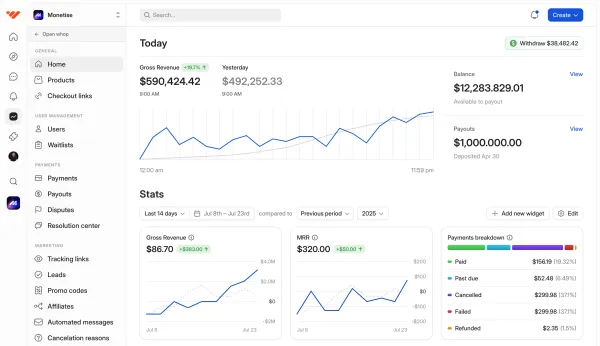
Create and manage paid subscriptions with Whop
If you're looking to make money with online subscriptions, then you're in the right place. Whop is a social commerce platform that helps anyone become an entrepreneur and sell digital products and services online.
With Whop, you create your own whop, which is your internet hub. Within your whop, you can upload files like ebooks and software for sale, create online courses, make a private community, and more.
Then, charge a subscription fee to access these products. You can create tiered subscriptions, bundle your products, offer free trials, and best of all, Whop manages your subscriptions for you.
Subscription management is key to running any subscription-based business, and the right subscription management software will help you to reduce churn, grow your business, and keep increasing your revenue. If you're selling subscriptions, then you should be selling with Whop.
Sources