CLV (Customer Lifetime Value) is the total amount of money a customer is expected to spend with your business over the entire time they remain a customer. Discover why it is so important to your business' success.
Key takeaways
- CLV reveals which customers drive long-term profit, helping you optimize marketing spend and retention strategies.
- Boost CLV by increasing order value, purchase frequency, or customer retention—not just acquiring new customers.
- Retaining existing customers costs far less than acquiring new ones, making loyalty programs essential for growth.
Customer lifetime value (CLV) is how much revenue an average customer brings you over their entire relationship, and it’s a cornerstone for pricing, marketing, and sustainable growth.
In this guide, you’ll get the plain-English definition, the exact formula, and practical plays to raise CLV starting today.
What is customer lifetime value?
Customer lifetime value (CLV) measures how much money a customer brings to your business over the entire time they buy from you.
It’s a simple but powerful metric that helps you understand the long-term value of each customer, so you can make smarter decisions about pricing, marketing, and retention.
CLV becomes more accurate as your business grows and you collect more data.
Just remember - it’s not a one-time calculation. Tracking CLV over time shows whether your strategies are actually improving customer loyalty and revenue.
Two types of customer lifetime value
There are two ways to look at CLV: historical (what happened) and predictive (what’s likely to happen next).
Historical customer lifetime value
Historical CLV uses past sales and retention data to show current lifetime value.
Now, this CLV calculation is easy, because it doesn’t require complicated forecasting models. Instead, it is based on sales data and measured customer behavior.
All you need is acalculator, and the result is a pretty accurate CLV from a certain point in time to the present.
But, past experience is not an indicator of future results. Just because customers spent a certain amount per transaction and stayed with your business for an average of 3 years, for example, doesn’t mean that will stick with you for another 3.
Predictive customer lifetime value
Predictive CLV uses models to forecast future value, combining your data with market factors so you can plan and budget with more confidence.
It is much more complicated. Predictive CLV can become extremely complex and include economic data like interest rate predictions, unemployment rates, inflation, and GDP, along with market data like expected industry growth and demographic impacts.
The upside is that with predictive CLV you use a huge range of relevant data to forecast your business' growth.
But predictive CLV requires very complex calculation models that go beyond what you can do with a calculator or a simple spreadsheet.
Why is CLV so important for business success?
CLV shows where your real revenue comes from and how to get more of it.
Here’s why it’s so important:
It grows your revenue
Knowing how much each customer is worth helps you focus on what actually drives profit, like improving retention, optimizing pricing, or upselling to loyal buyers. Breaking CLV down by audience reveals which customers deliver the most return.
It cuts costs
CLV shows where your budget isn’t working. Maybe some ad campaigns stop being worth it after a certain point, or some upsells waste your team’s time. CLV helps you put energy (and money) where it matters.
It boosts retention
Tracking CLV forces you to look at how long customers stay and why they leave. It gives you hard data on loyalty and churn so you can fix weak points before they hurt your bottom line.
It sharpens your targeting
By analyzing CLV across demographics or customer types, you can pinpoint your most valuable audiences and build marketing that attracts more of them.
It improves forecasting
Consistent CLV tracking helps you plan ahead with confidence. It reveals trends, validates your strategies, and makes financial projections far more accurate.
In short, CLV tells you what’s working, what’s not, and where your business should go next.
Measuring and calculating customer lifetime value in 5 steps
Let’s break down how to calculate your historical CLV - the version based on real numbers from your actual customers, not predictions or forecasts
Step 1: Average purchase value
To calculate the average purchase value, take the total revenue for a specific time period and divide it by the number of individual purchase transactions in the same period.
This value reveals how much a customer spends per transaction. It’s a valuable metric on its own, as it can reveal opportunities for increasing revenue per transaction through cross-selling or bundled product offers.
Step 2: Average purchase frequency
To calculate the average purchase value, you need to divide the total number of individual purchases in a specific period by the number of unique customers in that same period.
The number of purchases is already available from Step 1, but gathering data on unique customers can be more difficult.
For SaaS business models where customers pay monthly, it’s much easier than a coffee shop owner, for example, where there are many cash transactions. So, tracking the relevant data points requires a good CRM system with highly accurate customer records.
Step 3: Average customer value
With steps 1 and 2 completed, it’s time to calculate the average customer value, by multiplying the average purchase value from step 1 by the average purchase frequency from step 2.
It’s important to understand that this is the customer value for the same chosen time period used to gather metrics for the first two steps.
Step 4: Average customer retention rate
Calculating the average customer retention rate, aka customer lifespan, requires dividing the sum of customer lifespans by the total number of customers.
One of the most difficult things about this metric is understanding whether a customer is still active or not.
For example, some people might only return once every 18 months, and without long-term data, it can quickly happen that such a client is dismissed as inactive when, in fact, they might return to buy in a few months.
Step 5: Calculate CLV
With the values calculated in Steps 3 and 4, it’s now possible to work out the lifetime value of a customer. Again, it’s vital to note that without correct input values, this calculation could provide a wrong reflection of true customer value.
Calculating CLV involves multiplying the average customer value from step 3 by the average customer retention rate from step 4.
Example CLV calculations
Still a bit unsure how CLV works? Let’s break it down with two quick examples - one simple, one more advanced.
Simple coffee shop example
Let’s say you run a coffee shop near a college campus. The average order value is $6, and your regulars, mostly students, visit 4 times a week. The college year runs for 34 weeks, and on average, students stay in town for 4.5 years.
That means each student is worth about $3,672 over their time in college.
Of course, locals and staff might stick around for longer, which is why segmenting your customer base gives you an even clearer picture of your true CLV.
Tip: Using a POS system and loyalty program helps you collect the data needed for accurate CLV tracking.
Complex SaaS example
Now let’s look at a software company that sells cloud storage on three pricing tiers: one for individuals, one for small businesses, and one for large enterprises.
Since all sales happen online, the company has clear data on subscriptions, retention, and payments.
| Tier | Monthly Price | Average Retention | CLV Formula | CLV |
|---|---|---|---|---|
| Consumers | $10 | 1.3 years | $10 × 12 × 1.3 | $156 |
| Small businesses | $50 | 3 years | $50 × 12 × 3 | $1,800 |
| Large businesses | $75 | 3.5 years | $75 × 12 × 3.5 | $3,150 |
By comparing these CLVs with customer acquisition costs, the company can easily see which tier brings in the best long-term profit.
10 ways to increase customer lifetime value

Every tactic below moves one of the levers in the CLV formula: increase order value, increase purchase frequency, or extend retention.
1. Increase average order value
Now, this is not as easy as raising prices. Do this and you could actually lose customers, thereby reducing the retention rate and CLV.
A smarter way to increase average order value is to introduce bundle offers. Give buyers discounts if they combine multiple products into one transaction.
2. Increase average customer lifespan
The longer the average person stays with your business, the more that lifetime value will increase - even if your service or product is low-priced.
This is because acquisition costs for new customers are generally much higher than retention costs. It costs much more in marketing to convert a new customer than it would to offer a discount to retain an existing customer.
So, stay loyal to existing customers and they will stay loyal to you.
3. Improve customer acquisition processes

Marketing, advertising, and sales are what bring in new customers, so it’s important to keep improving how you do them.
One simple way to improve is to avoid overpromising and underdelivering. Instead, surprise new customers by giving them more value than they expected. That first positive impression can make all the difference in whether someone becomes a repeat buyer or walks away for good.
4. Streamline onboarding processes
Customer onboarding is the process of familiarizing new clients with a product or service. For example, with a car dealer, this can mean spending some time showing a new car buyer how all the controls for their new vehicle work and how to best get in contact with any further questions or issues that might arise.
In a SaaS company, this can involve detailed training and educational material in different formats to help new customers better understand how to use their newly purchased software.
This is an important step that can improve CLV because convincing a customer to buy is only the first step of a hopefully long customer journey. Making it easier to learn how to get the most out of a product will improve that first impression and foster loyalty.
5. Introduce reward programs
Remember what we said about customer loyalty?
From a simple loyalty rewards offer for a free cup of coffee after ten purchases to more complex discounts for tiered subscriptions, these types of programs can turn one-off buyers into repeat customers.
Plus, having a reward program enables further collection of accurate customer sales data, which is critical to achieving accurate CLV calculations.
6. Set up referral incentives
This might seem like a business practice to boost sales in general rather than CLV, but with the right approach to referral incentives, you can increase retention and set the stage for improved loyalty with new customers.
When you incentivize an existing customer to bring on new buyers (with referral programs and affiliate marketing), those customers will feel like they are being rewarded, encouraging them to stay active for longer.
At the same time, a recommendation from a friend or family member is one of the best ways to reduce acquisition costs while simultaneously setting better expectations.
7. Listen to your customers

The best way to improve customer satisfaction is by listening to what people have to say.
By asking for feedback through surveys, social media, and customer service channels, you can find out exactly what frustrates people and what features they are missing to make their lives easier.
It takes the guesswork out of improving a product and ultimately leads to better CLV.
8. Use MVPs
An MVP, or minimum viable product, is an early version of a product built with just enough features to attract real users and gather feedback.
By testing multiple MVP versions and analyzing how customers use them, businesses can quickly identify what people actually want, and focus development time on the features that matter most.
This approach keeps customers engaged with frequent improvements and shows them you’re listening to their feedback. Over time, it builds trust and loyalty because users see the product getting better based on their real experiences.
9. Respond faster
We live in a time of instant communication, and customers expect quick answers. Slow replies can cost you their trust (and their business).
According to HubSpot, 90% of customers rate an “immediate” response as essential when they have a question, and 60% define “immediate” as within 10 minutes or less.
Meeting those expectations isn’t always easy, but even small improvements in response time can make a big impact - like an auto-reponse to say you will be in touch within 24 hours, or an AI chatbot to take care of basic questions for you.
Quick replies show customers you care, reduce frustration, and build loyalty - all of which lead to a higher customer lifetime value (CLV).
10. Provide free advice and tutorials
The more complicated a product is, the more difficult it can be for customers to take full advantage of all features. Take the iPhone for example; most people probably barely use 30% of its features, mainly because they don’t fully understand all the capabilities.
To address this problem, Apple shares tutorial videos, how-to blogs, and even has in-store learning experiences.
The more customers understand the full potential of what they are buying, the more likely they are to become active repeat customers.
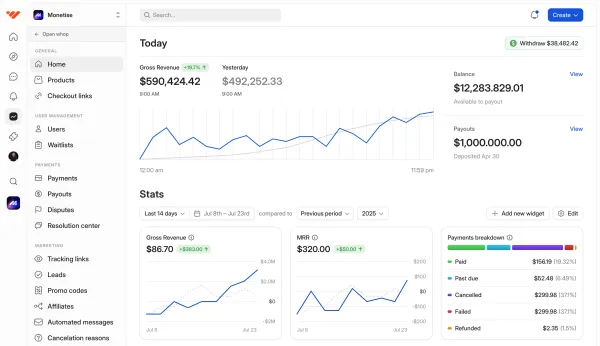
Track and improve your CLV with Whop
If you want to actually see your customer lifetime value in real time - not just calculate it in a spreadsheet - Whop’s built-in analytics makes it effortless.
From your dashboard, you can track exactly how your business is performing: revenue, churn, spend per user, MRR, conversion rates, and even who your top customers are. Every widget updates automatically, giving you a live snapshot of your CLV and the metrics that drive it.
Whether you’re running a SaaS, selling memberships, or building a hybrid business on Whop, all your customer data lives in one place.
That means you can make smarter decisions, improve retention, and scale with confidence.
Launch your business on Whop today - it takes less than 10 minutes to set up, and you’ll have everything you need to sell, track, and grow in one dashboard.
FAQs
What industries have the highest customer lifetime value?
Industries with long-term contracts, recurring services, or high-priced offers see the highest customer lifetime values. At the top of the list are consulting, finance, and insurance, where clients often stay for years and spend large sums over time.
Here’s a breakdown of some of the industries with the highest average CLVs, based on market research:
| Industry | CLV |
|---|---|
| Business consulting | $385,000 |
| Healthcare consulting | $328,000 |
| Commercial insurance | $321,000 |
| Financial advice | $164,000 |
| Digital design | $91,000 |
| Medical billing | $88,000 |
| HVAC | $47,000 |
Is customer lifetime value hard to calculate?
No - you just need a significant sample of historical customer data and some elementary math.
The metrics that you need in order to calculate overall CLV include the following:
- Average spend per customer
- Average purchase frequency
- Customer retention rate
Depending on your business model and history, you should already have a good enough idea of how your business is performing in each of these metrics.