Explore 100+ payment processing statistics for 2026, covering global payment volumes, methods, adoption, costs, challenges, fraud, and AI.
Key takeaways
- Interchange and scheme fees drive 75-90% of US processing costs, so only your processor's markup is negotiable.
- Digital wallets now carry 56% of ecommerce value versus 31% for cards, reshaping how checkouts must be built.
- Missing payment options and checkout failures cost real revenue, with 62% of consumers abandoning carts over them.
Whether you handle hundreds or thousands of transactions, payment processing shapes more of your business than just checkout.
Our breakdown of 100+ payment processing statistics for 2026 covers costs, adoption, customer preferences, fraud, processing challenges, and AI.
From how customers prefer to pay to what processing costs, these figures can help you make more informed decisions about how you accept payments.
Payment processing statistics highlights
- Global non-cash transactions are projected to reach 3.54 trillion by 2029, with around 90% taking place in retail and B2C settings.
- US ecommerce businesses typically pay 2.5% to 3.1% of transaction value in payment processing costs.
- 25% of companies lose more than $1 million annually to online checkout failures.
- 62% of consumers abandon carts when their preferred payment method is unavailable.
- Payments fraud costs merchants more than $200 billion in ecommerce revenue globally.
- Agentic AI is set to account for up to 25% of US ecommerce by 2030.
Payment processing market statistics
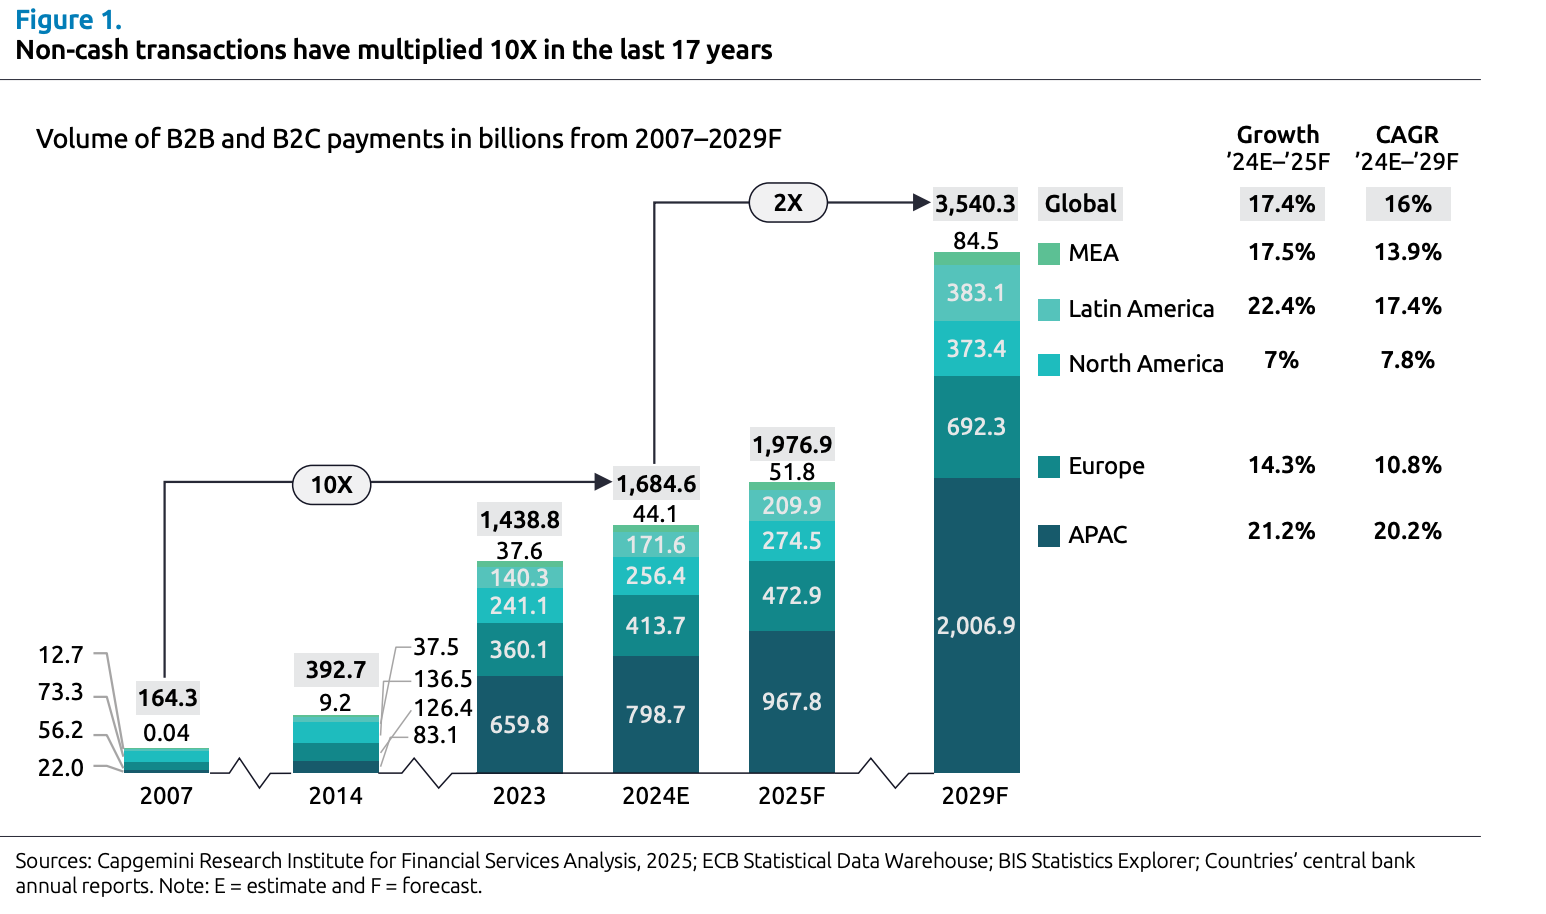
Payment processing, which covers the systems and workflows businesses use to accept customer payments, supports trillions of non-cash transactions each year. According to a 2025 Capgemini report, global non-cash transaction volume has risen more than tenfold in less than 20 years1.
Non-cash transactions were 1.97 trillion in 2025, up 17.3% from an estimated 1.68 trillion in 2024. 90% of all these transactions took place in retail and B2C settings.
- Non-cash transaction volume is projected to grow at a CAGR of 16% from 2024 to 2029, reaching 3.54 trillion transactions.
- Asia Pacific is expected to lead growth with a CAGR of 20.2%, while Latin America follows at 17.4%.
As of 2025, the global payments industry generated $2.5 trillion in revenue2.
This was supported by 3.6 trillion transactions and $2 quadrillion in payment flows worldwide. Between 2019 and 2024, global payment revenue increased by an average of 7%. McKinsey expects this figure to increase by 4% annually to reach $3 trillion by 2029.
In 2026, global digital payment transaction value was around $37.45 trillion, up 6.31% from an estimated $35.23 trillion in 20253.
The digital payments market consists of consumer-to-business transactions made online or at the point of sale (POS) using cards, digital wallets, account-to-account (A2A) transfers, buy now pay later (BNPL), and cryptocurrencies. By 2031, transaction value is expected to grow at a CAGR of 4.31% to hit $46.25 trillion.
The global ecommerce market was worth $39.7 trillion in 2026, up 17.1% from $33.9 trillion in 20254.
B2B commerce accounts for much of that value, with ITA estimating the global B2B ecommerce market at $36 trillion in 2026. By 2033, the global ecommerce market is expected to reach $156 trillion, growing at a CAGR of 21.6%.
In 2026, global B2C ecommerce revenue was $5.18 trillion, up 6.4% from $4.87 trillion in 20255.
Growing at a CAGR of 14.4% from 2017 to 2027, revenue is expected to reach $5.5 trillion by 2027. The leading consumer segments, in order, included:
- Consumer electronics
- Fashion
- Furniture
- Toys and hobbies
In 2026, the global payment processing solutions market, covering the systems used to process digital payments, was worth around $87.4 billion, up 13.7% from $76.9 billion in 20256. Growing at a CAGR of 12.4%, the market is expected to reach $198 billion by 2033.
- At 40.5%, credit card processing solutions held the largest share of the market in 2025.
- North America was the largest regional market, accounting for more than 32.1% of global payment processing solutions revenue in 2025.
The merchant acquiring market, made up of banks and other acquirers that help merchants accept card payments, was worth an estimated $31.24 billion in 2026, up 10.8% from $28.2 billion in 20257.
By 2030, the market is expected to grow to $46.54 billion at a CAGR of 10.5%.
Payment processing costs and fees statistics
Payment processing costs vary considerably by market. In the US, for example, the typical all-in processing or effective rate was 2.5% to 3.1% for standard Visa and Mastercard ecommerce transactions8.
Low-volume ecommerce businesses processing under $20,000 per month typically paid effective rates of 2.7% to 3.1%, compared with 2.3% to 2.7% for businesses processing $20,000 to $75,000 per month.
Card processing costs generally consist of 3 components:
- Non-negotiable interchange fees set by card networks like Visa and Mastercard that go directly to the card-issuing bank (1.15% to 3.15%).
- Non-negotiable scheme fees charged by Visa and Mastercard for network access (0.13% to 0.15%).
- Negotiable processor markups that represent payment processor profit and vary by provider (0.10% to 1.5% plus monthly fees, gateway fees and potential per transaction charges)9.
Altogether, this means transaction costs typically fall between 1.4% to 4.8% per transaction.
Interchange fees account for the largest share of payment costs at between 70% and 90%. Meanwhile, network fees account for anywhere between 5% and 10%, and processor markups roughly between 5% and 20%.
US merchants pay some of the highest credit card processing and interchange fees in the world. According to an MPC report, the fees big banks and global card networks charged merchants in the US hit a new record high of $198.25 billion in 202510.
That’s a 5.9% increase from $187.2 billion in 2024. It’s also a notable 80% increase since 2020, and a 219% hike from $62.1 billion in 2009, when MPC first started tracking the fees.
The report found that swipe fees for all brands of credit cards in the US were $157.8 billion in 2025, up 6.3% from $148.5 billion in 2024.
At $118.8 billion, Visa and MasterCard credit card swipe fees made up over 75% or the majority of the total fees in 2025.
The same report also found that the average swipe fee rate for Visa and Mastercard-branded credit cards was 2.36% of the transaction amount, up from 2.35% in 2024. This rate has increased steadily from 2.02% in 2010.
Averaging 2.36% of the transaction but ranging as high as 4%, swipe fees account for merchants' highest operating cost after labor.
MPC also reported that debit card swipe fees in the US were $40.5 billion in 2025.
That’s up 4.7% from $38.7 billion in 2024.
A CMSPI report covering payments looked at $50.7 trillion of spending and $509 billion of payment fees and found that as of 2025, global merchant payment fees averaged 0.95% across various methods like cards, cash, BNPL, digital wallets and bank transfers11.
Of these payment methods, BNPL was the most expensive for merchants with average estimated fees of 2.77%; this was followed by credit cards in third place at an estimated 1.65% on average.
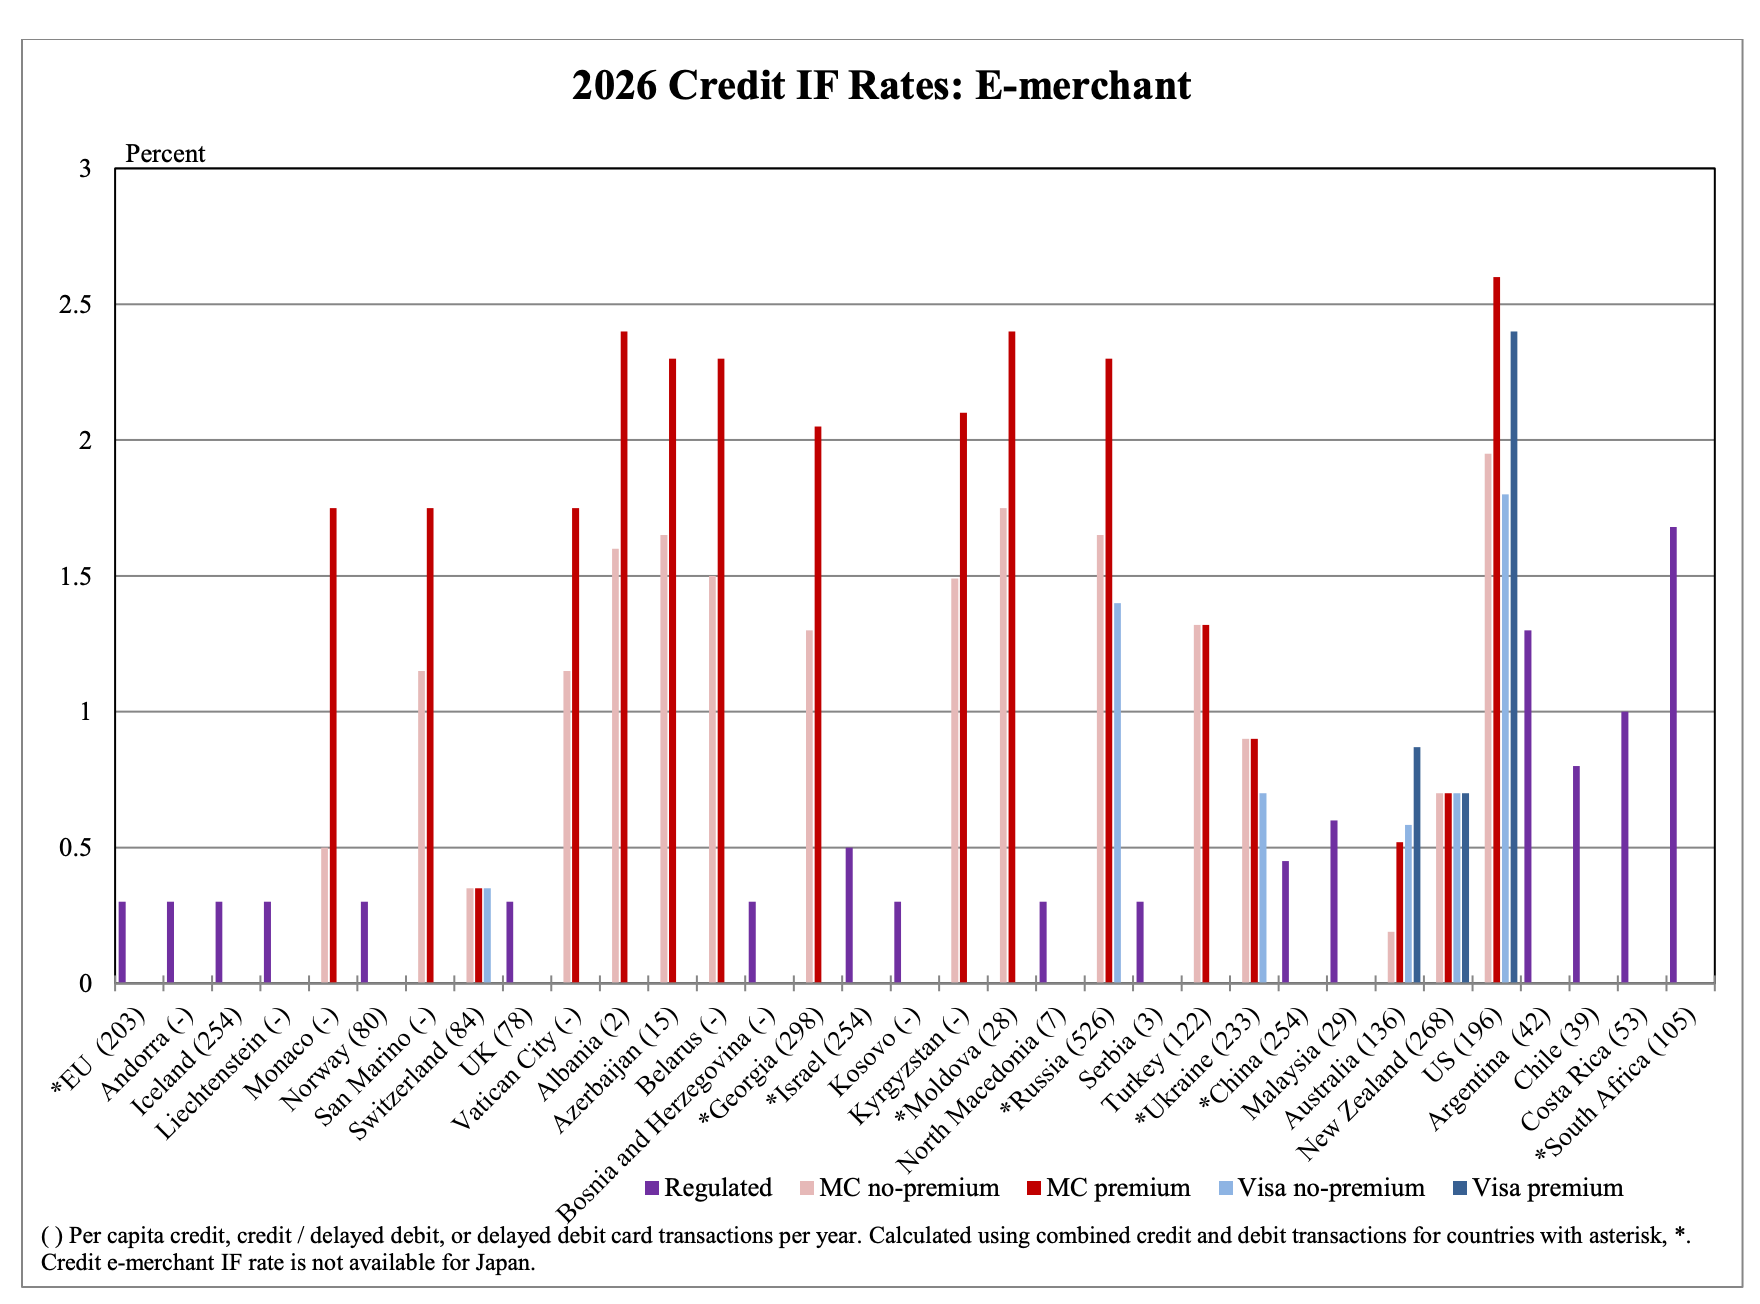
In a 2026 Federal Reserve Bank of Kansas City report, US ecommerce merchants paid credit card interchange fees ranging from 1.8% to 2.6% for Visa and Mastercard transactions in the US, depending on whether the card is standard or premium12.
Under a 2025 settlement with US merchants, Visa and Mastercard agreed to bring average credit card interchange rates down by 0.10 percentage points. The lower rates are set to remain in place for 5 years, although the interchange fee charged on individual transactions can vary significantly.
The same report compiled interchange fees for e-merchants around the world:
- Canada: ecommerce interchange rates range from 1.375% to 2.375%. Visa ranges from 1.375% to 2.375%, while Mastercard ranges from 1.50% to 1.90%.
- Europe: The EU rate is capped at 0.30% for consumer credit cards. The UK is also listed at 0.30%, while Switzerland's ecommerce rate is 0.35%.
- Asia: China has a regulated ecommerce interchange rate of 0.45%, while Malaysia's is 0.60%.
- Oceania: Australia has some of the lowest ecommerce rates, ranging from 0.19% to 0.869%. New Zealand's listed ecommerce rate is 0.70% across Visa and Mastercard.
- Latin America: Ecommerce interchange rates are listed at 1.30% in Argentina, 0.80% in Chile, and 1.00% in Costa Rica.
- Africa: South Africa's regulated ecommerce credit card interchange rate is 1.68%.
In the EU, Visa and Mastercard interchange fees for consumer cards have been capped at 0.2% for debit and 0.3% for credit cards since the 2015 Interchange Fee Regulation (IFR)13.
- Commercial cards are excluded, and interchange fees are up to 6x higher than consumer cards, ranging between 1.3% and 2.4%.
- Eurocommerce estimated merchants in Europe had paid at least €4 billion more in interchange fees in 2025, compared to if capped at IFR rates.
Businesses lost an average of 3% to 5% of every cross-border transaction to hidden costs, FX markups, intermediary bank charges, and payment network assessments in 202614.
- Visa and Mastercard cross-border card fees typically ranged from 0.6% to 1.4% of the transaction amount, on top of interchange and processor fees15.
- Payment platforms typically charged 0.5% to 2.0%, although fees varied widely by provider and tended to be bundled into the broader pricing structure.
Payment processing methods statistics
Worldpay’s 2026 Global Payments Report found that ecommerce transaction value across the 42 markets it covered was over $7.6 trillion in 202516.
It is expected to reach about $11 trillion by 2030.
This spending is spread across a range of payment methods, from cards and digital wallets to BNPL and account-to-account payments.
| Payment method | Major global players |
|---|---|
| Cards | Visa, Mastercard, American Express, Discover, JCB, UnionPay |
| Digital wallets | Alipay, Apple Pay, Google Pay, PayPal, Samsung Pay, Amazon Pay |
| Mobile payments | PayPal, Apple Pay, Google Pay, Samsung Pay, Alipay, Block/Square |
| BNPL | Klarna, PayPal Pay Later, Afterpay, Affirm, Zip, Sezzle |
| Bank transfers / A2A | Trustly, GoCardless, TrueLayer, Plaid, Visa, Mastercard, Worldline, Volt |
| Cross-border payments | PayPal, Wise, Visa, Mastercard, Stripe, Payoneer, Worldpay, Airwallex |
| Crypto payments | Coinbase Commerce, BitPay, CoinGate, NOWPayments, Binance Pay, TripleA |
Whop lets businesses accept payments through cards, digital wallets, and Tap to Pay on iPhone, with 13 buy now, pay later options built in. It also accepts crypto payments globally, converting digital assets to USD at checkout, and supports cross-border payments across 195+ countries and 135+ currencies, so you can accept payments from customers wherever they are, however they want to pay.
The networks and payment methods above process trillions of dollars in transactions each year. For example, in 2025:
- PayPal processed $1.79 trillion in total payment volume17.
- Visa processed $17 trillion in payments and cash volume, while Mastercard processed $10.6 trillion in gross dollar volume18.
- Klarna processed $127.9 billion in GMV, with Pay Later accounting for 80% of the total19.
According to the Worldpay report, cards represented 31% of ecommerce transaction value in 2025.
Credit cards accounted for 20% of the share, while debit cards made up 10%.
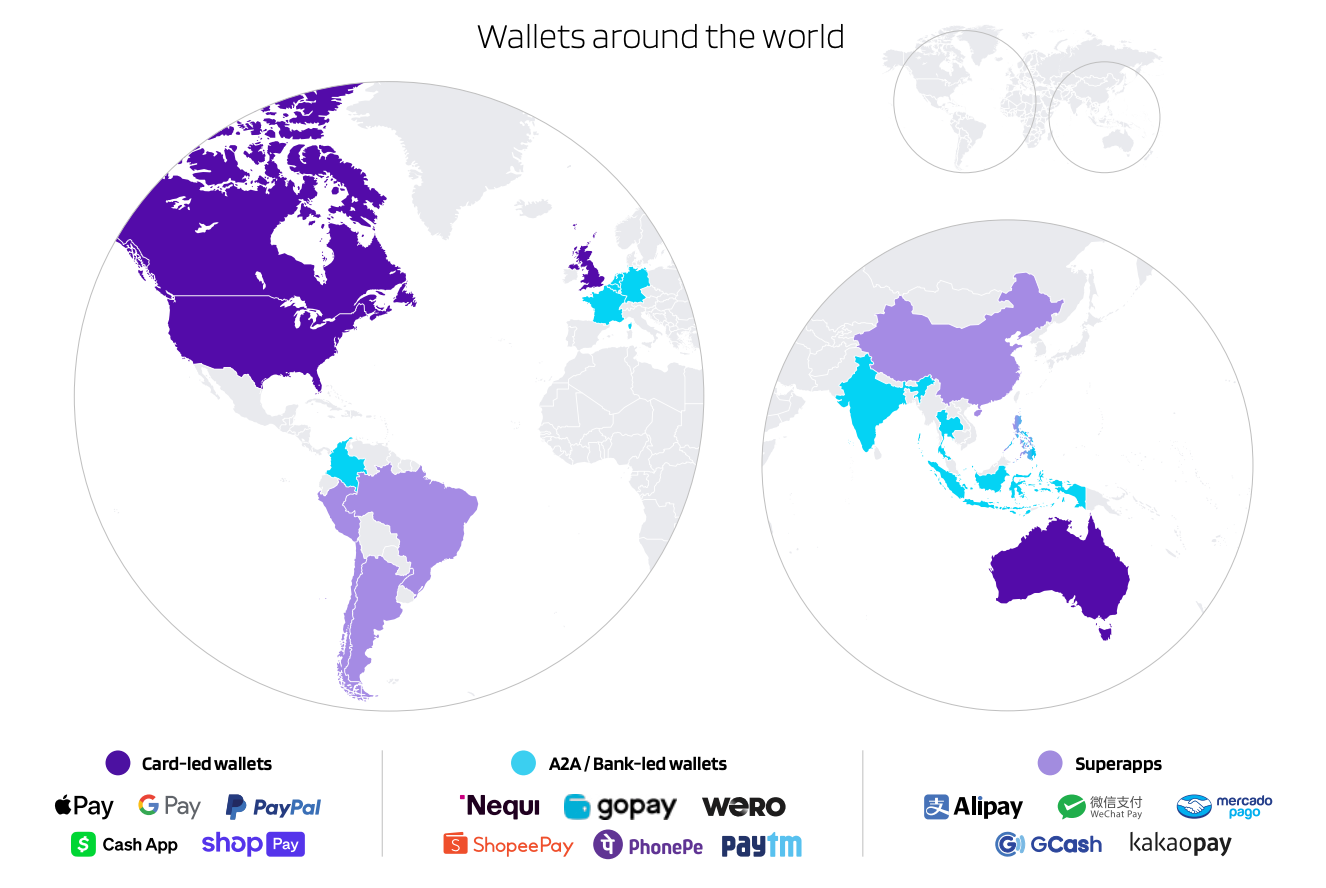
The report found that digital wallets like Apple Pay and PayPal held the leading share of online transaction value in 2025, at 56%.
Digital wallets accounted for 38% of transaction value, or over $13.8 trillion across ecommerce and POS combined.
In the same report, BNPL apps made up 4% of global ecommerce value in 2025.
That’s a 130 fold increase from $2.3 billion in 2014 to an estimated $300 billion in 2025.
From 2025 to 2030, BNPL apps are expected to have a CAGR of 11%.
That’s $500 billion or 5% of global ecommerce value.
Meanwhile, account-to-account (A2A) payments accounted for 7% of global ecommerce transaction value in 2025.
They also made up around 4% of POS value that same year.
The report also found that crypto remained a niche payment method at just 0.19% of global ecommerce transaction value in 2025.
Crypto is forecasted to account for 0.28% of global ecommerce value in 2030, or nearly $31 billion, with a 16% CAGR between 2025 and 2030.
Worldpay further reported that annualized estimated global card-backed crypto spending reached $18 billion in 2025.
Visa-issued crypto card spending alone increased by 525% in 2025.
Payment processing adoption statistics
A 2026 CB911 report of 250 merchants revealed that they supported a range of payment options beyond card-not-present (CNP) credit and debit card payments, with the most popular payment capture method being mobile wallets like Apple Pay, Samsung Pay, etc. at 55.2%20.
This was followed by:
- Card present credit/debit card - 54.4%
- Bank transfer (ACH) - 44.1%
- PayPal - 41.9%
- Gift Cards - 25.7%
- P2P payment apps (Venmo, Cash App, Zelle) - 21.3%
- Buy Now Pay Later (BNPL) - 19.1%
- In-App mobile purchase - 14.7%
- Stripe Link - 14%
Merchants globally accepted 4 to 5 ecommerce payment methods on average, according to a 2026 Visa Acceptance report. Cards (76%), digital wallets (68%), and bank transfers (68%) topped the list21.
Additionally, 48% accepted mCommerce payments, and 43% accepted real-time payments (RTP).
In the same report, the methods with the highest adoption rates between 2025 and 2026 included digital wallets (34%), bank transfers (22%), and mobile payments (22%).
Buy now, pay later (BNPL) methods are also growing quickly, with roughly 19% of merchants adopting this payment method.
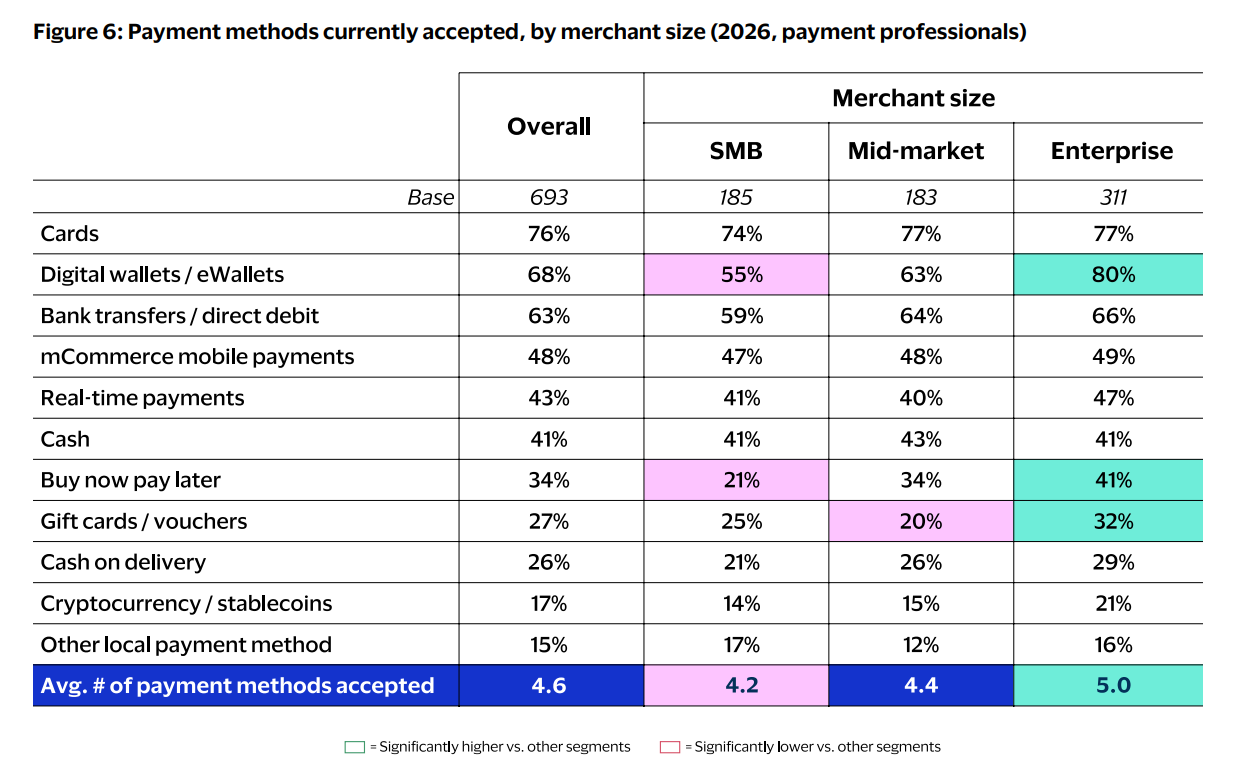
The report also found significant differences in acceptance by merchant size. Generally, enterprise merchants accepted the most at 5. Meanwhile, mid-market merchants accepted an average of 4.4 payment methods, while SMBs accepted 4.2.
There were also slight differences in the mix of payment methods each merchant was likely to accept:
- Enterprise: Digital wallets (80%), BNPL (41%), and gift cards or vouchers (32%).
- Mid-market: Cards (77%), bank transfers (64%), and digital wallets (63%).
- SMBs: Cards (76%), digital wallets (68%), and bank transfers (63%).
The same report also found that the top three payment metrics and performance indicators merchants considered most important to their business were payment success rate (54%), revenue (53%), and cost of payments (45%).
Other KPIs included:
- Loss rates, chargeback and fraud rates - 42%
- Authentication rates - 42%
- Authorization rates - 41%
- Cost of service/ cost per customer - 38%
86% of ecommerce firms that worked closely with payment service providers in 2026 reported increased profitability22.
This figure rose to 90% for firms that collaborated with their providers frequently and proactively.
Consumers and payment processing statistics
According to a 2026 DHL report, shoppers used an average of 4 payment methods23.
Meanwhile, most businesses surveyed offered 7, giving consumers more opportunity to find their preferred way to pay.
The report also found that the payment stage was the most common point of checkout abandonment.
62% of shoppers said they would abandon a cart if their preferred payment method wasn’t there, yet only 45% of businesses saw this as a key driver. Meanwhile:
- 84% of consumers said they wanted one-click checkouts.
- 65% of consumers expect frictionless payments.
- 17% of shoppers said having more payment options would encourage them to complete their purchase.
19% of online shoppers abandoned their cart if they didn’t trust the site with their credit card in 202624.
10% abandoned their cart when their preferred payment method wasn't available or if their credit card declined.
In a 2025 survey of UK and US consumers, 77% used credit cards for strategic purchases and 66% used debit cards for controlled spending25.
Additionally:
- 37% increased debit card usage to avoid debt
- 35% relied on credit cards for financial flexibility
- 23% turned to BNPL services to extend their buying power
In the previously mentioned Visa Acceptance report, over 56% of shoppers said they picked merchants that offer fast, convenient payment experiences.
Stored payment details also played a role in faster checkout, with 45% of shoppers using credentials saved with a merchant for their most recent digital purchase.
In a 2025 survey, 71% of consumers said they’d like to see an increase in security and fraud protection from payment technology26.
64% also said their biggest payment concern was having their data compromised in a breach.
The same survey revealed that 81% of consumers believed it was important for businesses to offer flexible payment options including digital wallets, mobile payments, P2P payments, and BNPL.
Importance also varied by generation, with flexible payment options considered very important by 53% of Millennials and 49% of Gen Z consumers.
Payment processing challenges statistics
A Spreedly report found that 25% of companies lost over $1 million annually to online checkout failures27.
The most common causes included unsupported payment methods (28%) and network or service downtime (17%).
A 2025 BR-DGE study found 92% of surveyed ecommerce merchants had experienced a payment outage or disruption over the last two years28.
50% estimated these disruptions had cost them between £1.1 million and £10 million. Despite this, only 32% had fully automated backup routing between payment providers, while 68% relied at least partly on manual responses when issues occurred.
In the same study, 44% of merchants said technical integration was the biggest obstacle to improving their payment resilience.
54% further noted that payment limitations had delayed or prevented their expansion into new markets.
Ecommerce authorization rates were 6.5% lower than authorization rates for in-person payments in Q4 202429.
The Visa Acceptance report found that merchants used a range of tools to improve their payment authorization rates:
- 41% used intelligent payment routing.
- 40% used strong customer authentication.
- 37% used machine learning to fine-tune fraud management.

According to a Corefy 2025 report, close to 60% of businesses had fragmented payment setups, involving disconnected tools, providers, and workflows30.
At the same time, over 66% relied on more than one payment provider. The report also found that:
- 24.5% of global businesses worked with 10 or more payment providers.
- 43.5% of businesses processing over 500,000 transactions monthly relied on 10 or more providers.
- 27.8% of these businesses said adding a new provider or payment method took several months.
In the Visa Acceptance report, ecommerce merchants experienced a false decline rate of 1.51% of annual sales.
This amounted to lost sales of over $201 billion in 2025. By 2027, this figure is expected to increase by 31.8% to $265 billion.
The report also found that roughly 65% of merchants estimated their rate of false positives on ecommerce orders at between 2% and 10%.
False positives generally went up based on merchant size, with enterprise merchants more likely to report rates above 10%.
72% of merchants reported higher failed payment rates for cross-border sales compared to domestic ones31.
Merchants with significant cross-border payment volume faced an average payment failure rate of 11%. In the US alone, merchants lost $3.8 billion in revenue from failed cross-border payments.
Payment processing fraud and security statistics
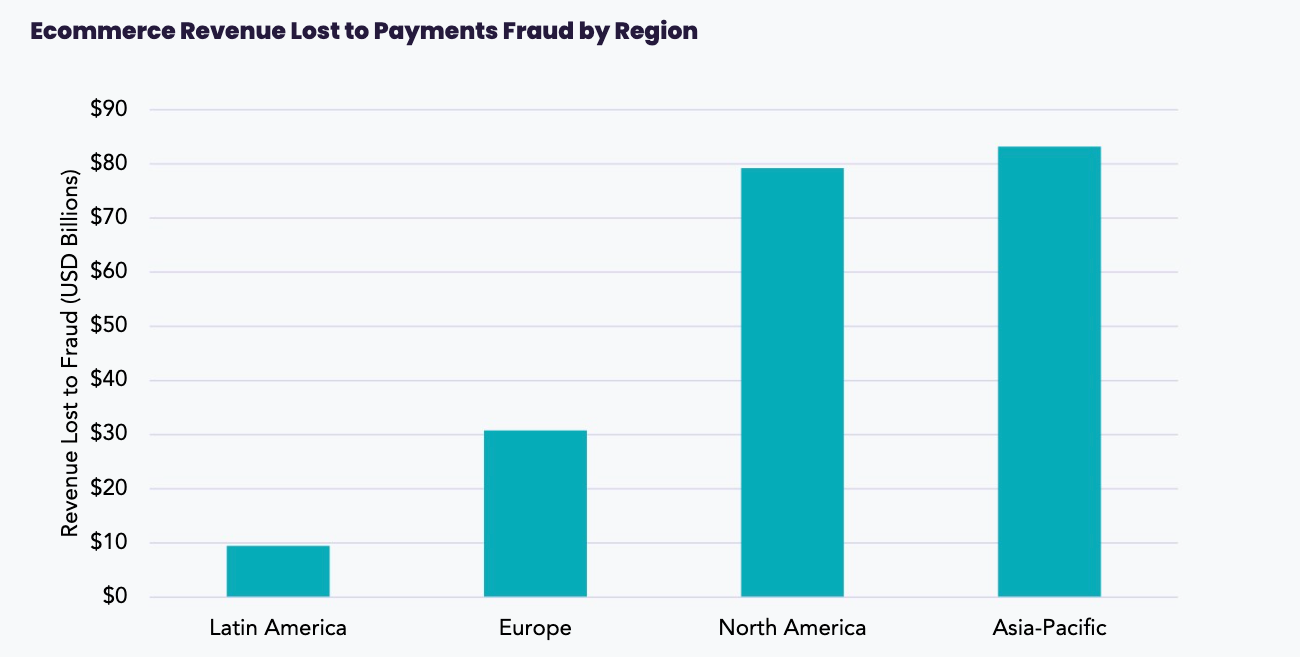
According to the CMSPI report mentioned earlier, over $200 billion of merchant ecommerce revenue was lost to payments fraud globally in 2024.
Roughly 41%, or around $82 billion, was lost in Asia Pacific, while roughly 39% was lost in North America.
Global payment card fraud losses alone amounted to $33.41 billion in 202432.
This fraud was tied to a global card volume of $51.92 trillion. By 2030, fraud losses are projected to reach $41.06 billion on a total card volume of $70.73 trillion.
According to the Visa Acceptance report, 98% of merchants reported at least one form of fraud attack in the previous 12 months.
The average number of different fraud attacks experienced by merchants was 3.8, representing a drop from 4.2 last year. The three most common were:
- Refund/policy abuse - 41%
- Real-time payment fraud - 38%
- Phishing/pharming/whaling - 37%
In the previously mentioned CB911 report, the average chargeback rate was 0.57% of transactions in 2026.
However, just over 25% of merchants reported rates of 0.9% or higher.
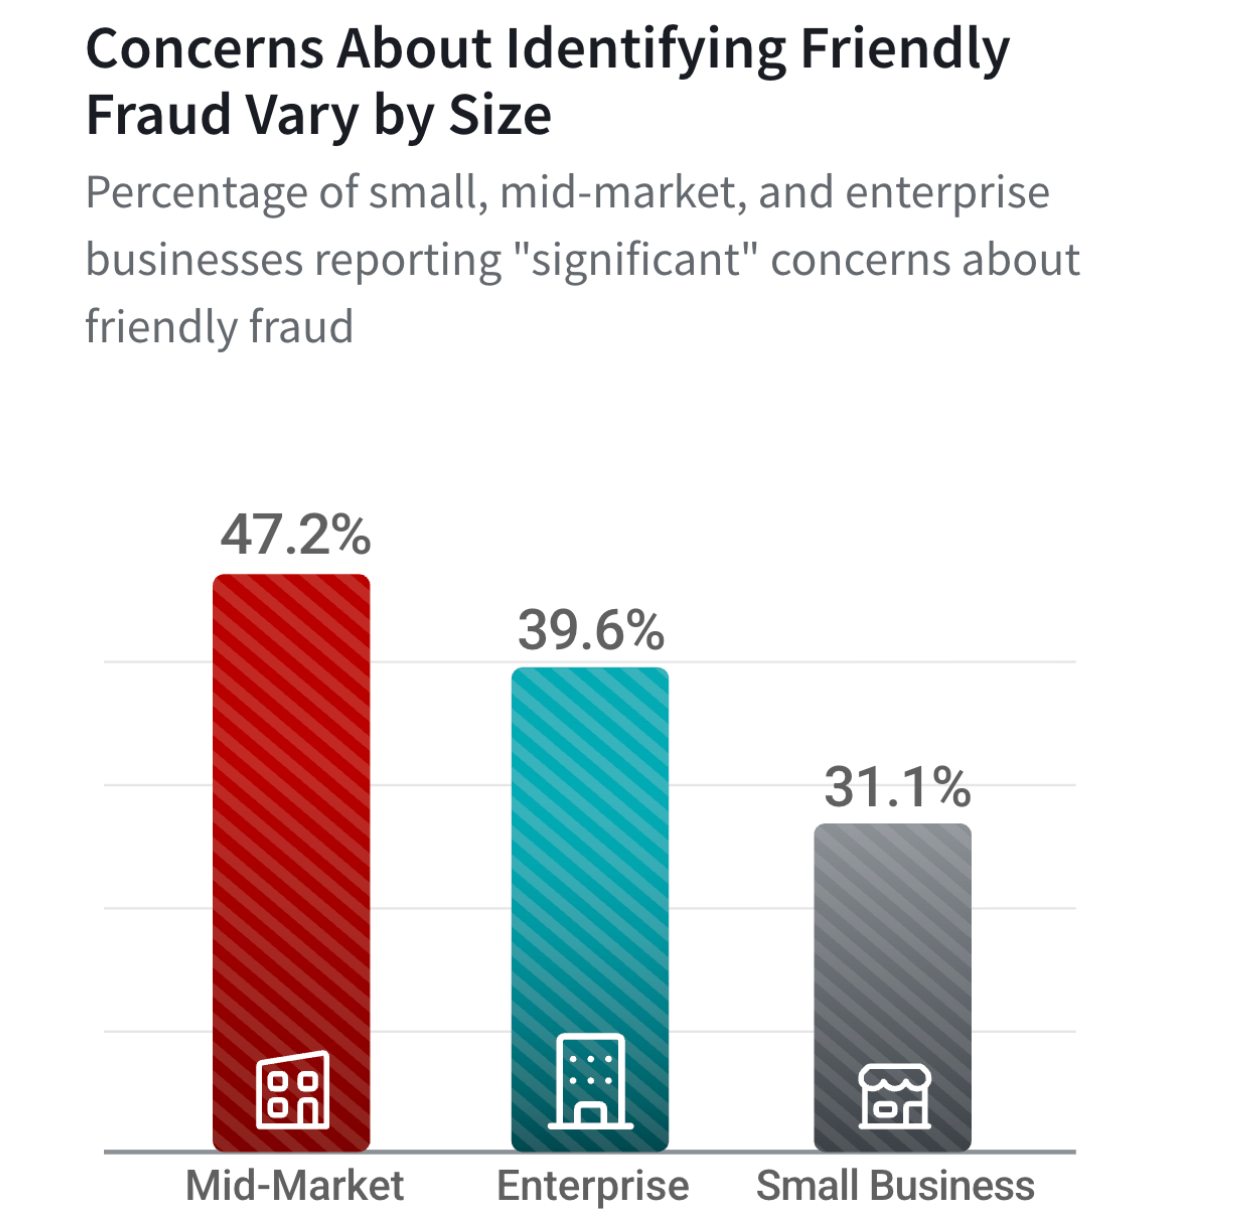
According to the same report, 83.4% reported an increase in friendly fraud over the last 3 years.
Friendly fraud has become a moderate to significant concern for over 75% of merchants.
Respondents estimated illegitimate dispute losses made up around 50% of the chargebacks they received.
The Visa Acceptance report puts the figure at 75% of all chargebacks, while CB911’s own internal data estimated it could be as high as 86%.
The main response to illegitimate chargebacks among over 40% of merchants was blacklisting offending customers.
Other strategies included contacting customers to resolve issues directly (34.3%), and just over 33% of merchants immediately refunded any potential dispute request.
Nearly 50% of respondents said they used dedicated third-party fraud prevention tools as part of a broader strategy.
Top solutions and tools included:
- Pre-chargeback Alerts - 34%
- 3D Secure - 33%
- Chargeback deflection tools - 24%
In the Visa Acceptance report, the three most effective methods merchants used to combat first-party misuse in 2026 were:
- Monitoring and analyzing transaction data for unusual activity - 63%
- Reviewing and analyzing non-fraud chargebacks and declines - 63%
- Requiring card verification values (CVV) codes to process card payments - 62%
The report found that roughly 83% of merchants used compelling evidence to challenge first-party misuse disputes in 2026.
The data points they used as compelling evidence included delivery address (64%), item information (64%), and IP address (61%).
According to the Visa Acceptance report, payment tokenization was used by 72% of merchants, up 12% year-over-year.
Payment tokenization replaces sensitive payment details, such as a card number, with a unique digital token that can be used to process payments without exposing the original data.
Adoption varied considerably by merchant size, with more than 70% of enterprise merchants using at least one form of payment tokenization, compared with 50% of mid-market merchants and 45% of SMBs.
57% of merchants said their key reason for using payment tokenization was payment security and reduced risk from data breaches.
Other reasons included:
- To improve payment authorization rates - 50%
- To deliver better customer experiences - 43%
- To keep customer data automatically updated through life cycle management - 41%
AI and payment processing statistics
In the Corefy report, 8.3% of ecommerce businesses used AI/ML-powered intelligent payments.
That was up from 5.2% in 2024.
Adoption rates were higher among payment providers, with Capgemini reporting that 60% of PayTechs used generative AI across their operations in 2026.
This was compared to only 41% of banks.
In the Spreedly report, 83% of respondents expected that most payments would be initiated, optimized, or completed by AI by 2027.
However, they noted the following concerns:
- Losing customer control and transparency - 22%
- Compliance issues - 22%
- False positives - 22%
Based on Visa Acceptance data, 53% of merchants used AI/ML fraud management tools in 2026.
Meanwhile:
- 44% used pre-authorization fraud detection solutions.
- 37% used vendor-provided solutions.
Around 70% of merchants also used third-party data to support machine-learning fraud tools, helping them assess risk, reduce fraud and false positives, and improve the payment experience.
Agentic commerce, where consumers ask agentic AI to find, recommend, and purchase products on their behalf, is projected to account for up to 25% of US ecommerce by 203033.
As per the Visa Acceptance report, 19% of merchants had a plan and solutions in place to accept agentic AI payments.
63% were actively exploring or implementing solutions to process agentic AI payments in the near future.
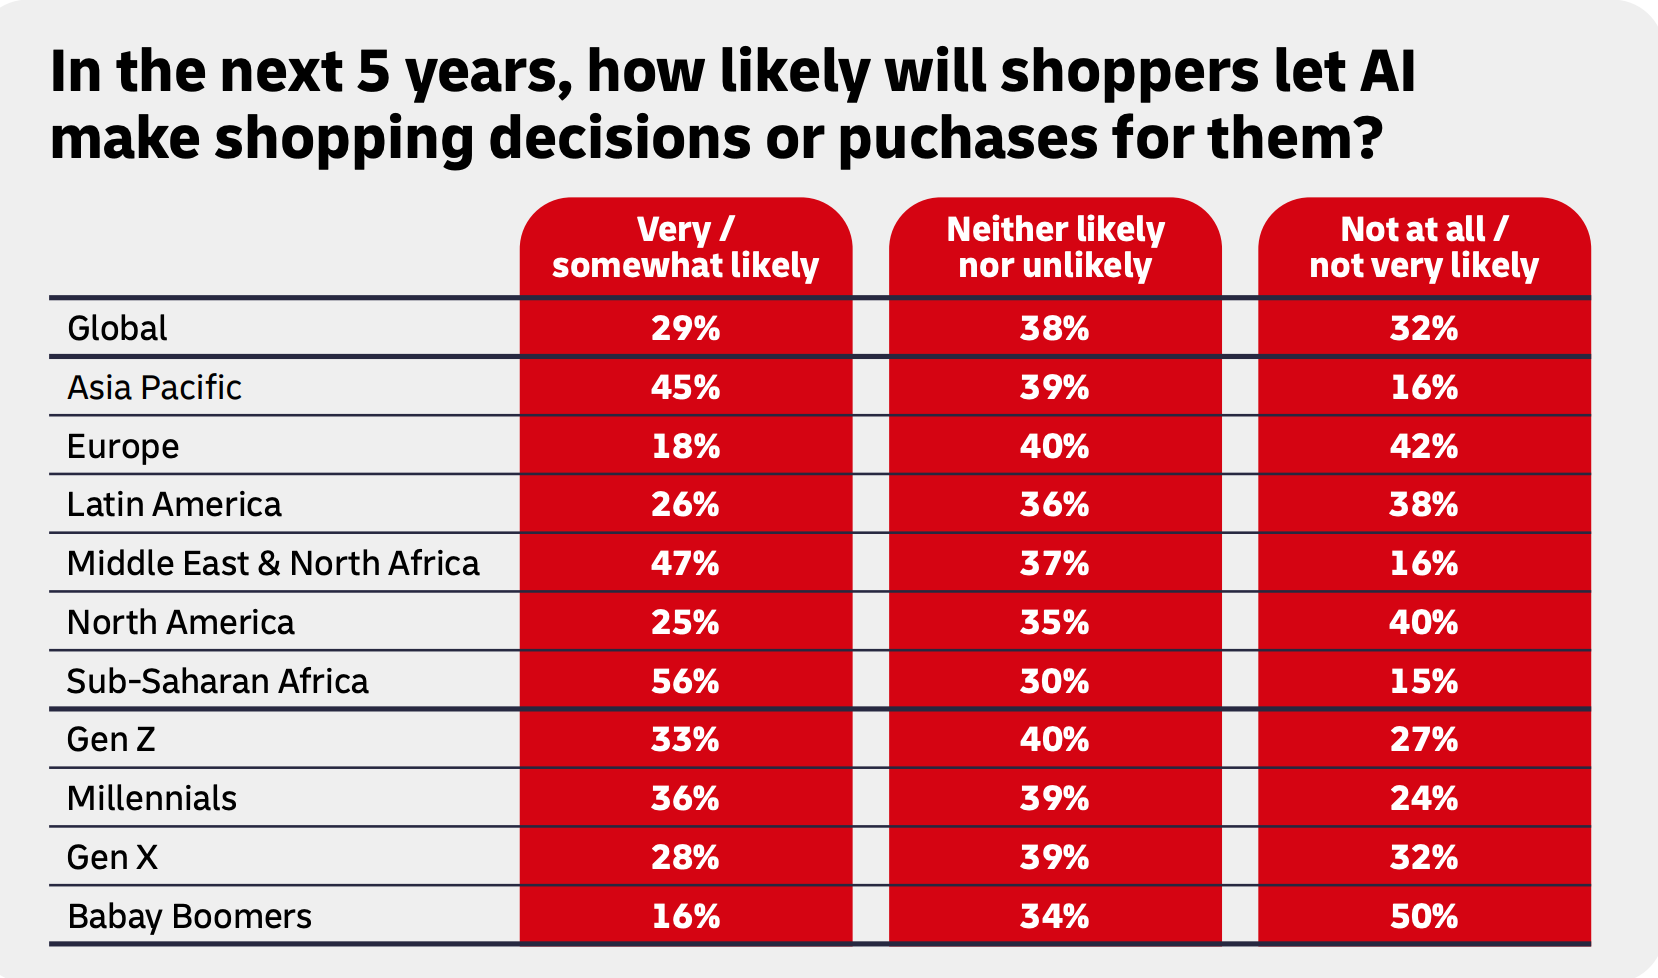
In the DHL report, 29% of shoppers said they were willing to let AI make shopping decisions or purchases within the next 5 years.
Willingness for agentic commerce varied by region:
- 56% in Sub-Saharan Africa
- 47% in the Middle East and North Africa
- 45% in Asia Pacific
- 25% in North America
- 18% in Europe
Millennials were the most willing generation at 36%, followed by Gen Z (33%), Gen X at (28%), and Baby Boomers (16%).
Accept payments with Whop
The data above makes one thing very clear: how you accept payments shapes conversion, cost, and trust just as much as the product you're selling.
Whop powers payments for businesses of every size, from one-person operations like specialty European car restoration shop, VIIIZUTech, which uses Tap to Pay on iPhone, to large global platforms like Replit, which brings Whop's embedded payment components to its own product.
Whop is not a payment processor – it provides the infrastructure to accept payments globally without needing to use separate providers for cards, BNPL, and regional methods. With Whop, businesses get:
- Modern payment methods: access to the world's most popular payment options.
- Buy Now, Pay Later: 13 BNPL provider options, from global solutions like Klarna to regional options like Addi and Kueski.
- Smart payment routing: payments route to the provider most likely to succeed, with automatic retries if one fails.
- Built-in crypto payments: accept major cryptocurrencies at checkout.
Whether you're selling through a checkout link, embedding checkout into your own site or app, sending out invoices, or taking payments in-person with Tap to Pay, Whop provides the payment stack businesses run on.
FAQs
What are the top 5 payment processors?
The top 5 payment processors include PayPal, Stripe, Square, Adyen, and Authorize.Net.
What are the stages of payment processing?
Payment processing typically happens in five stages: initiation (the customer submits payment details), authorization (the card network and issuing bank approve or decline it), capture (the merchant confirms the sale), clearing (banks exchange transaction data), and settlement (funds move to the merchant's account).
What are the five most common payment methods?
The five most common payment methods are cards, digital wallets, bank transfers, mobile app payments, and BNPL.
What's the difference between a payment processor and a payment provider?
A payment processor is the infrastructure that handles a single transaction behind the scenes, communicating with card networks and banks to authorize, capture, and settle a payment. A payment provider (or payments partner) sits a level above that, giving businesses access to multiple payment methods, BNPL options, global currencies, and payment acceptance tools like invoicing or in-person payments, all through one integration. Whop is an example of a payments partner, letting businesses accept payments through cards, digital wallets, BNPL, crypto, and more, without having to manage separate processor relationships for each.
Sources